
invertirenpatrimonio
@t_invertirenpatrimonio

What symbols does the trader recommend buying?
Purchase History
پیام های تریدر
Filter
ETH/USD
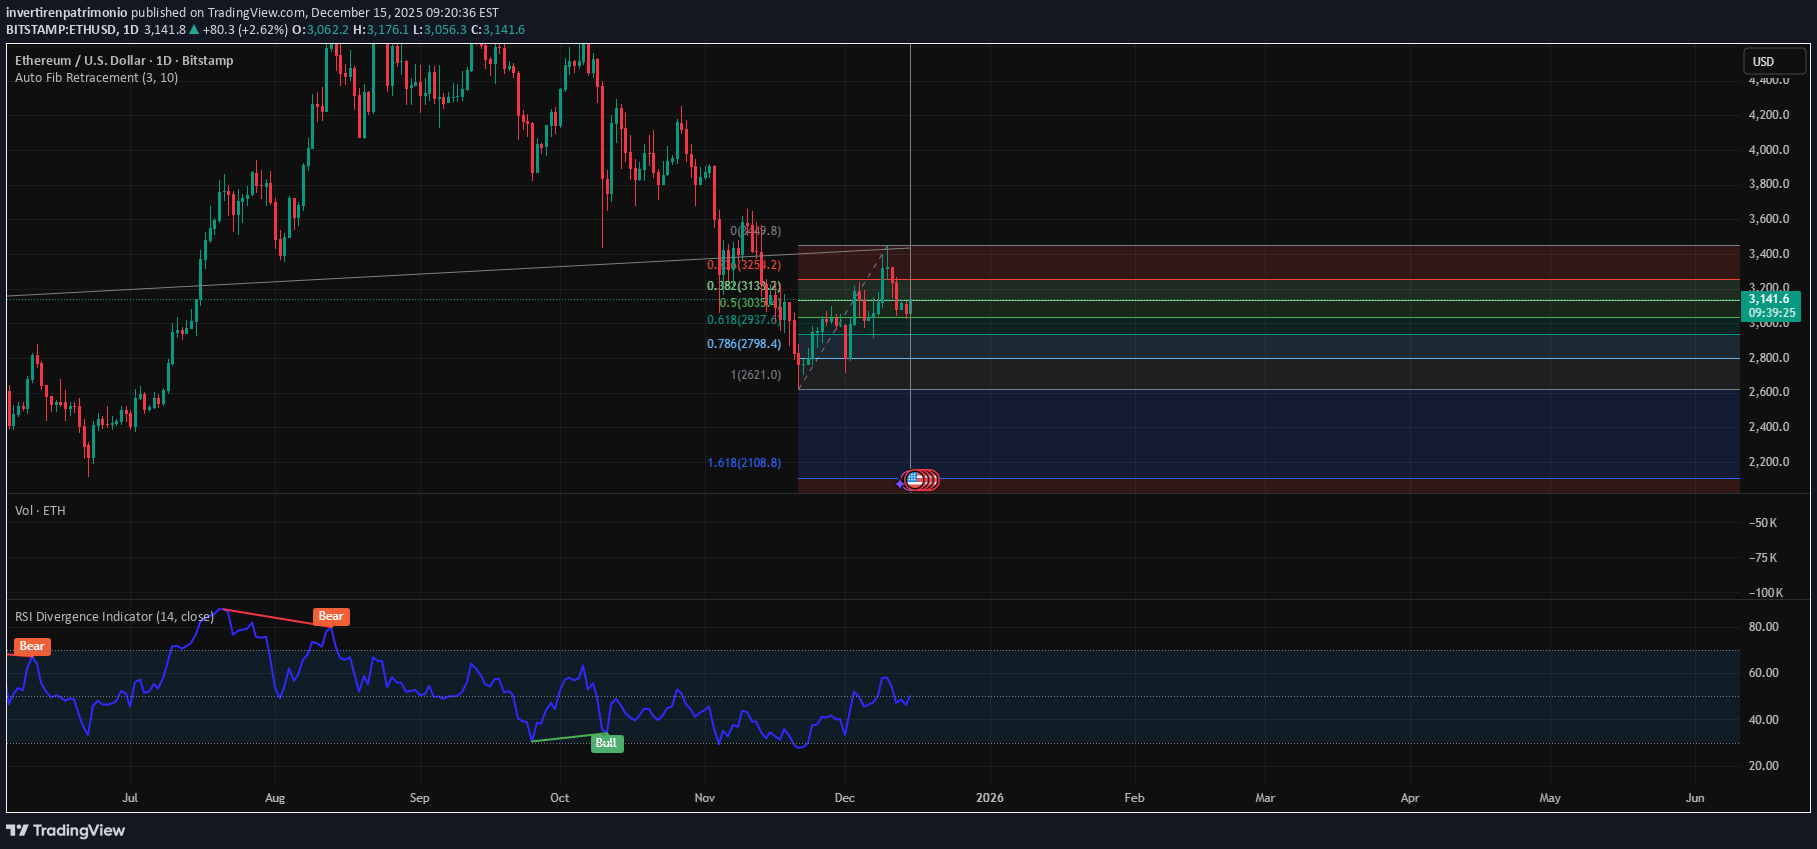
ETH/USD Technical Analysis: The price is currently in a key area after a pullback from previous highs. Using Fibonacci shows important support and resistance levels, with possible consolidation around 0.382 and 0.5. The RSI indicates recovery after the previous divergence, which could anticipate a bullish move if it stays above the green zone. Monitoring range breakout to confirm trend.
سقوط وحشتناک اتریوم (ETH): آیا کف قیمت کجاست؟ تحلیل کامل روند و سطوح خطر
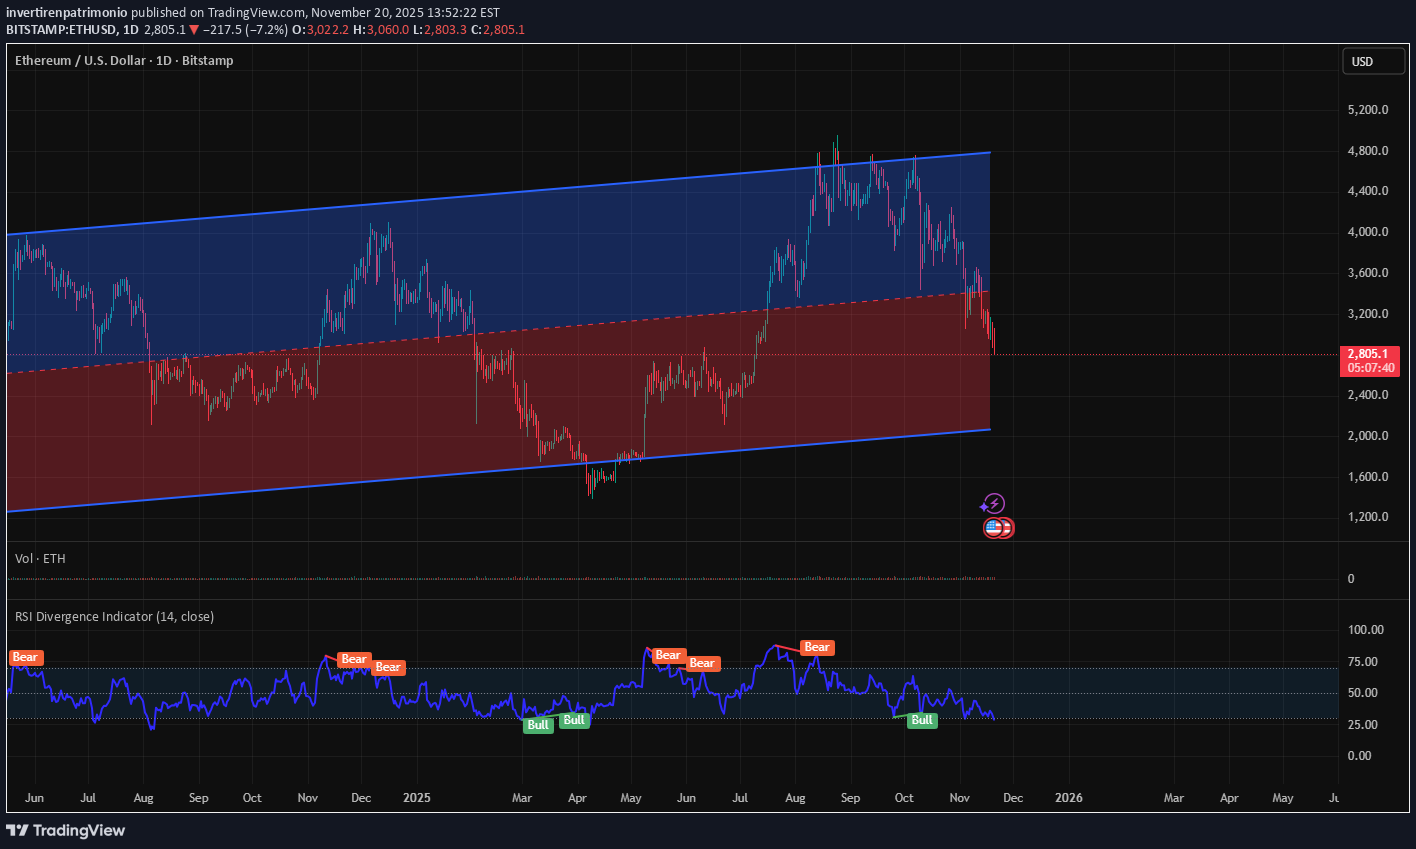
1. Current Price & Drop Price: $2,818.1 Daily Change: -$204.5 (-6.77%) This is a sharp decline, signaling strong bearish momentum. 2. Trend Analysis The chart shows a long-term ascending channel (blue) and a mid-term descending channel (red). Ethereum has broken below the midline of the blue channel and is now trading near the lower boundary of the red zone. This suggests a major trend reversal from bullish to bearish. 3. RSI Indicator RSI is currently below 30, which indicates oversold conditions. Historically, oversold levels often lead to short-term bounces, but given the strong downtrend, this could be a bear trap unless confirmed by volume and price action. 4. Volume & Market Sentiment Volume: 27.22K (high compared to average) → indicates strong selling pressure. News snippet mentions Ethereum ETF speculation, but despite that, inflows are not supporting price, which means macro sentiment is negative. 5. Key Support & Resistance Immediate Support: Around $2,800 (current level). If broken, next major support is near $2,500. Resistance: $3,000–$3,200 zone (previous breakdown area). 6. Risk Factors Broader crypto market is also down (BTC -5.17%, ETH -6.77%), suggesting systemic weakness. Possible reasons: Regulatory uncertainty ETF hype fading Liquidity outflows Short-Term Outlook Expect high volatility. If $2,800 fails, ETH could test $2,500 quickly. Oversold RSI might trigger a dead-cat bounce, but trend remains bearish until ETH reclaims $3,000. Long-Term Outlook If the price stays below the blue channel, the bullish structure is broken, and we could see a prolonged correction.
پیشبینی فنی اتریوم (ETH/USD): سطوح حیاتی حمایت و مقاومت برای حرکت بعدی
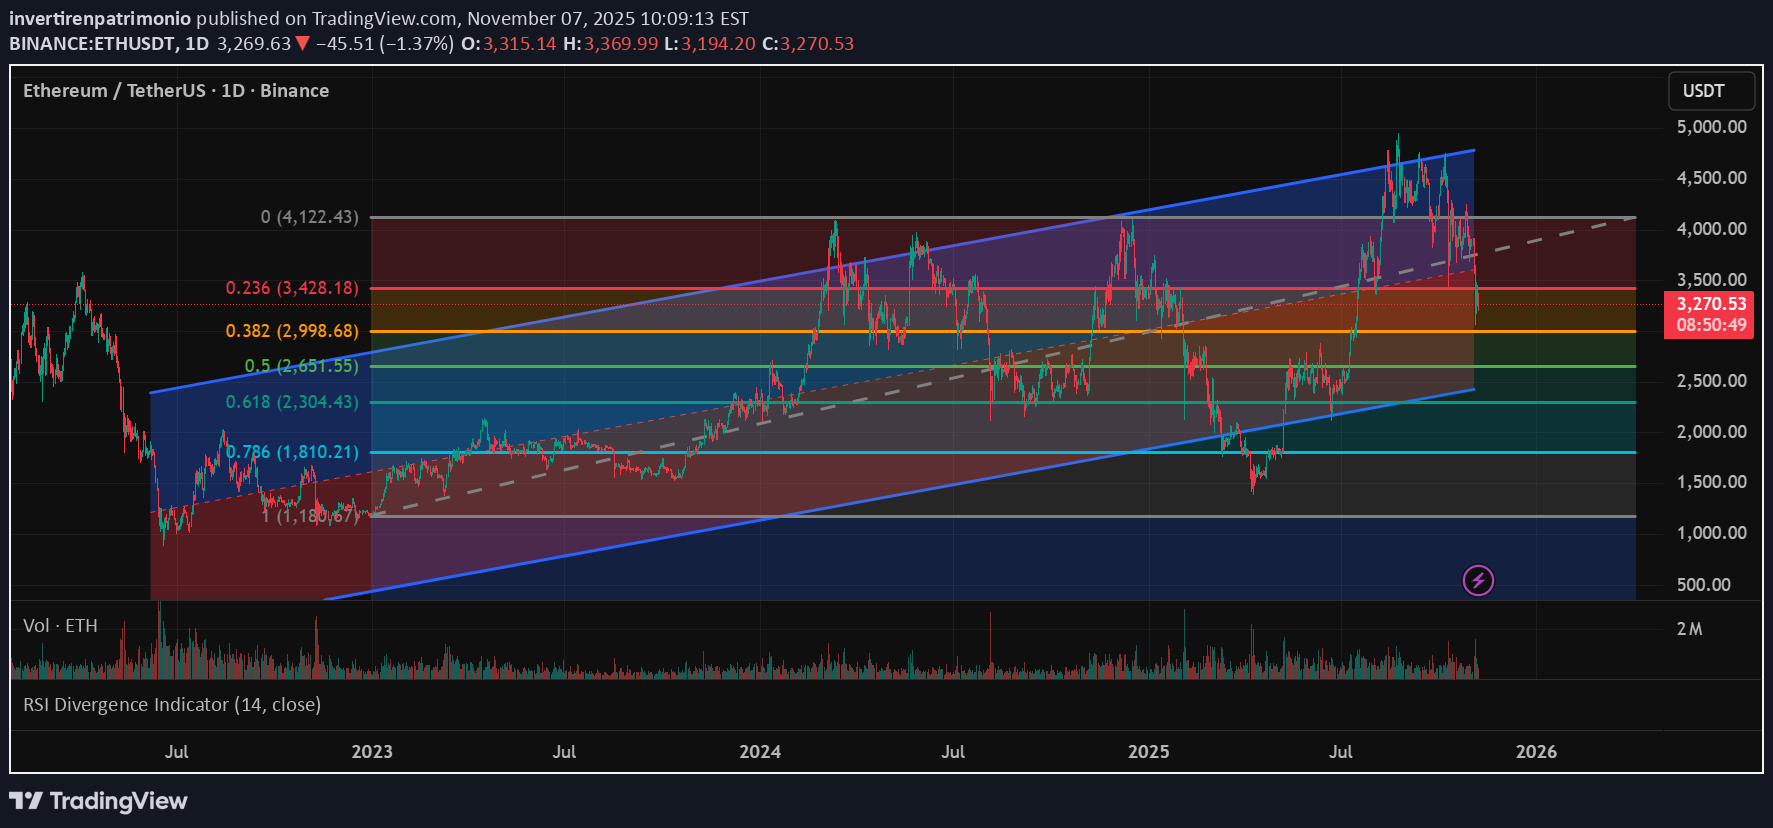
ETH/USD Technical Outlook: Price remains within a long-term ascending channel. Current correction could form an ABC pattern, with key Fibonacci retracement levels at $3,832 (38.2%) and $2,715 (61.8%). If bullish momentum resumes, extension targets point to $4,570 and $5,300
تحلیل تکنیکال اتریوم: آیا کف حمایتی $3200 مقاومت میکند؟ مسیر صعود تا $4500
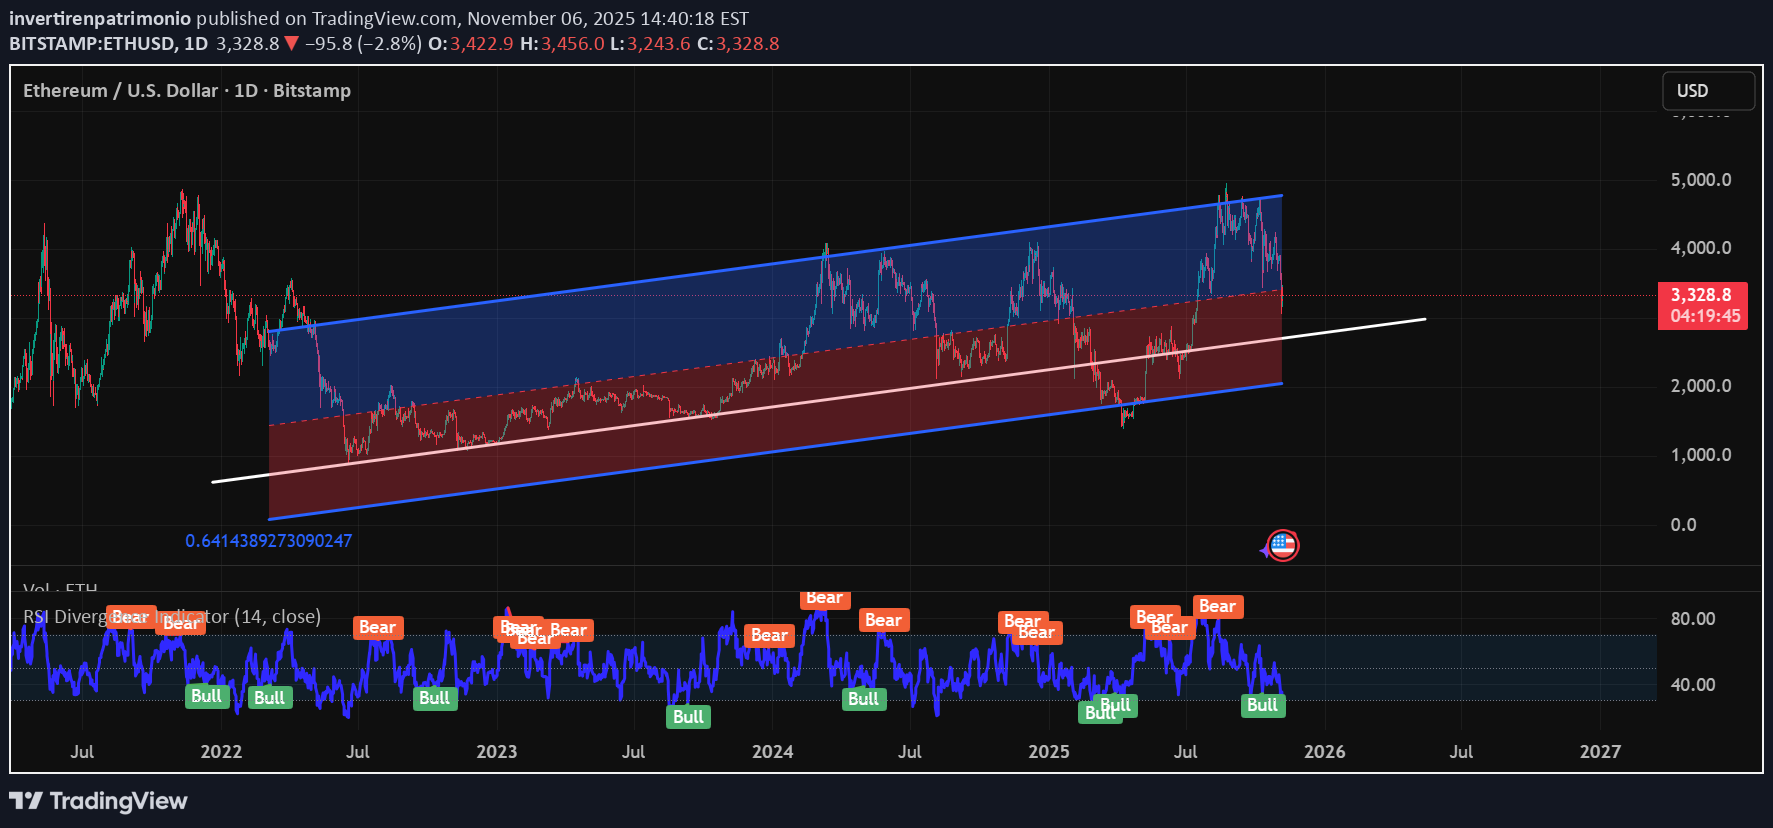
Asset: Ethereum (ETH/USD) on Bitstamp. Timeframe: 1D (daily). Current Price: $3,336 (down 2.58%). Ascending channel marked in blue, with dynamic support in the red zone and a white line as additional support. Key Fibonacci level: 0.641 around $1,519. RSI indicator with divergences and marked “Bull” and “Bear” signals. Technical Analysis Main Trend The price has remained within a broad ascending channel since mid-2022. Despite the recent correction, it continues to respect the structure. Support and Resistance Levels Strong Support: $3,200 (near the lower edge of the blue channel). Critical Support: $1,519 (0.641 Fibonacci level, historical zone). Resistance: $4,000 (recent highs within the channel). RSI Currently in the middle zone (not overbought), indicating room for a rebound if the bullish structure holds. Bullish Forecast Optimistic Scenario: If the price respects the channel support ($3,200) and rebounds, it could retest the upper channel line at $4,200-$4,500 around Q1 2026. Conservative Scenario: Consolidation between $3,000 and $3,800 over the next few weeks before resuming the upward trend. Invalidation Scenario: If it breaks the white line and the red channel, it could fall to $2,500 or even $1,500 (Fibonacci retracement).
Disclaimer
Any content and materials included in Sahmeto's website and official communication channels are a compilation of personal opinions and analyses and are not binding. They do not constitute any recommendation for buying, selling, entering or exiting the stock market and cryptocurrency market. Also, all news and analyses included in the website and channels are merely republished information from official and unofficial domestic and foreign sources, and it is obvious that users of the said content are responsible for following up and ensuring the authenticity and accuracy of the materials. Therefore, while disclaiming responsibility, it is declared that the responsibility for any decision-making, action, and potential profit and loss in the capital market and cryptocurrency market lies with the trader.