Technical analysis by invertirenpatrimonio about Symbol ETH: Buy recommendation (11/20/2025)

سقوط وحشتناک اتریوم (ETH): آیا کف قیمت کجاست؟ تحلیل کامل روند و سطوح خطر
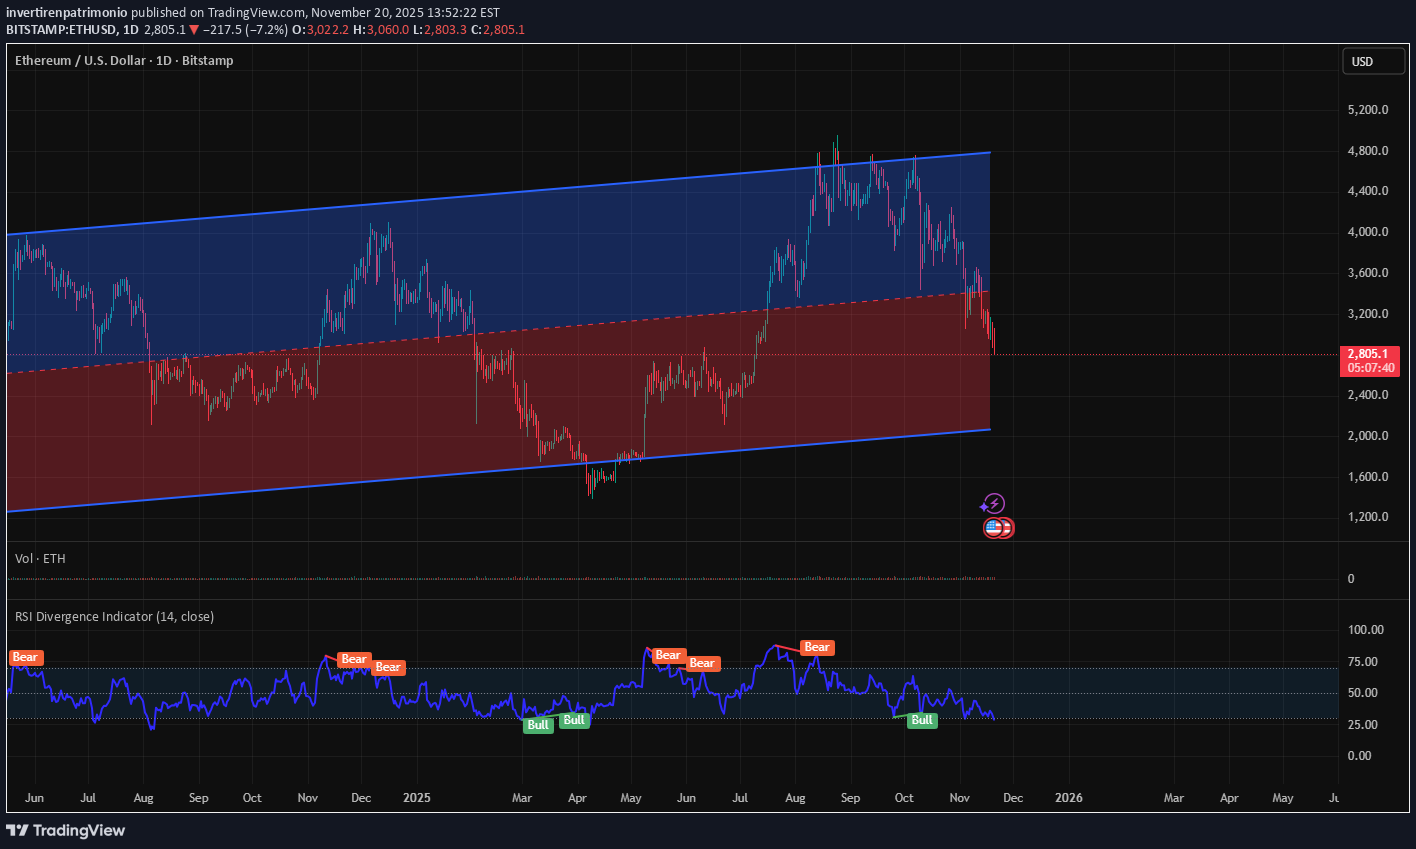
1. Current Price & Drop Price: $2,818.1 Daily Change: -$204.5 (-6.77%) This is a sharp decline, signaling strong bearish momentum. 2. Trend Analysis The chart shows a long-term ascending channel (blue) and a mid-term descending channel (red). Ethereum has broken below the midline of the blue channel and is now trading near the lower boundary of the red zone. This suggests a major trend reversal from bullish to bearish. 3. RSI Indicator RSI is currently below 30, which indicates oversold conditions. Historically, oversold levels often lead to short-term bounces, but given the strong downtrend, this could be a bear trap unless confirmed by volume and price action. 4. Volume & Market Sentiment Volume: 27.22K (high compared to average) → indicates strong selling pressure. News snippet mentions Ethereum ETF speculation, but despite that, inflows are not supporting price, which means macro sentiment is negative. 5. Key Support & Resistance Immediate Support: Around $2,800 (current level). If broken, next major support is near $2,500. Resistance: $3,000–$3,200 zone (previous breakdown area). 6. Risk Factors Broader crypto market is also down (BTC -5.17%, ETH -6.77%), suggesting systemic weakness. Possible reasons: Regulatory uncertainty ETF hype fading Liquidity outflows Short-Term Outlook Expect high volatility. If $2,800 fails, ETH could test $2,500 quickly. Oversold RSI might trigger a dead-cat bounce, but trend remains bearish until ETH reclaims $3,000. Long-Term Outlook If the price stays below the blue channel, the bullish structure is broken, and we could see a prolonged correction.