
FOREXcom
@t_FOREXcom

What symbols does the trader recommend buying?
Purchase History
پیام های تریدر
Filter
FOREXcom
Gold Breaks Above Its All-Time Highs

During the latest trading session, a renewed and sustained bullish bias has remained in place across recent gold price movements, leading to gains of more than 2%. This advance has allowed gold to break above its previous all-time highs and move above the $4,400 per ounce area. For now, the prevailing buying pressure is largely driven by a decline in U.S. Treasury yields, which act as natural substitutes for gold as a safe-haven asset. This shift has supported a steady demand for the precious metal toward the close of 2025, as bonds become less attractive in the short term. As long as this dynamic remains in place, continued buying pressure may remain a key feature in XAU/USD price action over the coming trading sessions. Bullish Trend Stronger Than Ever Since the final days of August 2025, consistent gold price movements have allowed a bullish trendline to remain firmly in place as the dominant technical structure to watch. So far, no meaningful selling corrections have emerged within the trend that would suggest a loss of long-term buying strength, keeping this formation as the most relevant technical reference for gold in the sessions ahead. However, it is important to consider that as price continues to post new all-time highs, periods of indecision may begin to emerge, potentially opening the door to short-term corrective pullbacks. RSI While the RSI continues to post consistent readings above the neutral 50 level, confirming that buying momentum remains dominant, the indicator has also moved above the 70 level, which marks the overbought zone. This behavior may be signaling a potential excess in buying pressure, increasing the likelihood that selling corrections could begin to develop in the coming sessions. MACD Meanwhile, the MACD histogram is oscillating close to the neutral zero line, suggesting that short-term moving average momentum is beginning to reflect a state of indecision. This environment could translate into a period of consolidation in gold prices and may also open the door to short-term bearish corrections. Key Levels to Watch: $4,500 per ounce: This level represents the nearest psychological resistance and, in the absence of prior technical references, stands out as the most relevant barrier to monitor. Bullish moves that manage to consolidate above this zone could pave the way for a more aggressive upward trend toward the close of 2025. $4,365 per ounce: This level previously marked the all-time high zone and now acts as the nearest support. It may serve as a key reference in the event of short-term selling corrections in gold prices. $4,163 per ounce: This is the most relevant support level to watch and aligns with the 50-period simple moving average. Selling pressure that extends toward this area could trigger a more pronounced bearish bias, potentially putting the current bullish trendline at risk. Written by Julian Pineda, CFA, CMT – Market Analyst
FOREXcom
Tesla Stock Holds Strength and Breaks Above Yearly Highs
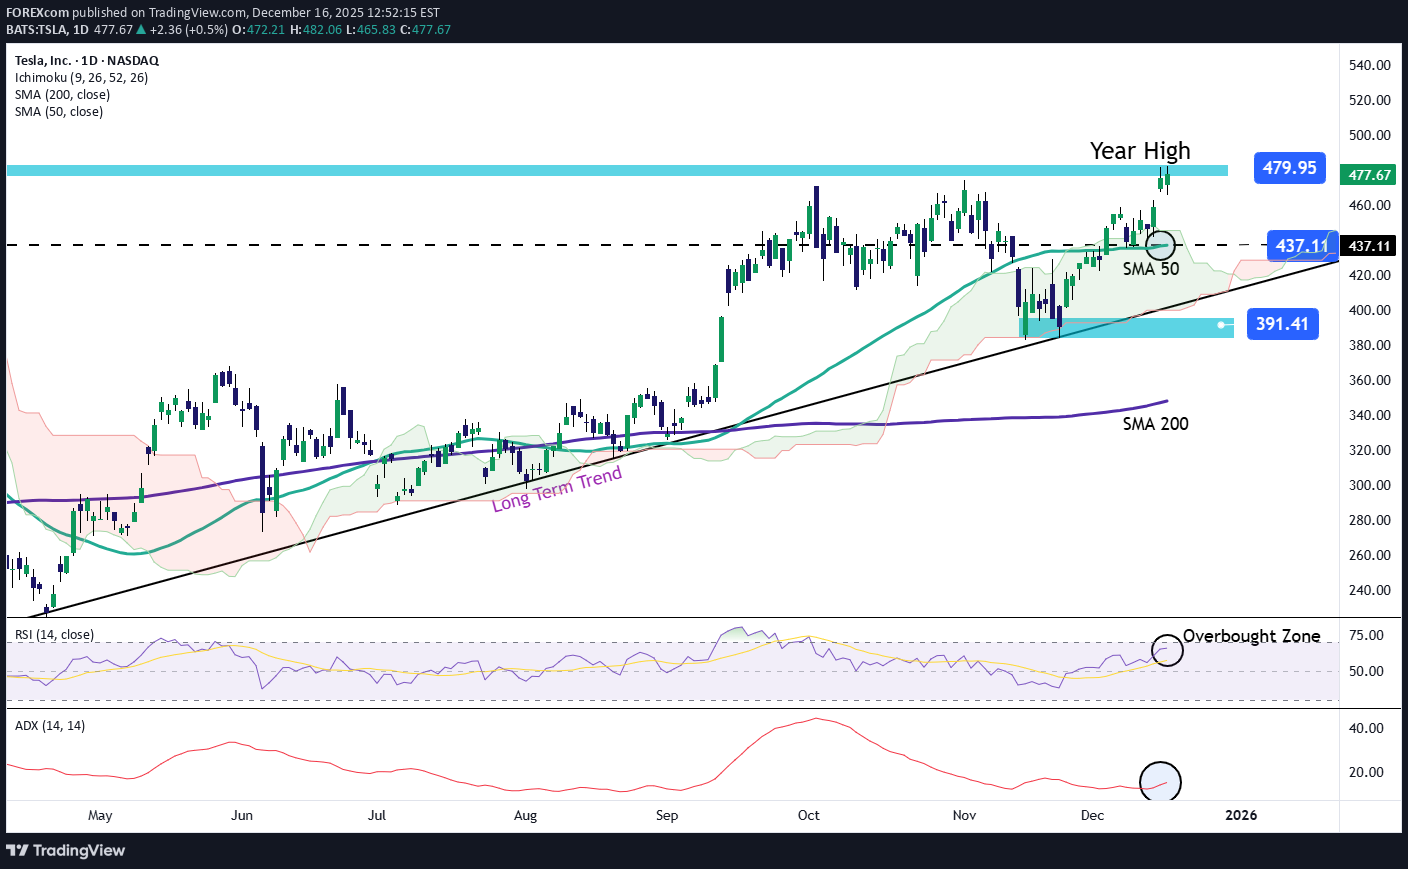
Tesla’s stock has achieved a streak of three consecutive bullish sessions, recording a gain of more than 5% over that period. For now, buying pressure has remained firm following recent announcements indicating that the company has confirmed unsupervised robotaxi testing, a development that could mark a significant milestone in Tesla’s autonomous vehicle program and become a project with major long-term impact. This announcement has reinforced confidence in the stock in recent sessions and may continue supporting consistent buying pressure in the coming days. Long-Term Uptrend Remains Intact It is important to remember that Tesla’s bullish movements have maintained a consistent upward trend since April of this year. In recent sessions, buying pressure has strengthened again, even pushing the price toward the 480-dollar zone — a level not seen consistently since December 2024. If buying pressure remains stable in the short term, the long-term uptrend could continue dominating Tesla’s price action toward year-end. However, it is also important to consider that confronting current highs may create room for short-term bearish corrections. RSI At the moment, the RSI line continues to oscillate above the neutral 50 level, indicating that buying momentum still dominates short-term price action. However, the RSI is now approaching the overbought zone (70), which may signal a potential imbalance in momentum and open the door for short-term pullbacks. ADX The ADX line remains below the 20 level, suggesting a period of neutrality in average volatility over the last 14 sessions. This indicates that unless a stronger directional move occurs in the short term, a phase of persistent indecision may continue, potentially leading to temporary bearish corrections. Key Levels to Watch: 480 dollars – Crucial resistance: A level not seen since 2024 and a major high for 2025. Sustained buying above this level could reinforce the bullish bias and potentially push the price toward the psychological 500-dollar mark. 437 dollars – Nearby support: This level aligns with the 50-period moving average and may act as initial support should short-term bearish corrections occur. 391 dollars – Final support: This level corresponds to recent lows. A pullback toward this zone could reactivate a bearish bias and put the current bullish structure at risk. Written by Julian Pineda, CFA, CMT – Market Analyst
FOREXcom
Gold Breakout Bull Pennant #3
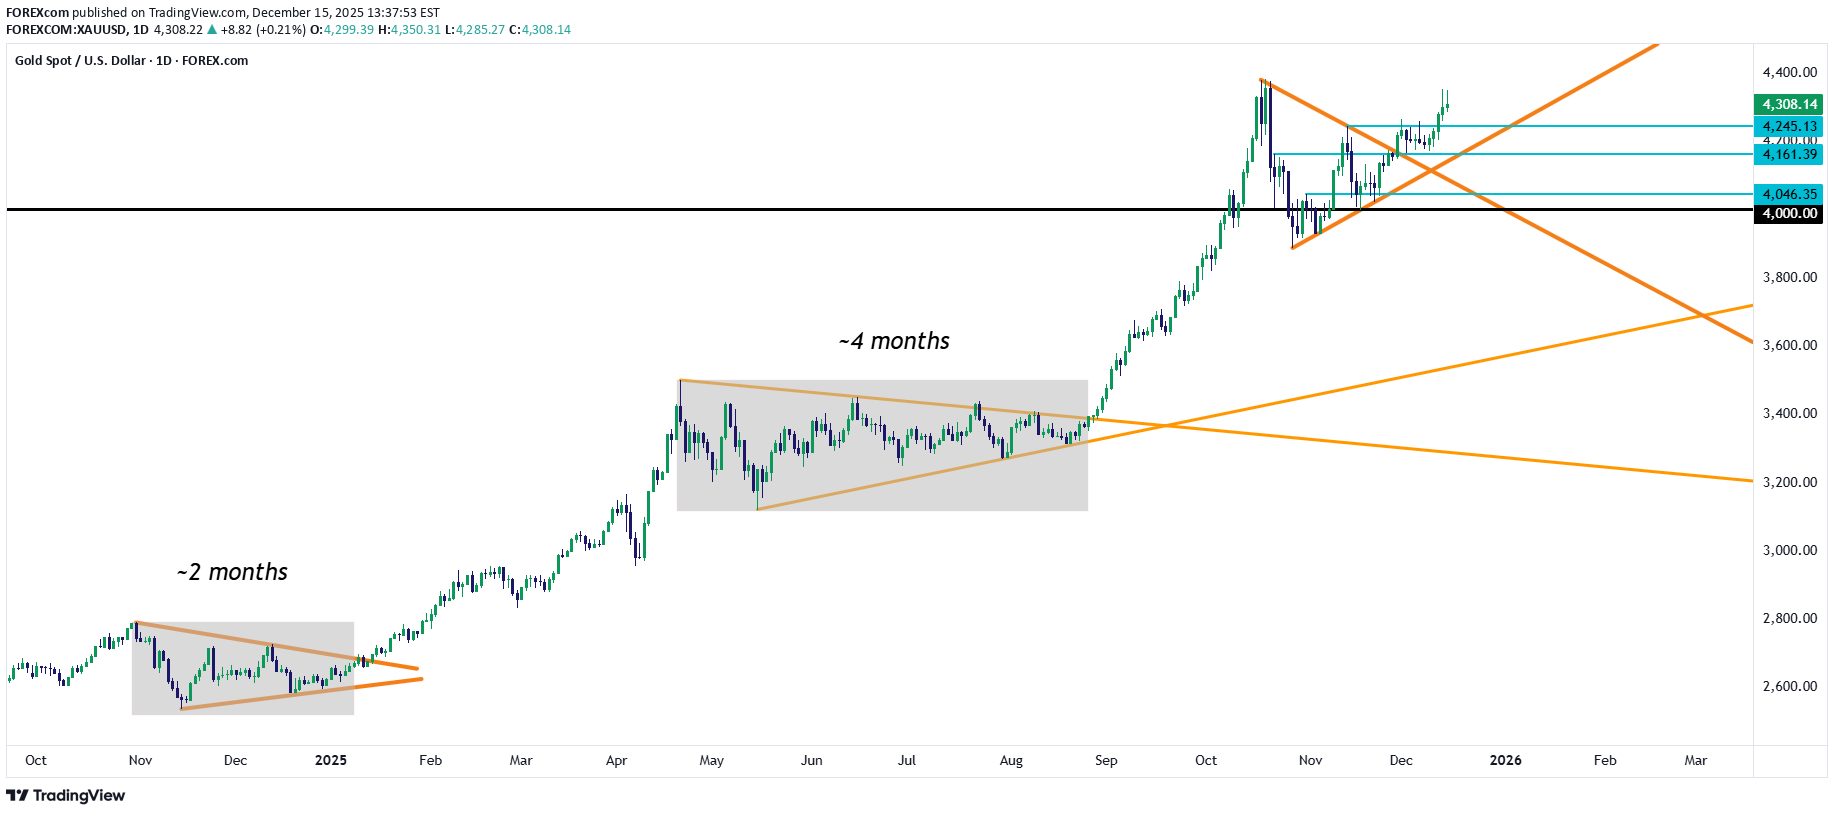
It's been another strong year for gold and with President Trump set to name a dovish successor to the Fed Chair post, the door can very much be open to more topside provided one very major factor doesn't become a problem, and that's inflation. Gold broke out from bull pennant #3 around the news that Trump would name Kevin Hassett as the next Fed Chair. Bond markets didn't seem to rejoice in that news as Treasury yields pushed up after that circulated, which is probably one reason Trump has softened from the stance where he previously said he already knew who he would name, down to the current stance of one of the two Kevins (Kevin Warsh, being the other). Hassett has history as an uber-dove and this is even under Democrat administrations. In an article for AEI published in 1999, he seemingly called out Alan Greenspan for the threat of raising interest rates to pop the internet bubble. That article was released on September 3rd of 1999, so about six months before stocks had topped; but the Fed also hiked a handful of times between the two occurrences with a 50 bp hike in May of 2000, after equities had already set their high (we didn't know that at the time, however). As we go into 2026, it seems that whoever Trump names next Fed Chair rate cuts will be involved, as he's already said a willingness to cut rates is a 'litmus test' for who he ultimately nominates to lead the bank. He's also said that he would like to see rates go below 1%, which would push the dovish drive from the FOMC into another gear, and unless inflation becomes a problem, this could further drive the rally in equities and metals that have taken hold over the past couple of years. For gold, the next week of data could set up opportunity as the metal has already broken out from the third bull pennant formation that I had highlighted in these posts in late-November. There's now support potential at 4245, 4161 and 4046, each of which can make the case for a higher-low above the pullback below 4k. - js
FOREXcom
خطر سقوط بیت کوین جدی شد؛ منتظر ریزش تا چه سطحی باشیم؟
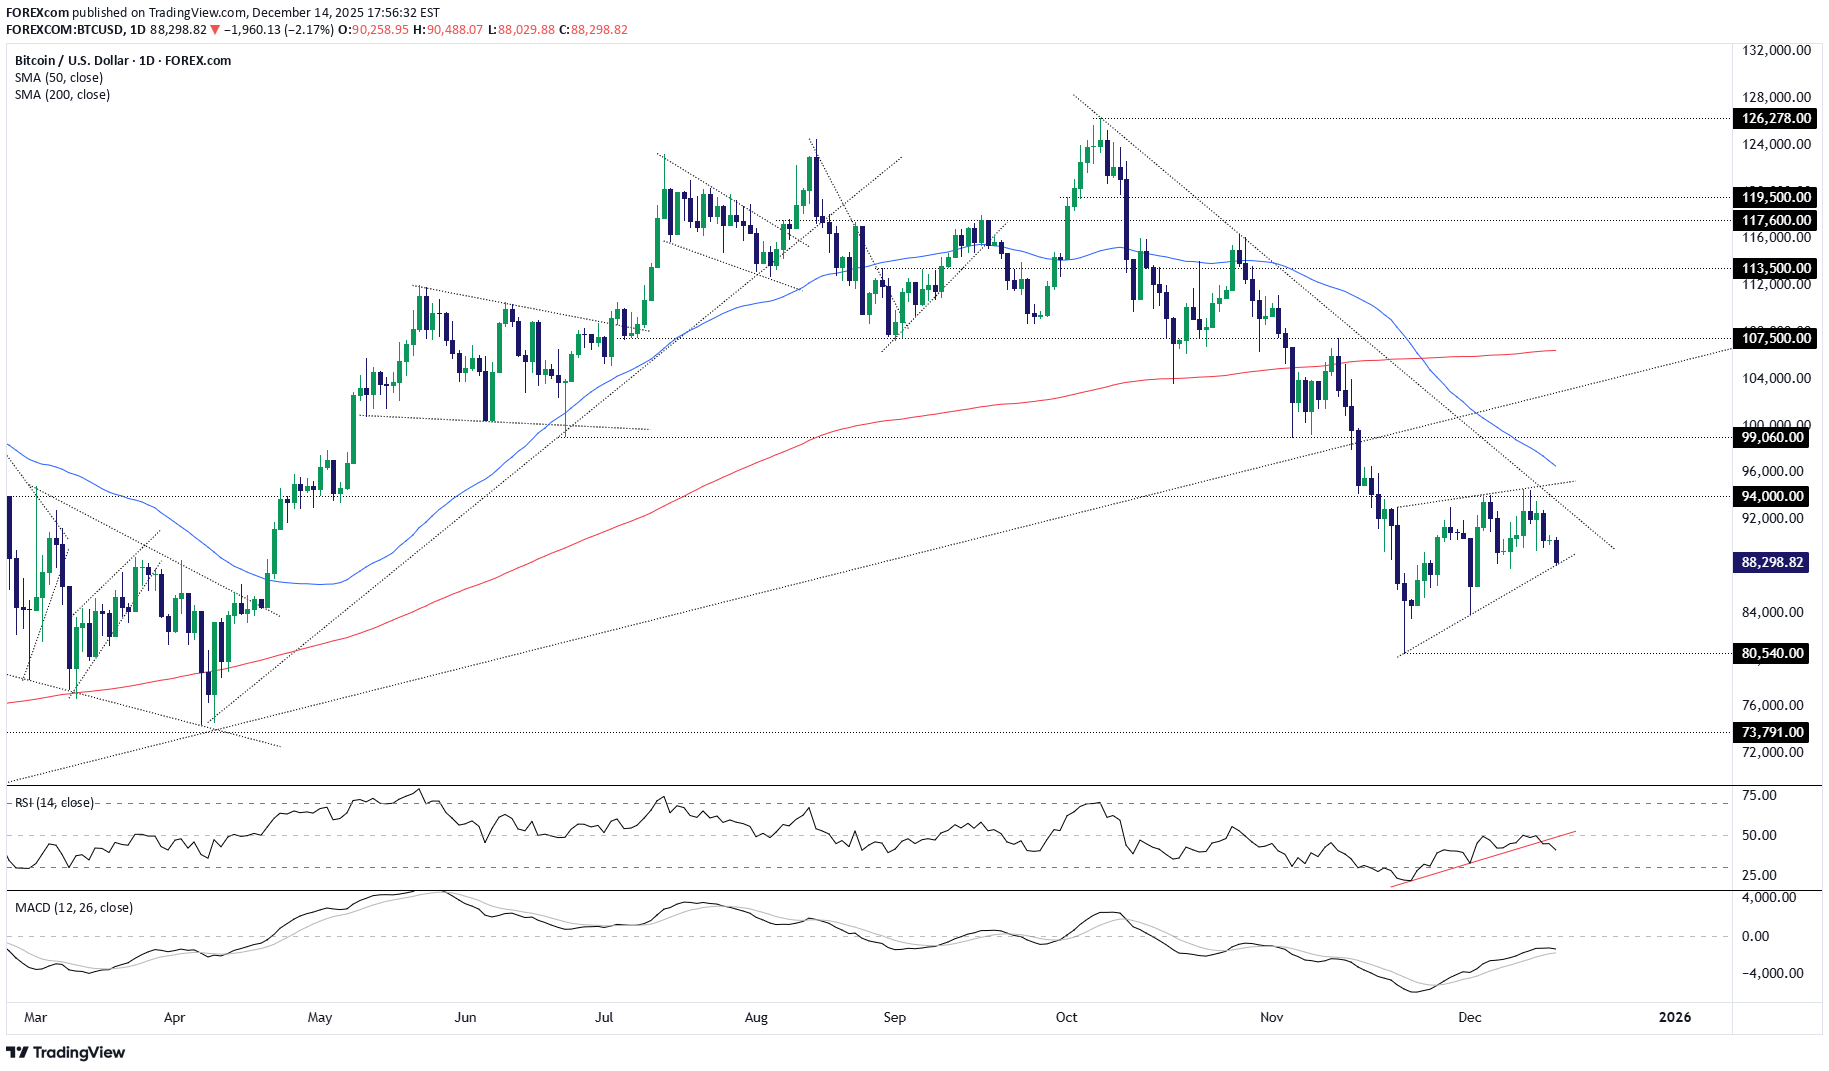
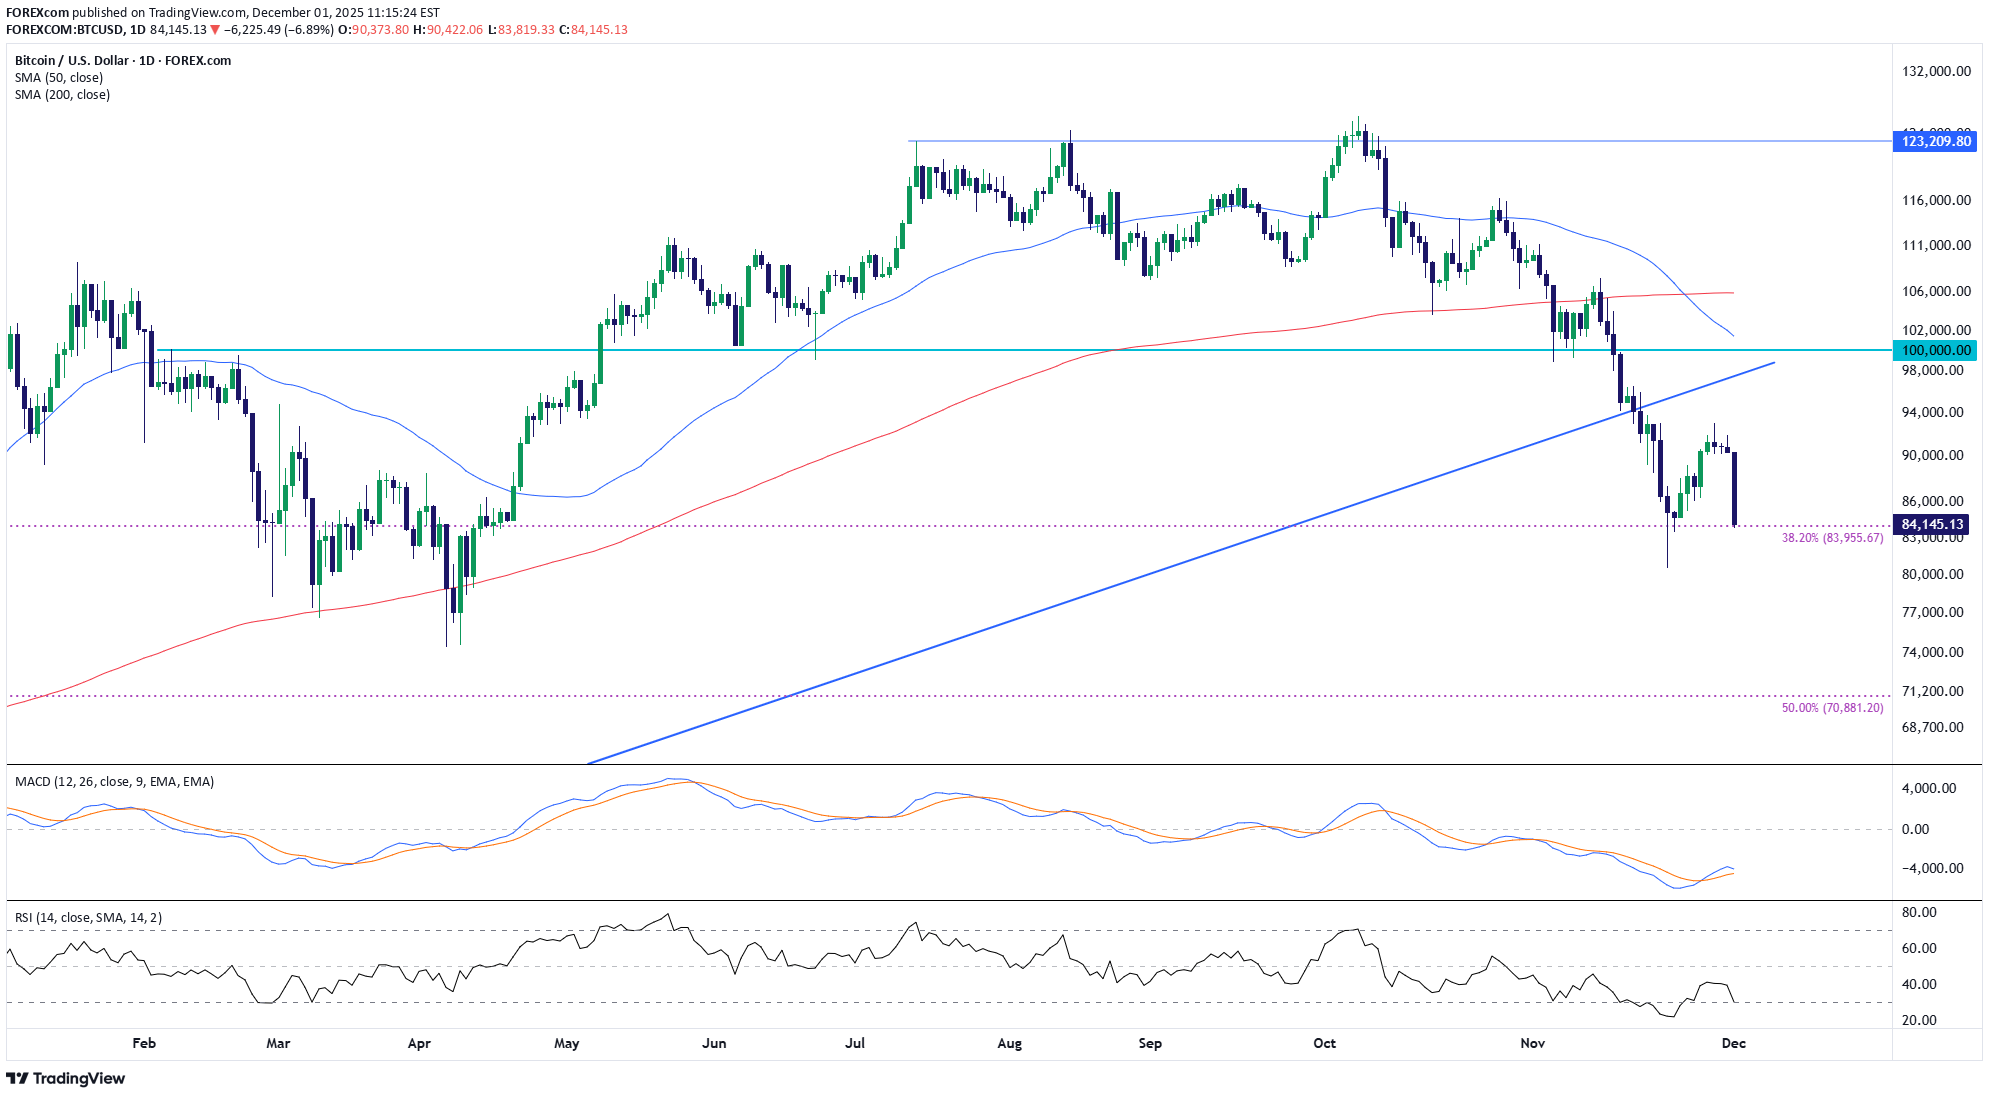
Sitting in a rising wedge following an extended downtrend, traders should be on alert for a resumption of the broader bearish trend in bitcoin, putting a retest of the November lows, or even the year-to-date lows, on the cards. The price is now resting against the November uptrend, with a breach of this level opening the door for another potential wave of selling. If we see a break of $87,800—the low set on 7 December, which sits beneath the uptrend—shorts could be considered with a stop above to protect against reversal. The 1 December low just beneath $84,000 screens as an initial target, with a break beneath that level putting the 21 November nadir of $80,540 on the menu for bears. Should that target be achieved, traders could assess whether to cut, hold, or reverse the position depending on price action at the time. With RSI (14) breaking its uptrend and moving further away from the neutral 50 level, it indicates downside pressure is building yet again, favouring bearish setups. While not yet confirmed by MACD, it too is curling over towards the signal line, moving closer to a crossover that would strengthen the bearish signal. Good luck! DS
FOREXcom
اتریوم در دوراهی: آیا ترس موقتی است یا سقوط در راه است؟ (تحلیل مهم ترید)
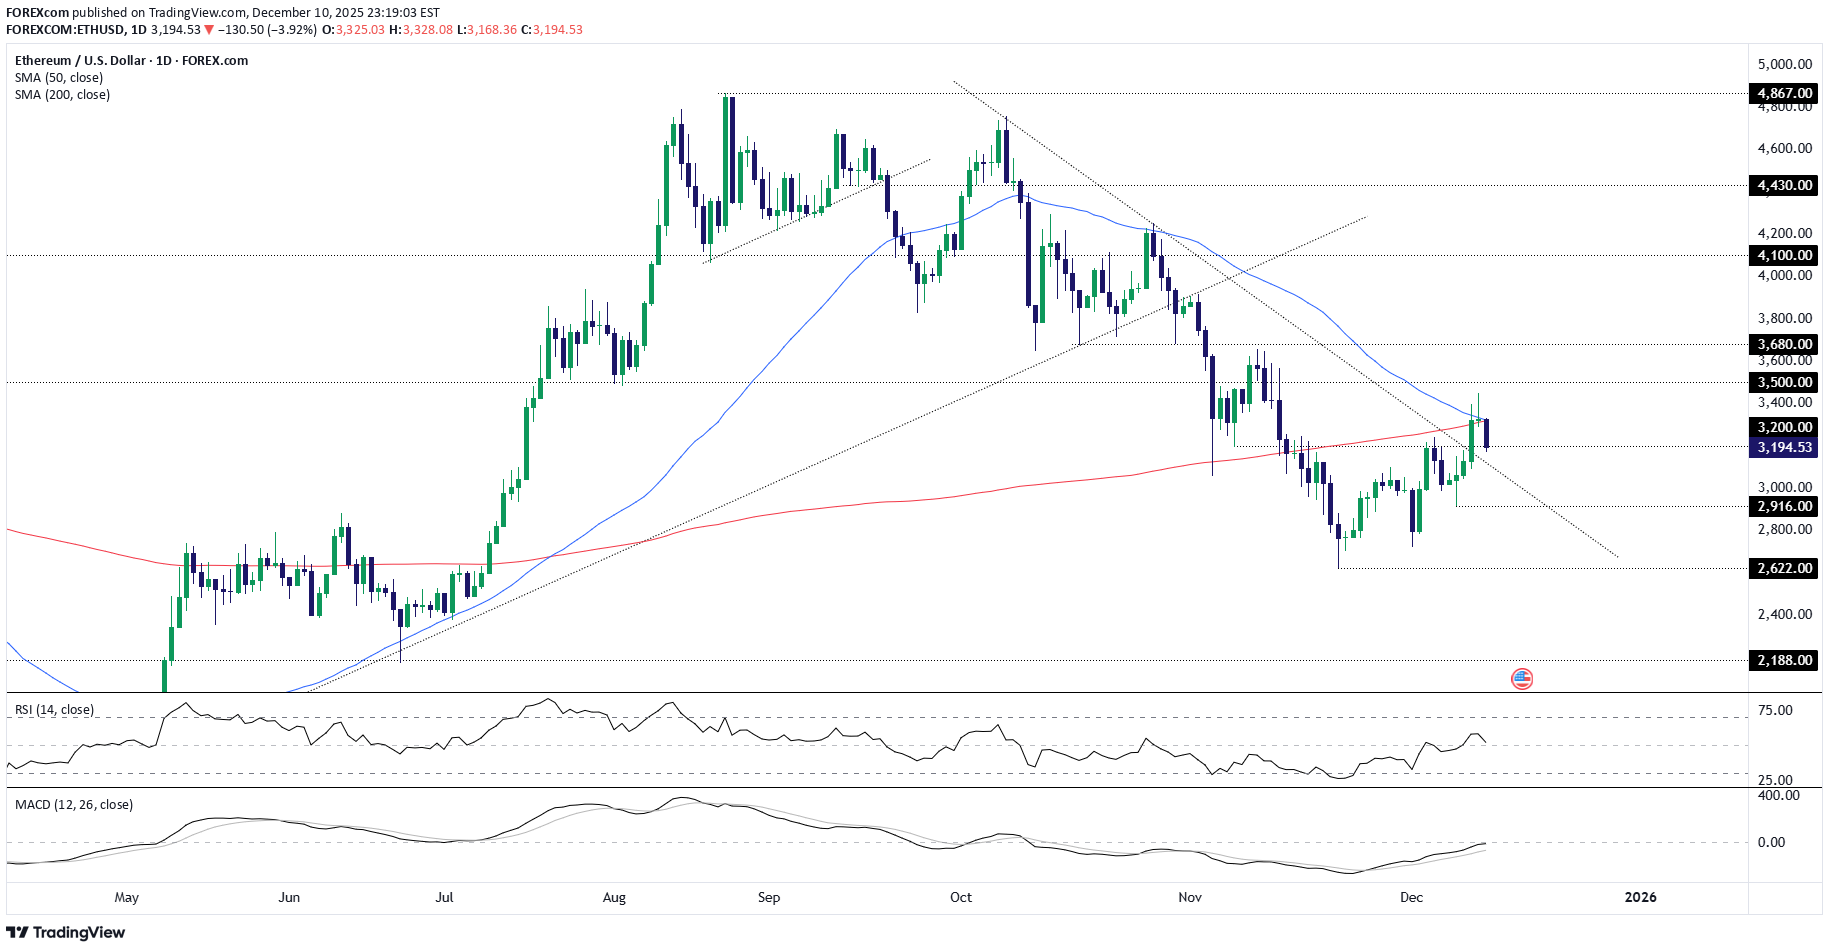
ETH/USD has put in a topping pattern on the daily tick, printing a shooting star candle after a failed bullish probe above the interaction of the 50 and 200DMAs. As things stand, Thursday’s candle would complete an evening star bearish reversal pattern should it close around these levels or lower, doubling down on the bearish signal. However, I don’t trust the broader risk-off move in Asia, apparently sparked by renewed concerns about AI capex following an update from Oracle. I suspect it’s just as much about yen strength weighing on the Nikkei after the Fed’s not-so-hawkish cut delivered on Wednesday. With a near-perfect correlation between Nikkei futures and risk assets such as Ethereum on a one-minute tick over the past hour, it feels like the move may be faded once Europe gets up and running. I’m watching $3,200 closely into the changeover as it screens as an ideal level to build trades around, given it provided both support and resistance over the past month. If the price holds beneath $3,200 into Europe, consider initiating shorts with a stop above for protection, targeting either $3,000 or $2,916 initially. But if the price reverses back above $3,200 and holds there, the option is there to set longs with a stop beneath for protection, targeting the confluence of the 50 and 200DMAs or Wednesday’s high above $3,450. The momentum picture is neutral, putting more emphasis on price action when assessing both setups. Good luck! DS
FOREXcom
Bitcoin Holds 90,000 Ahead of FOMC
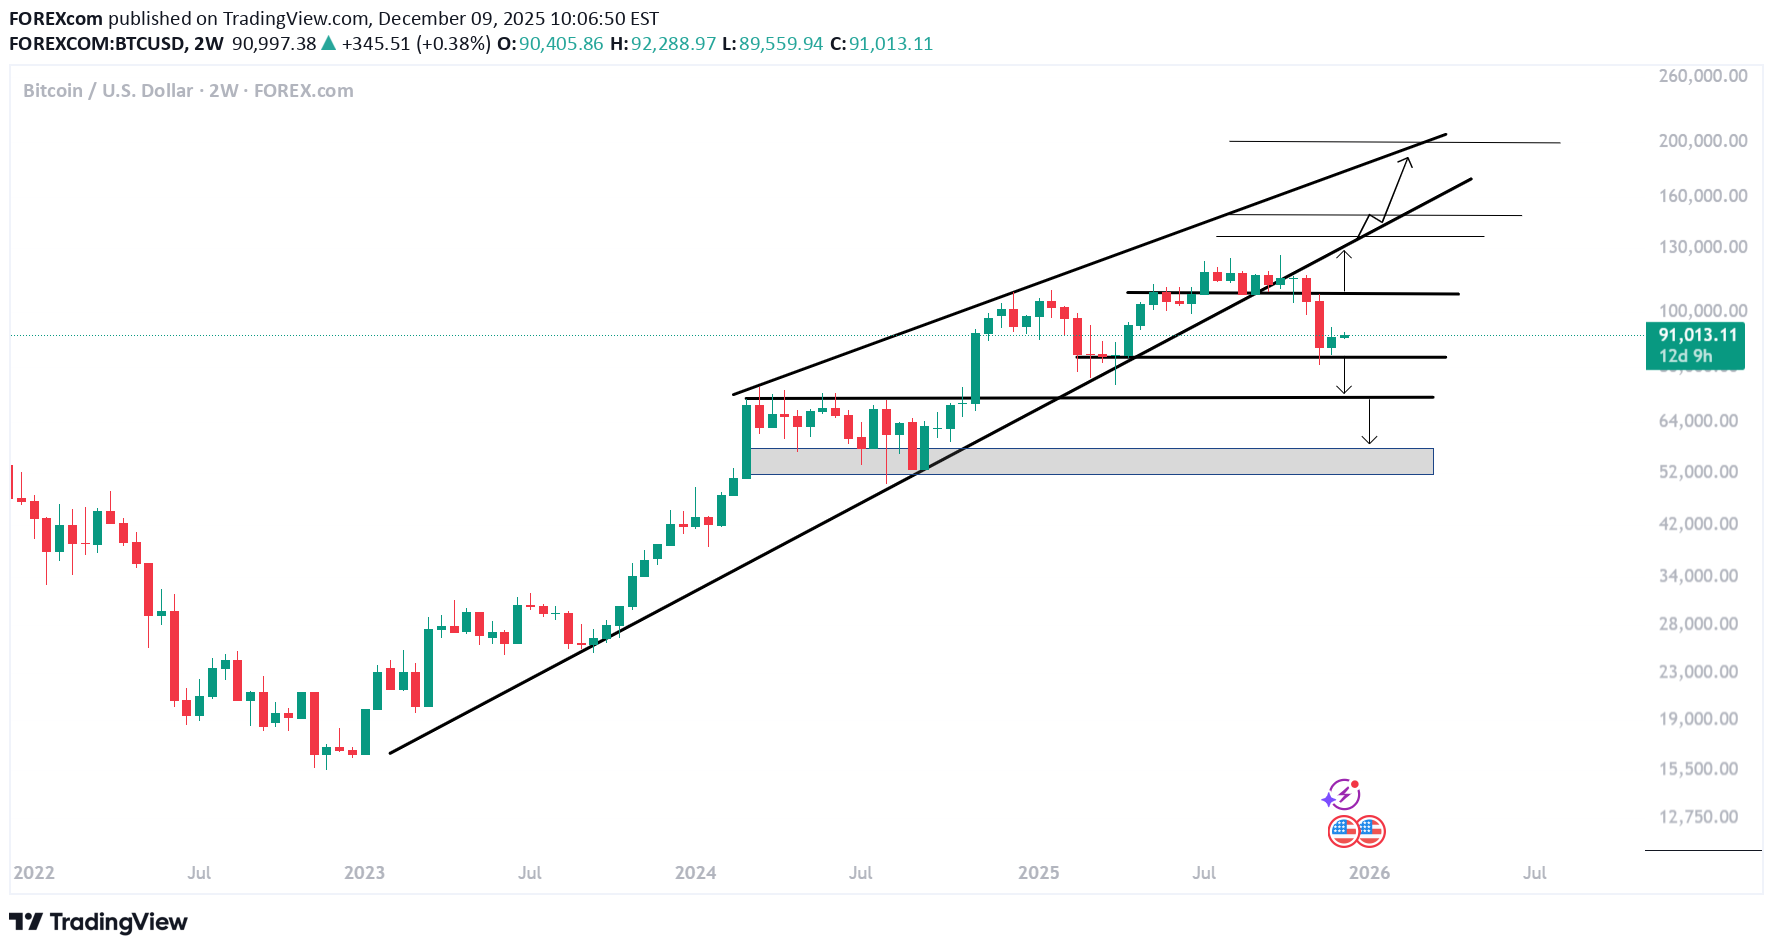
Market fear pushed Bitcoin expectations toward 50,000, yet the 80,000 support and Santa rally narrative are holding the ground ahead of tomorrow's FOMC outcome. Bitcoin is currently trading below the trendline connecting consecutive higher lows since November 2022, indicating a bearish bias unless price regains this barrier and the 110,000 resistance. A close above 110,000 would re-establish bullish momentum, opening the door toward the all-time record at 126,000, followed by new potential records near 137,000, 150,000, and 190,000–200,000, in alignment with the trendline connecting higher highs from March 2024 to December 2024. On the downside, a drop below 80,000 is expected to extend losses toward 70,000, and in more extreme cases, a drop below 70,000 could expose the 50,000-region. (Previous support zone between March and September 2024) - Razan Hilal, CMT
FOREXcom
سقوط بیت کوین: سطوح حیاتی حمایت و مقاومت که باید زیر نظر بگیرید!
Just when everything look calm again, cryptos have taken a beating again today and consequently US indices have come off earlier highs. Bitcoin hit resistance around $94K, which was a prior support level, and today it has broken below interim support around $91K, trigger stops from dip buyers. As before, key support comes in at $85.3K, but if that fails to hold this time, then $80K could be the next targets. on the upside, $91K is the most important level for the next days or two, and if that level is reclaimed then $94K is the next reference point to watch. By Fawad Razaqzada, market analyst with FOREX.com
FOREXcom
بیت کوین در مسیر سقوط؛ آیا حمایت فیبوناچی جلوی ریزش بیشتر را میگیرد؟
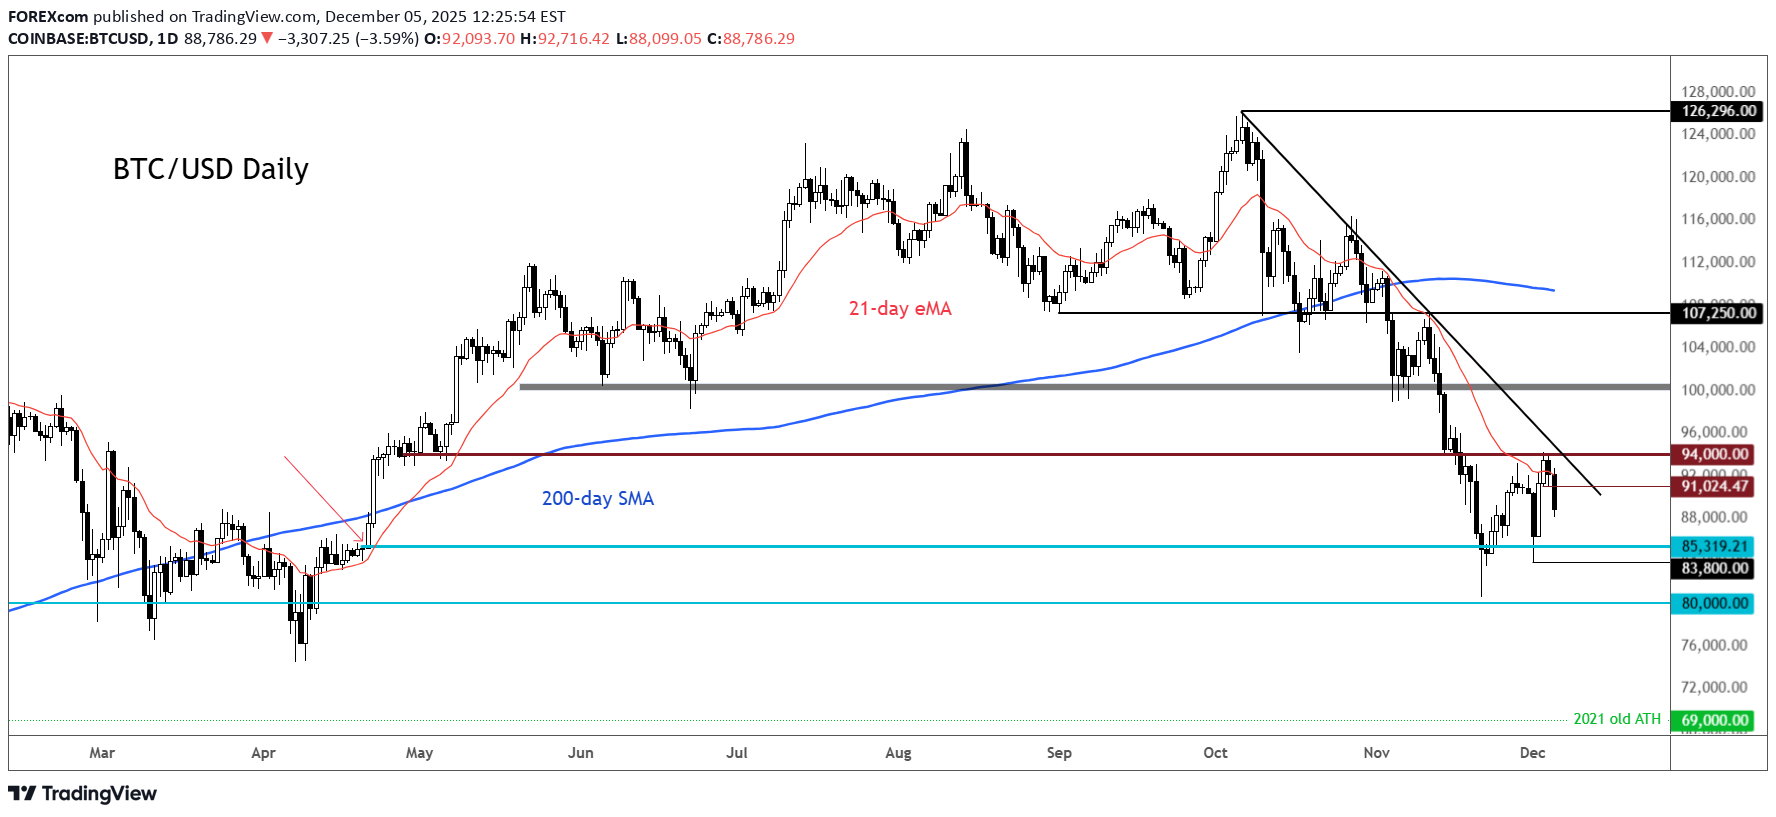
Bitcoin continues to trade under clear downside pressure after breaking beneath its long-standing ascending trendline in November. The recent rebound attempt stalled near the underside of that same trendline—now acting as dynamic resistance—and price has since rotated lower again. The broader structure shifted bearish once price fell below the 50-day SMA and 200-day SMA, both of which are now flattening or turning lower. This places the market in a momentum-cooling environment where sellers remain in control unless a sustained recovery develops above key moving averages. The chart also highlights confluence around the 38.2% Fibonacci retracement level drawn from the major swing low, which sits near the latest reaction zone. The initial bounce from this area shows that participants are aware of the level, though the follow-through remains limited for now. Momentum indicators reflect persistent weakness. The MACD remains in negative territory, with both signal lines tracking below zero and only modest signs of stabilization. RSI recently dipped into the 30-zone before attempting to lift, indicating oversold conditions were tested but broader momentum has not convincingly recovered. Overall, the chart continues to lean bearish as long as the market holds below the broken trendline and the major moving averages. Price behavior around the Fibonacci region will be an important gauge of whether this decline matures into a deeper corrective phase or begins to base out. -MW
FOREXcom
سطوح کلیدی بیت کوین (BTC/USD) که باید زیر نظر بگیرید: آیا کف قیمتی تشکیل شد؟
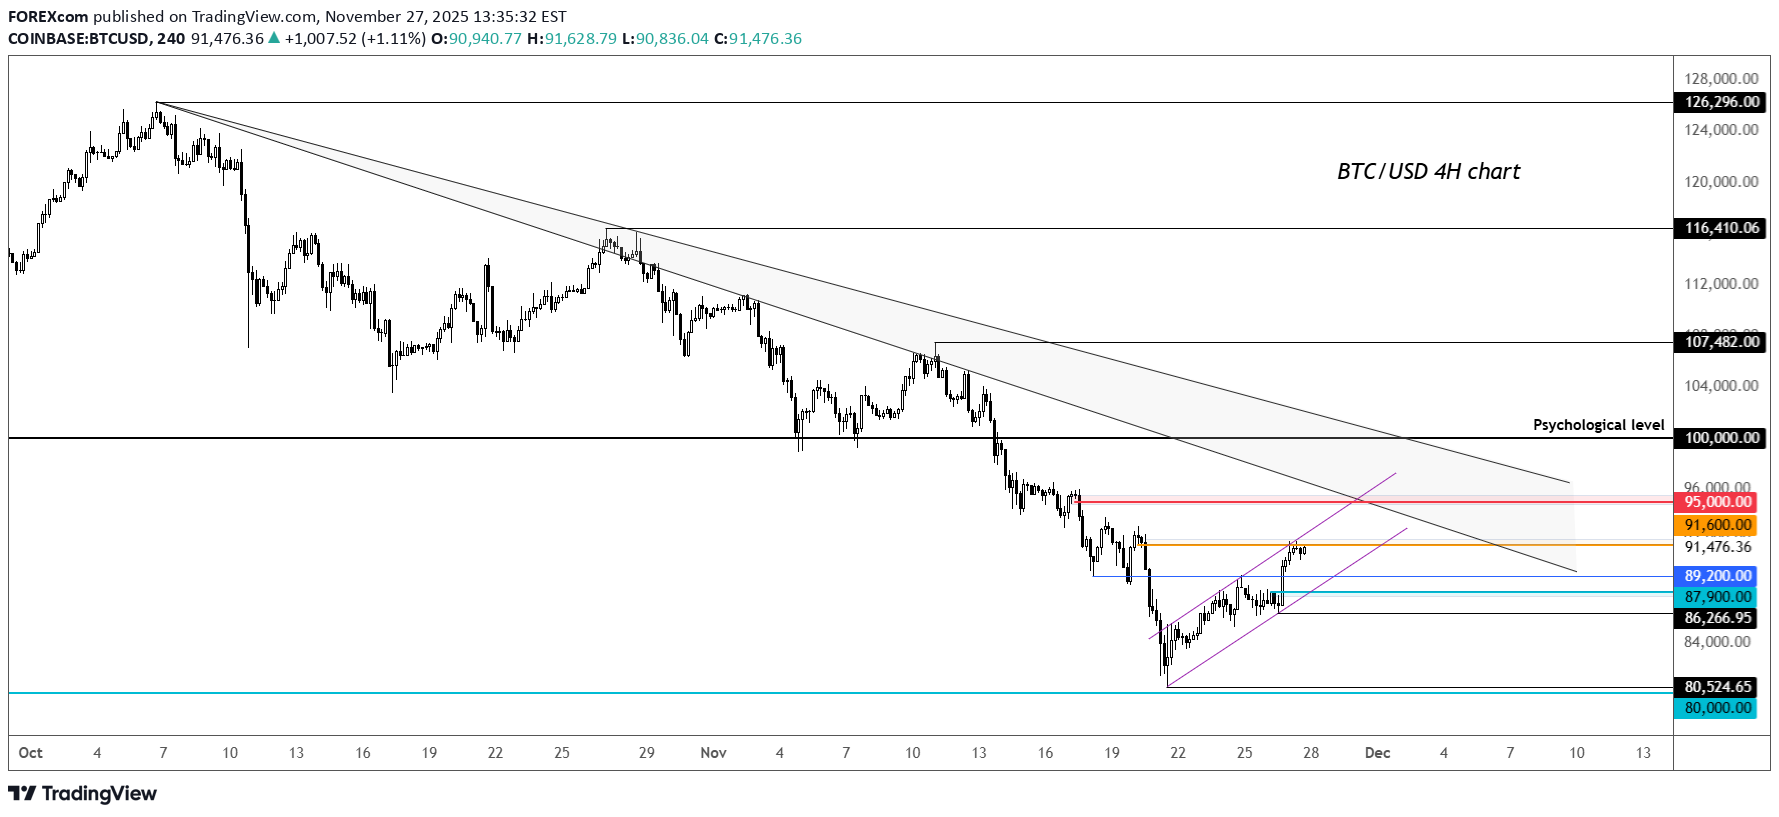
Bitcoin continues to recover from its big falls and it has broken a few important short-term levels, although too early to say whether it had bottomed out. After all, the bearish trend line is still intact. $91.6K marks last support pre breakdown and top of rising channel - we have seen a bit of reaction from this level already. $95.0K another important level on the upside Support at 89.2K and then 87.9K if we go below recent low of 86266, bias would turn bearish again. By Fawad Razaqzada, market analyst with FOREX.com
FOREXcom
چکش بیت کوین و راز نوسان انویدیا: آیا کف قیمتی رسیدیم؟
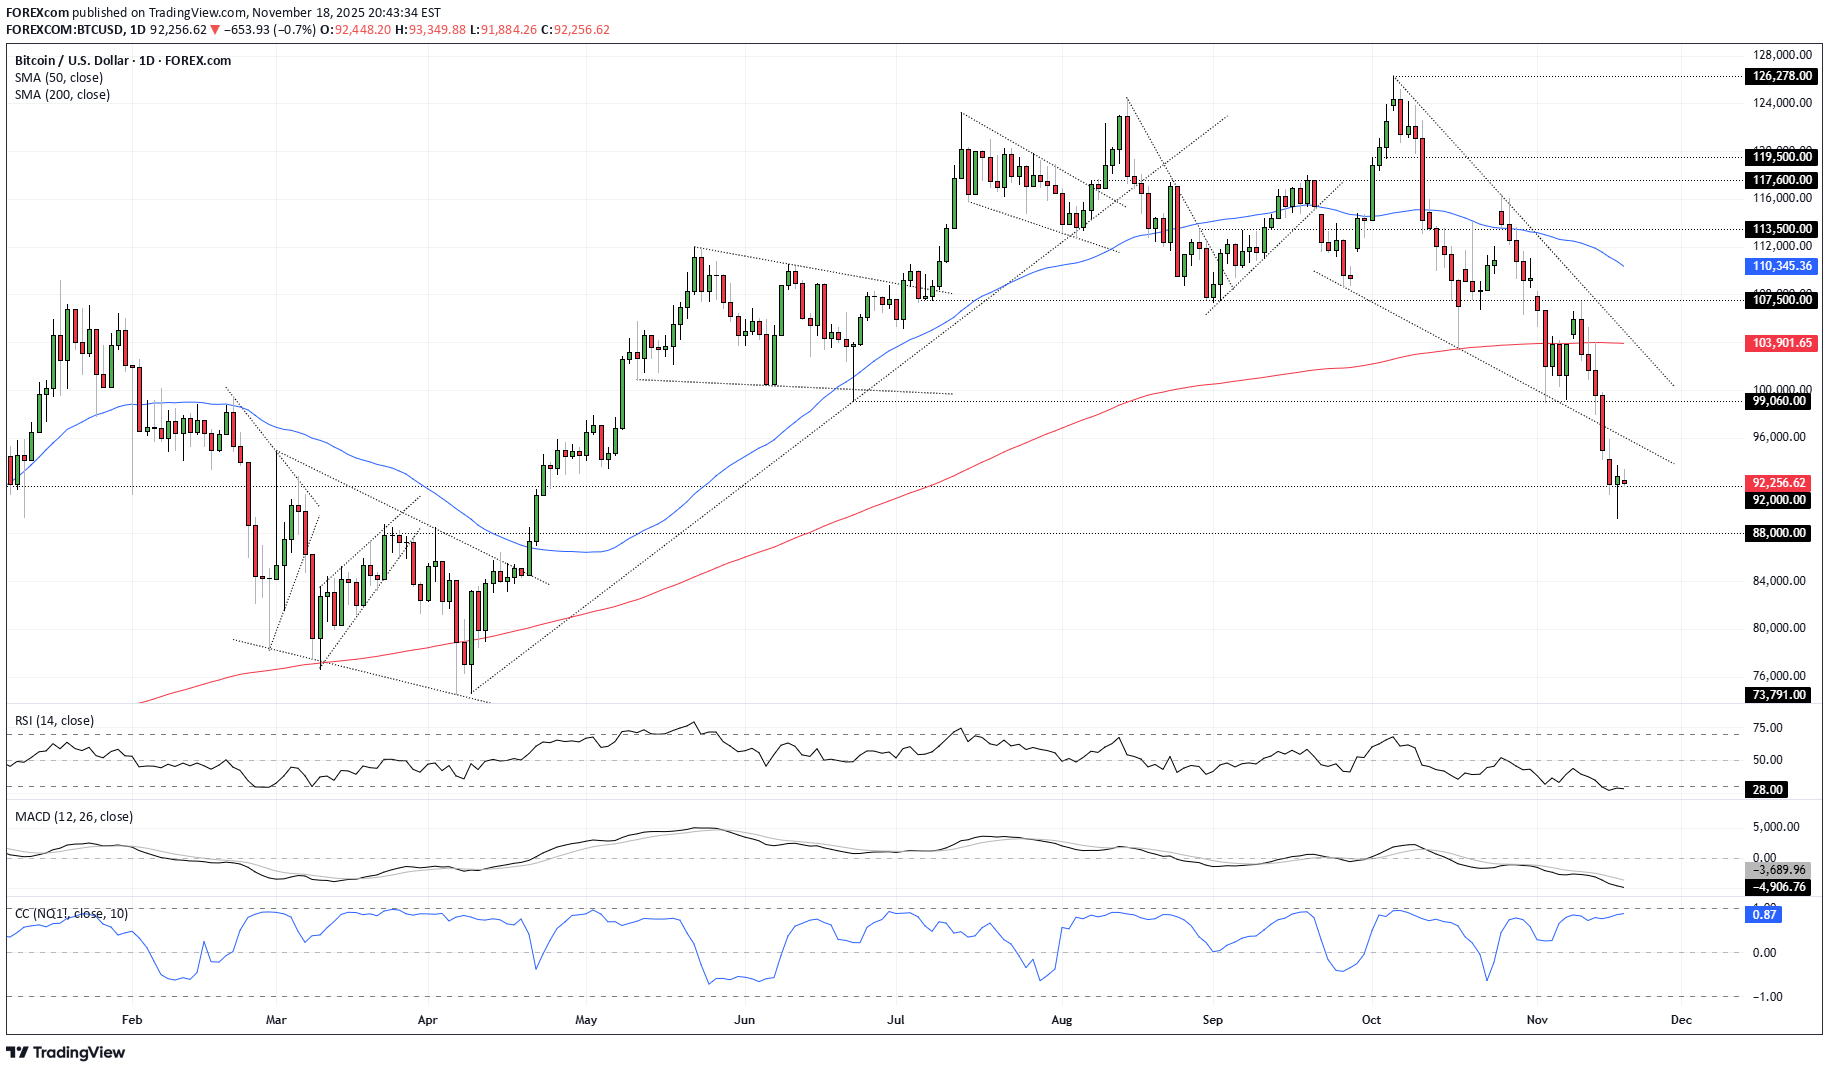
Granted, it could easily be seen as catching a falling knife or position squaring before a key risk event, but the hammer candle that printed on the BTC/USD daily chart has me interested, particularly as it came from a zone where it’s attracted buying in the past. It makes me wonder whether we’ve seen the lows for now, opening the door for countertrend long setups in the near term. For one, BTC/USD has a decent track record for delivering reliable bullish and bearish reversal signals. The shooting star candle on 6 October kicked the bearish move off, with a bearish engulfing on 11 November coinciding with the resumption of the bear trend following a fleeting bounce. And that’s only the signals we’ve seen recently, with many others proving to be prescient earlier in the year. Secondly, the dip and reversal from beneath $92,000 is noteworthy given price action seen around the level over the past year. There were constant dips and bounces from beneath it in late 2024 and early 2025, before it eventually flipped to offering resistance after a successful bearish break in February. Now testing the level again from above, you can’t dismiss the signal entirely. While momentum indicators remain firmly bearish, favouring selling into strength, with RSI (14) now sitting in oversold territory, there’s grounds for countertrend long trades to be considered for those anticipating a short squeeze. For now, I’m watching the price action around $92,000 as we move towards the key macro event for the week, Nvidia’s earnings report. With a correlation coefficient of 0.87 with Nasdaq 100 futures over the past fortnight, it suggests how traders respond to the earnings update will likely influence how BTC/USD trades. Should the price hold $92,000, longs could be set above the level with a stop beneath for protection, targeting either former downtrend support located around $96,000 today or former support at $99,060. On Nvidia’s earnings report, I don’t think anyone can say with certainty as to what will transpire, other than history suggests the chip giant will likely breeze past top-line revenue forecasts with bullish guidance from CEO Jensen Huang. But that’s essentially consensus, meaning the performance of riskier assets in the aftermath may reflect whether it’s good enough to justify the hype. Sure, the recent pullback has lowered the bar somewhat, but the bar remains incredibly high. If it can impress, bitcoin may well bounce. Good luck! DS
Disclaimer
Any content and materials included in Sahmeto's website and official communication channels are a compilation of personal opinions and analyses and are not binding. They do not constitute any recommendation for buying, selling, entering or exiting the stock market and cryptocurrency market. Also, all news and analyses included in the website and channels are merely republished information from official and unofficial domestic and foreign sources, and it is obvious that users of the said content are responsible for following up and ensuring the authenticity and accuracy of the materials. Therefore, while disclaiming responsibility, it is declared that the responsibility for any decision-making, action, and potential profit and loss in the capital market and cryptocurrency market lies with the trader.