Technical analysis by FOREXcom about Symbol METAX on 10/30/2025

FOREXcom
سقوط شارپ سهام متا: چرا غول فناوری زیر ۷۰۰ دلار سقوط کرد؟
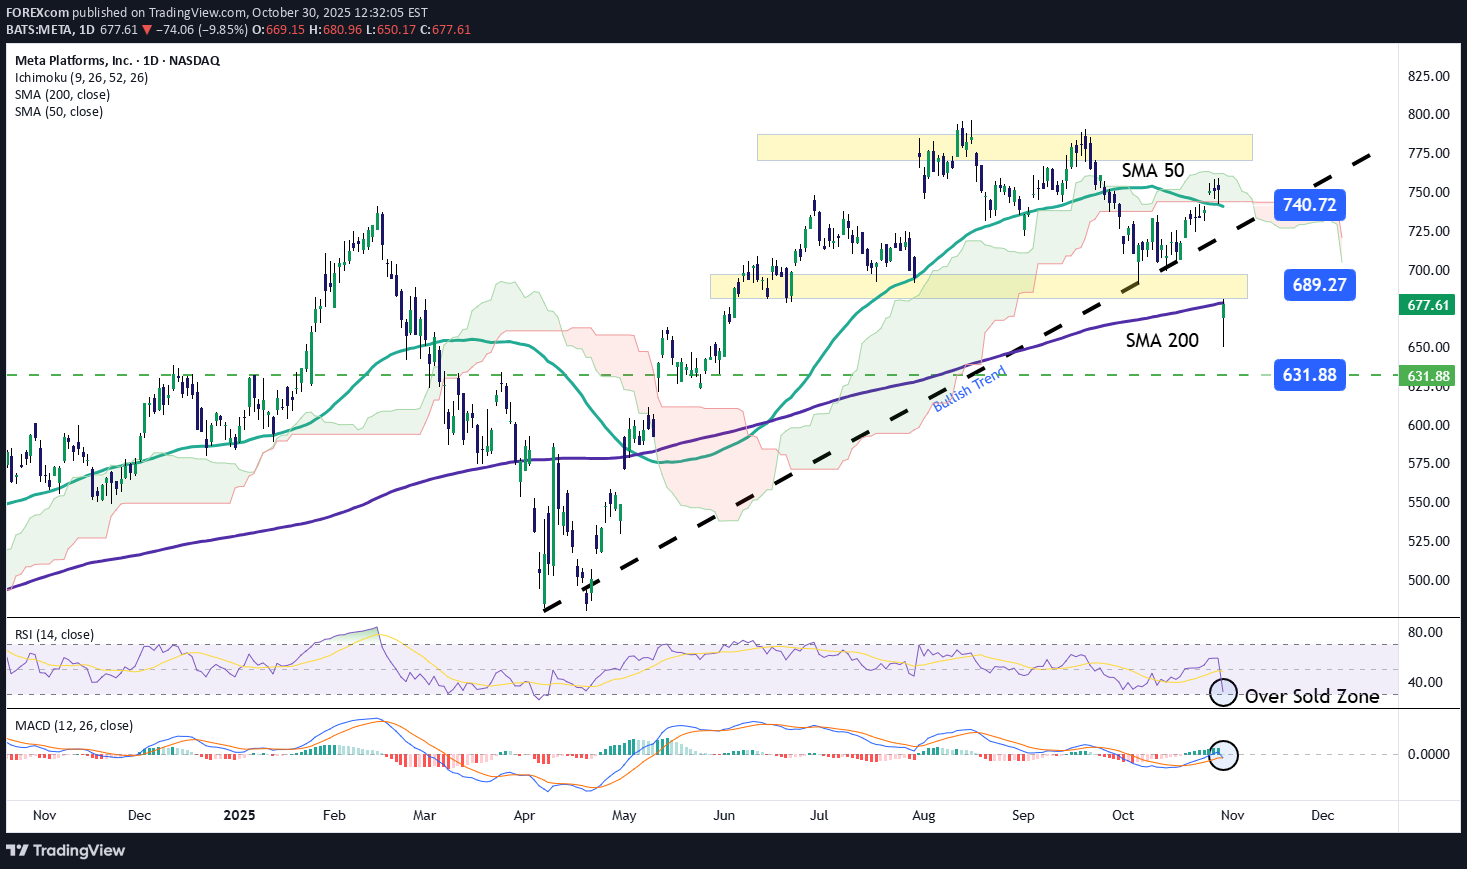
Meta’s stock dropped more than 10.5% during the last trading session, shortly after the company released its third-quarter results. Selling pressure has become dominant despite Meta reporting $51.24 billion in revenue, surpassing expectations of $49.40 billion, and earnings per share of $7.25, beating forecasts of $6.69. However, it was revealed that the company incurred an extraordinary charge of approximately $16 billion, linked to a new U.S. tax regulation, which — if it hadn’t occurred — would have allowed for much higher reported earnings. This factor, combined with the massive spending on its artificial intelligence initiatives, could begin to erode profit margins in the coming months. As a result, a persistent sense of investor distrust has emerged, which could continue to place downward pressure on the stock in the near term. Uptrend Breaks Following the earnings release, the stock broke below the upward trendline that had been in place since April of this year, potentially marking a structural shift on the chart, with a bearish bias now becoming dominant after the sharp decline. As long as the price remains below the 200-period moving average, selling pressure could stabilize and even lead to the formation of a new short-term downtrend. RSI The RSI line has started to show a steady downward slope, indicating that selling momentum has taken control over the past 14 sessions. However, the indicator is quickly approaching the oversold zone near the 30 level, suggesting a potential market imbalance that could open the door for short-term bullish corrections. MACD The MACD histogram has flattened around the zero line, signaling indecision in momentum based on the moving averages. If this condition persists, the stock could enter a sideways consolidation phase in the coming sessions. Key Levels to Watch: $740 – Resistance: This level aligns with the 50-period simple moving average. A move back toward this zone could reactivate the previous uptrend, which has now taken a back seat following the sell-off. $689 – Current Barrier: This retracement zone coincides with the 200-period moving average and could serve as a neutral area, potentially triggering short-term corrections. However, as long as the price remains below this level, a sustained bearish bias may continue in the coming sessions. $631 – Key Support: This level represents an area of indecision not seen since May of this year. A break below it could activate a fresh downtrend, likely to persist over the medium term. Written by Julian Pineda, CFA – Market Analyst