
mrsignalll
@t_mrsignalll

What symbols does the trader recommend buying?
Purchase History
پیام های تریدر
Filter
mrsignalll
واکنش قیمت تون کوین به حمایت کلیدی: فرصت خرید بلندمدت زیر نظر!

#TONUSDT | 1 HOUR TIMEFRAME UPDATE #TON has reached a strong support zone between $1.8500 – $1.8356, where price showed a clear bullish reaction and bounced to the upside and we can look for confirmation to enter a LONG position. 🛒 ⚠️ Invalidation: If price dumped below $1.8280, this bullish scenario will be invalidated. Patience is key — wait for confirmation before entering the trade.
mrsignalll
#BTC Key Zone & Potential Long Opportunity

#BTC Key Zone & Potential Long Opportunity There’s a crucial support zone for #BTC between $91,100 – $91,476. As seen on the chart, the price has bounced off this zone to the upside. Currently, BTC is trading at $91,900. Traders can look for confirmation to enter a long position. However, at the time of publishing, it might be slightly late to enter, so if you prefer lower risk, you can consider buying positions tomorrow. Targets for this upward movement: ↗️ $94,755 $95,836 $97,217 $98,737 Invalidation level: If BTC drops to $90,700, this analysis will be considered invalid. ❌#BTCUSDT | 1 HOUR TIMEFRAME UPDATE The price of #Bitcoin reacted beautifully to our marked zone and has already pumped 2.55% (spot, no leverage). ⚡️ Now the big question is: Will price continue toward our targets, or will it retrace and move back toward the invalidation level? 🤔
mrsignalll
پنج نشانه صعودی قوی در اینج (INJ) پس از شکست رنج؛ آیا زمان ورود فرا رسیده است؟

#INJUSDT | DAILY TIMEFRAME UPDATE One of the altcoins worth keeping an eye on this week is #INJ. The price has broken above its previous trading range with a strong bullish candle. In addition, the previous weekly candle closed as a bullish engulfing, which indicates strong buyer momentum and suggests that the upward move could continue. ↗️ However, it’s better to wait for tomorrow and monitor the price action. If we see a retracement, you can look for confirmation before opening LONG positions on INJ. ✅ For targets, you can either: 👇 Use the previous highs, or Define targets based on your risk-to-reward strategy. Invalidation: This bullish scenario will be invalidated if the price drops below 4.144. ❌
mrsignalll
بیت کوین از محدوده خارج شد: آیا گاوها کنترل بازار را پس گرفتند؟ (اهداف ۱۰۰ هزار دلاری)

#BTCUSDT | DAILY TIMEFRAME UPDATE At the start of this week, let’s take a closer look at #Bitcoin. 👀 #BTC has been trading within a clear range for the past 48 days. During this period, price action remained mostly sideways, forming a consolidation zone that prepared the market for a big move. Looking at the previous daily candles, we can see strong bullish momentum. Bitcoin printed powerful bullish candles, successfully breaking above the minor range high around 90,604, and is now trading near 92,520. This breakout is supported by strong buying pressure rather than weak or choppy price action. Additionally, the last weekly candle closed as a large bullish candle, which further confirms bullish strength and increases the probability that this move is not just a fake breakout. Trading Plan At this stage, the main focus should be on a confirmed breakout above the top of the trading range. If Bitcoin breaks and holds above this range, LONG positions become valid. Bullish Targets In case of a successful breakout, the upside targets are: ↗️ 96,100 98,000 100,000 If bullish momentum continues and volume supports the move, price could push even higher beyond these levels.
mrsignalll
BTC Setup

⚡⚡ #BTC/USDT ⚡⚡ Exchanges: Binance Futures Signal Type: Regular (Short) Leverage: Isolated (50.0X) Entry Targets: 1) 89420 Take-Profit Targets: 1) 89088 2) 88755 3) 88424 4) 88092 5) 87756 Stop Targets: 1) 89750#BTC/USDT Take-Profit target 1 Profit: 18.5641% Period: 36 Minutes#BTC/USDT Take-Profit target 2 Profit: 40% Period: 41 MinutesSet the stop loss at entry.+3R
mrsignalll
#TAO Breakout Setup - Big Move Loading?

#TAOUSDT | 4 HOUR TIMEFRAME UPDATE With the opening of the new yearly candle, we’re likely to see many great opportunities in the market. ✨ One altcoin you should definitely keep on your watchlist is #TAO. It’s a low-cap coin, and I’ve already shared several analyses on it in the channel—make sure to check the previous ones as well. As you can see on the #TAO chart, the price is currently trading within a clear range. After this consolidation phase, we can expect a potential expansion to the upside. But wait—don’t rush in. 🏃♀️ Do not enter without confirmation. The best approach is to wait for a strong breakout above the range with a clear, bullish candle. Only after confirmation should you consider opening a buy position. You can set a price alert for $234. Once the price reaches this level, wait for a large bullish candle with a strong body. After that candle closes, you can enter the trade. For risk management, you can place your stop loss below the trading range for a safer setup, or tighter if it aligns with your strategy. Always adjust based on your own risk management rules.#TAOUSDT | 4 HOUR TIMEFRAME UPDATE #TAO broke out of its trading range to the upside, and from $234 the price rallied over 10% — spot only, no leverage. ⚡️ Hope you guys locked in some nice profits 💸#TAOUSDT | DAILY TIMEFRAME UPDATE The price of #TAO has surged nearly 19% after breaking out of its trading range. ⚡️ If you managed to catch this setup, you can move your stop loss to breakeven, take partial profits, and let the remaining position run as long as the price continues its bullish structure. ✅
mrsignalll
XRP at a Key Support Zone - Bulls Preparing for the Next Move

#XRPUSDT | 4 HOUR TIMEFRAME UPDATE You can keep #XRP on your watchlist for now. The price is currently trading around $1.8520, and you can wait for confirmation before opening a buy position. There is a strong support zone for #XRP between $1.8360 and $1.8200, and price has already reacted positively and bounced from this area today. If bullish confirmation is given, the potential upside targets are: ↗️ $1.8857 $1.9170 $1.9488 You can manage the trade based on your risk-to-reward strategy, or simply stay in the position as long as price action remains strong and momentum continues. That said, whenever you reach a solid profit, it’s always smart to secure partial profits.The price of #XRP surged 7.8% without leverage, in line with our analysis. We hope you were able to benefit from this insight! 💸
mrsignalll
SOL Range Trading Strategy - Buy the Bottom

#SOLUSDT | 4 HOUR TIMEFRAME UPDATE Over the past 47 days, #SOL has been trading within a clear and well-defined range, and price has respected this range beautifully. 👌 First, let me clarify something important: If you believe that a ranging market cannot be traded, you are 100% wrong. Range markets offer excellent opportunities. You can buy near the bottom of the range and sell near the top of the range. If you review my previous analyses, you’ll see that I’ve shared many range-based setups, and around 90% of them played out perfectly. I’ve also explained how to trade these conditions correctly: 👇👇 🟢 Look for confirmation when price reaches the bottom of the trading range to open buy positions. 🔴 Look for confirmation when price reaches the top of the trading range to take sells or profits. This strategy works on any timeframe—from higher timeframes down to even the 1-minute chart—as long as the trading range is clearly identified. ✅ Now, let’s get back to the #Solana analysis ⚡️ At the moment, #SOL is trading near the bottom of its range, which means you can start looking for buy confirmations. Targets: The primary target is the top of the trading range at $144. If price breaks above the range with strong and valid candles, you can hold your buy positions and even look for new entries after a confirmed breakout and retest. One more important timing note: Today is December 31st. You can start looking for buy opportunities after the new monthly candle opens. Additionally, you can also look for buy setups when the new weekly candle opens. In my experience, waiting a few days after the monthly candle opens often provides cleaner price action and better trading conditions, which makes entries more reliable. ✅ If you found this analysis useful, support it 👍 and share it with your friends who are holding Solana.#SOLUSDT | 4 HOUR TIMEFRAME UPDATE #SOL surged 7.32% from the bottom of its trading range — all without leverage. ⚡️ Hope you managed to lock in some solid profits! 💸
mrsignalll
TON Ready for a Big Move
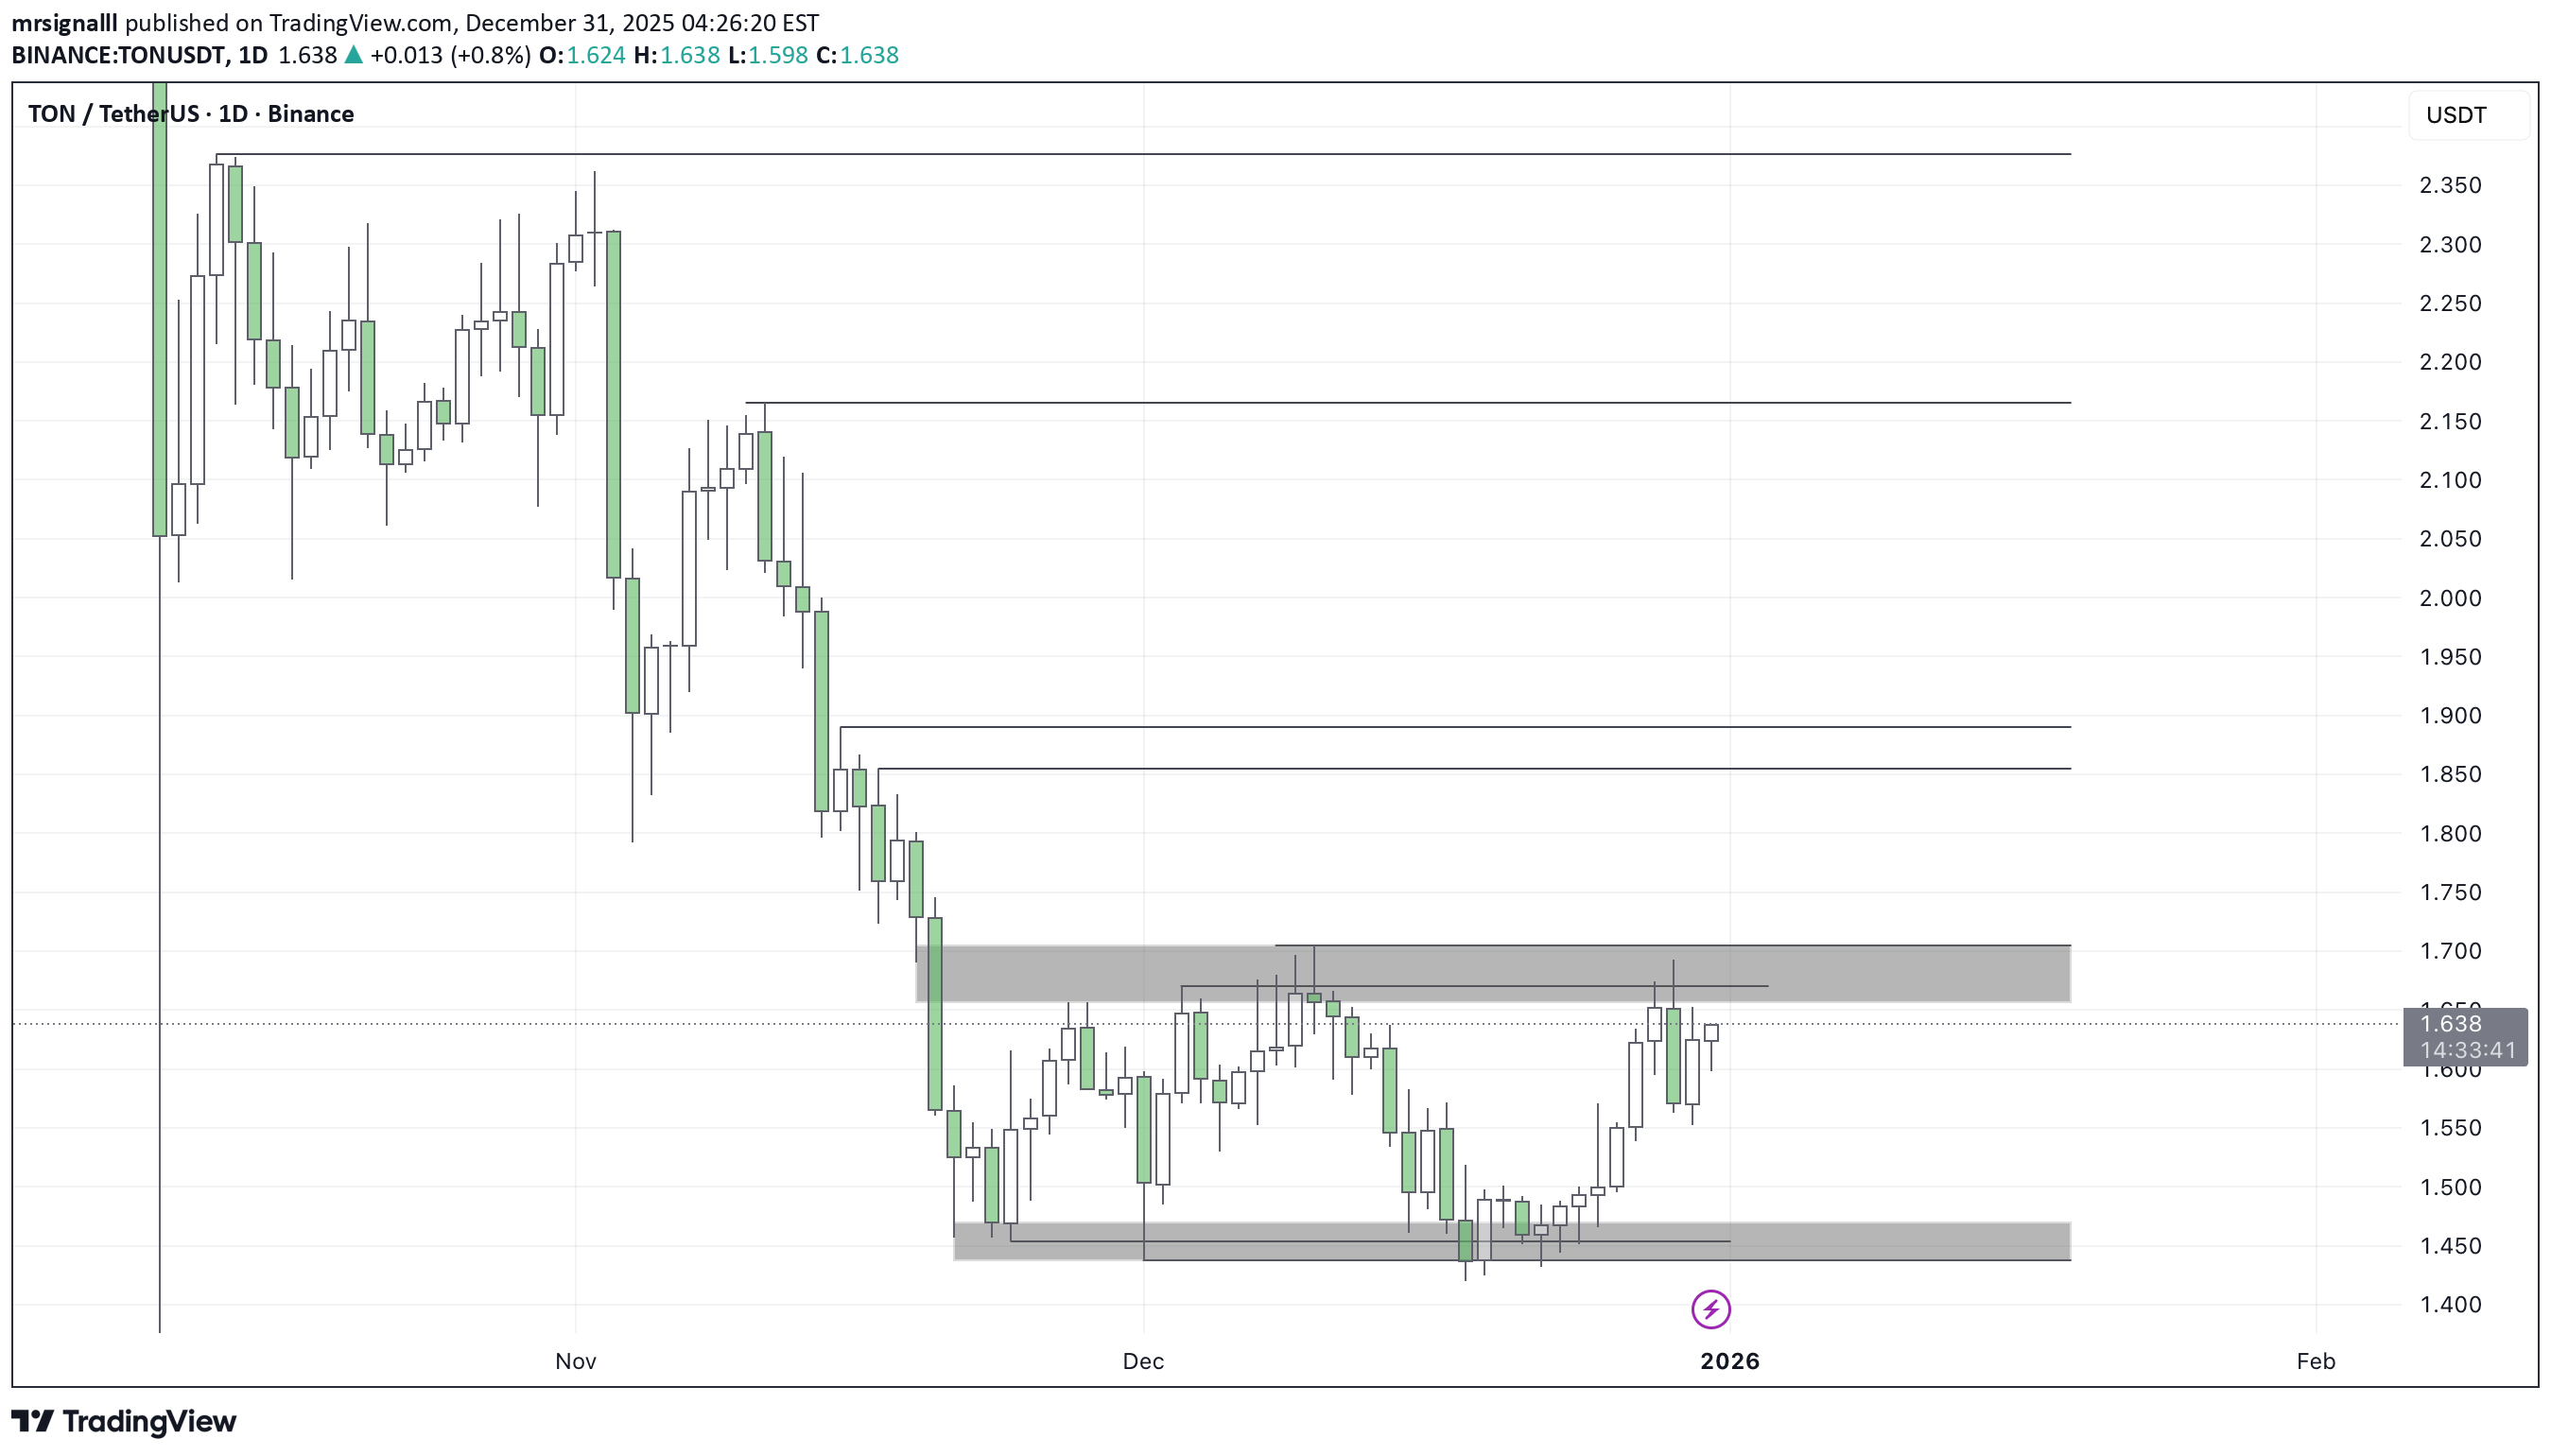
#TONUSDT | DAILY TIMEFRAME UPDATE The price of #TON is trading in a range between $1.440 and $1.700, and it has been moving inside this range for almost 40 days. 📊 The price will not stay in this trading range forever, and we will have a breakout for sure. The question is: will it break the low of the range and dump more, or will it break the high of the range and pump to the upside? 🤔 Based on the chart, we can say that the price could break the top of the range and move to the upside. So you need to wait for the price to break above the trading range with a strong bullish candle, and then you can look for buy trades.#TON has finally broken out of its trading range and has already pumped 12% in just one day — spot only, no leverage needed. Hope you caught the move and secured some clean profits.
mrsignalll
Is Bitcoin Heading Back to the Range High?
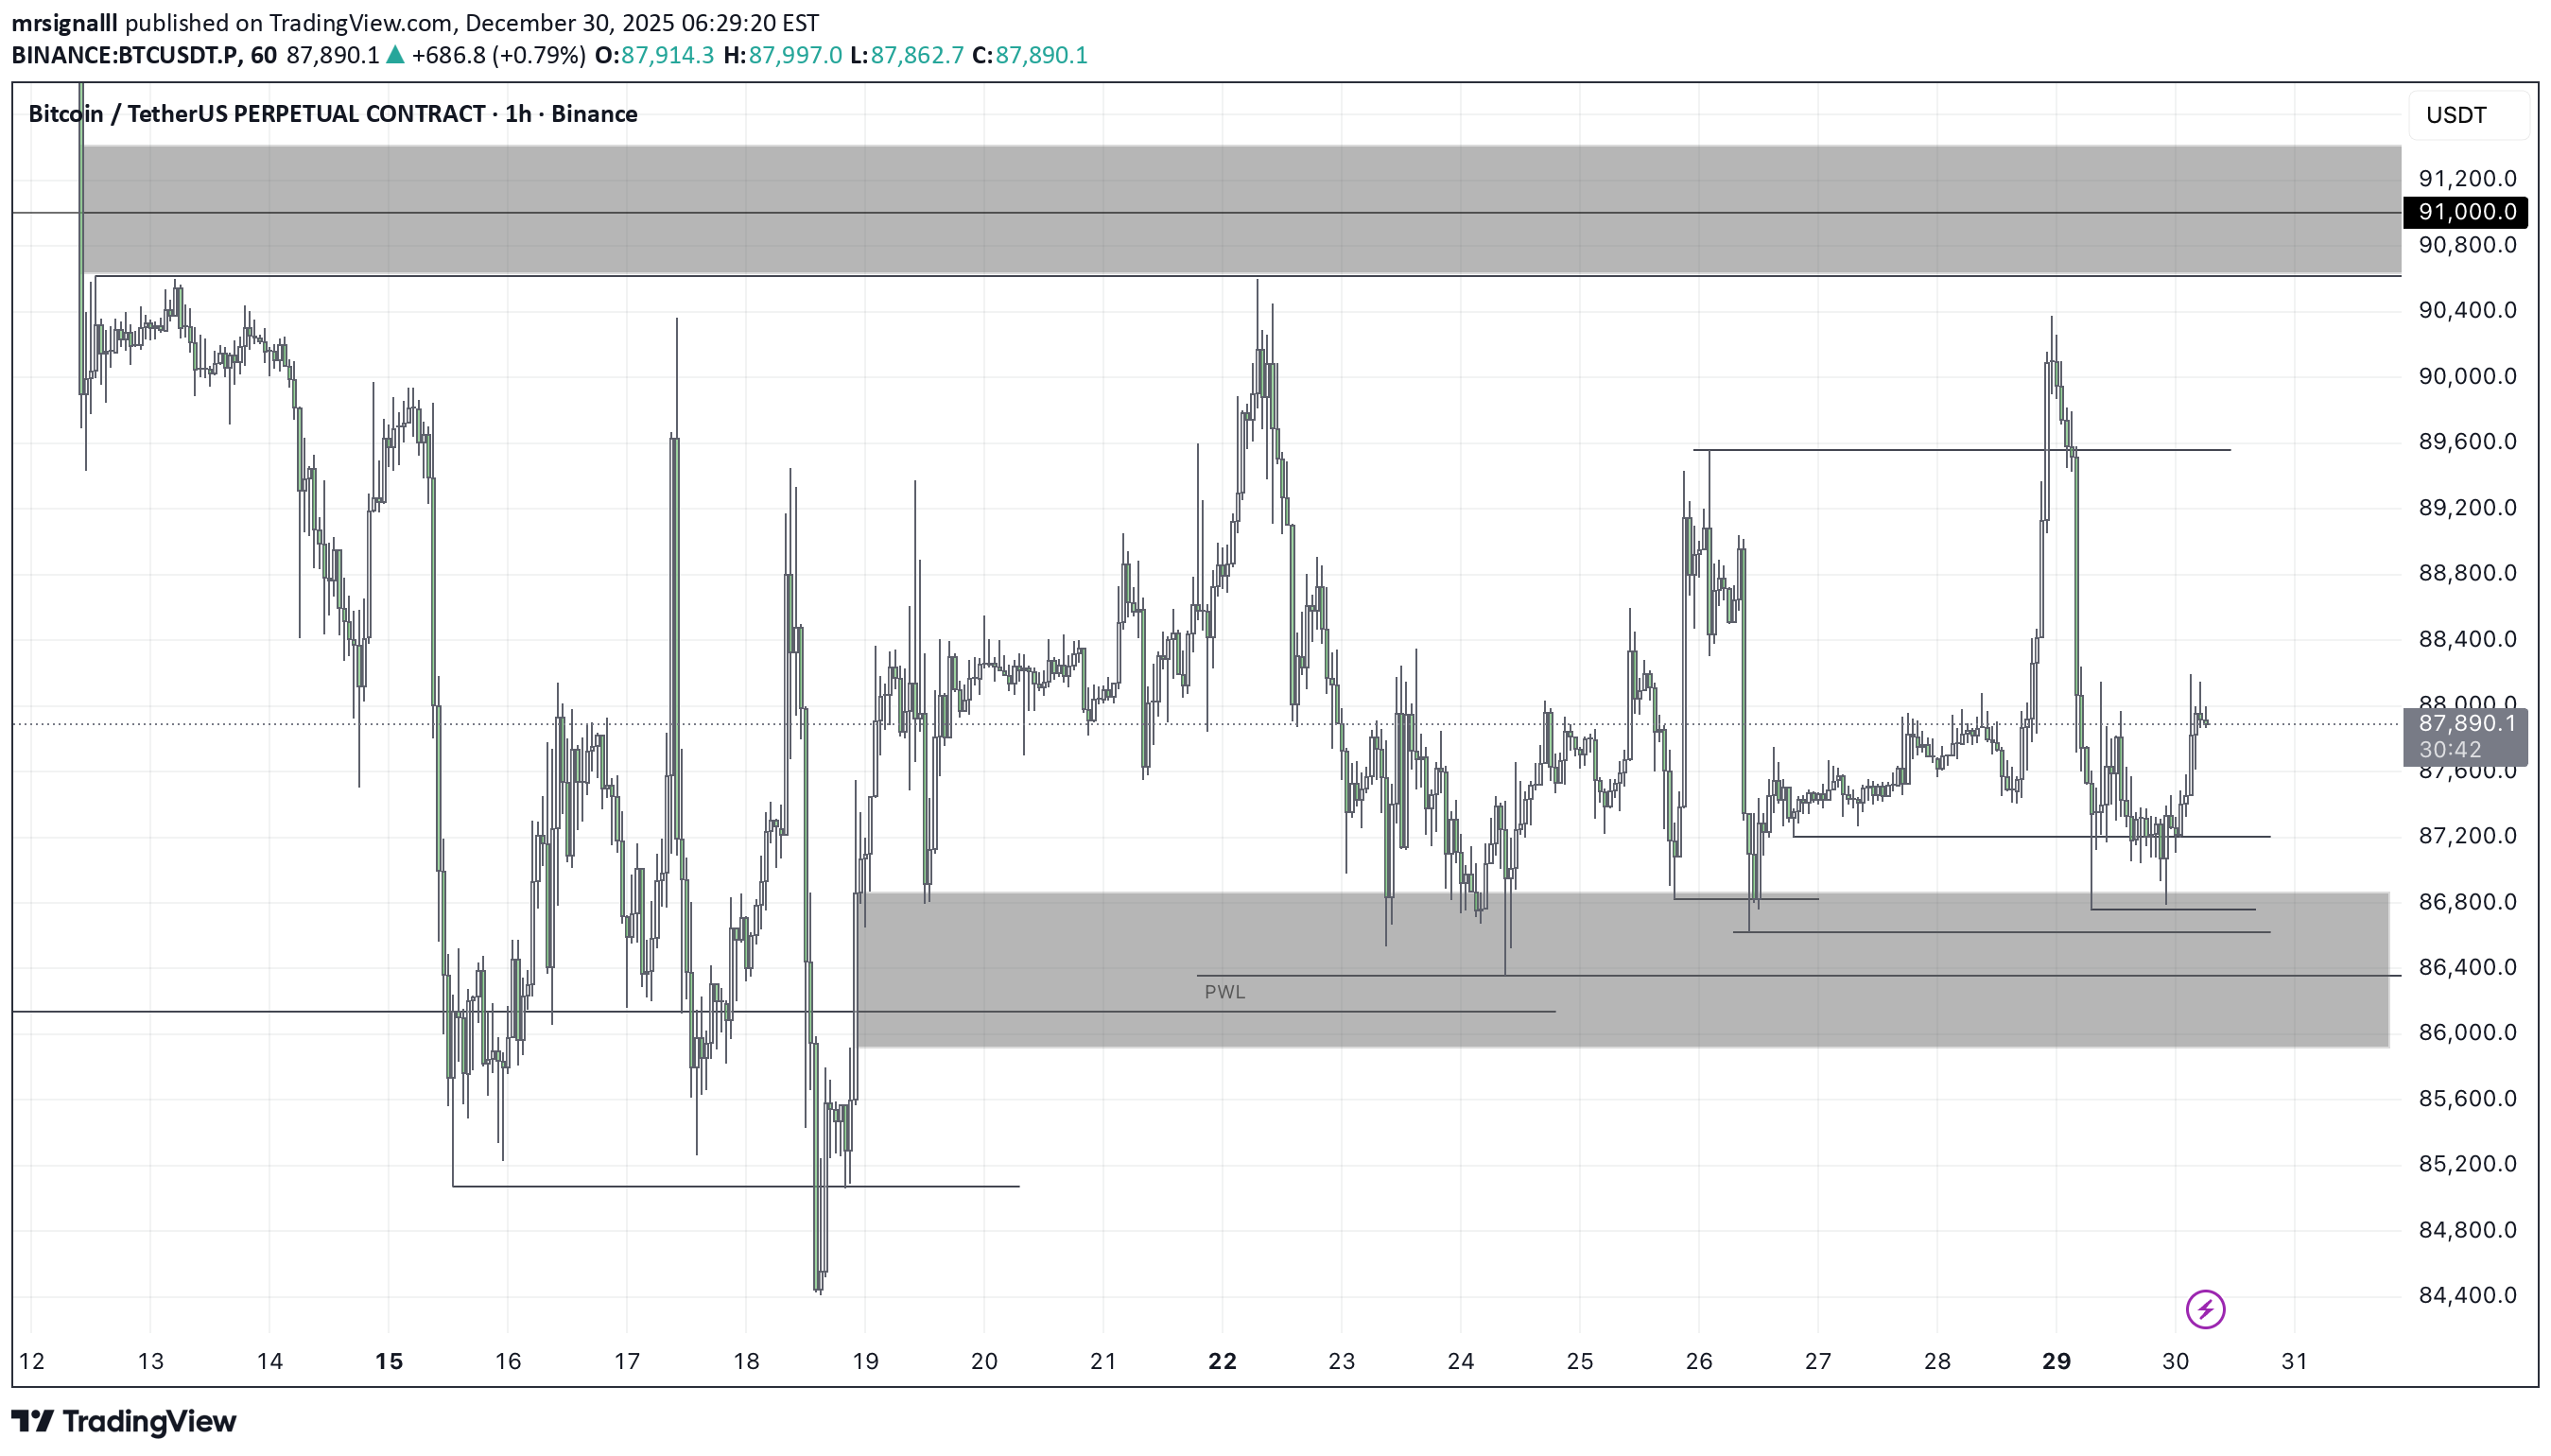
#BTCUSDT | 1 HOUR TIMEFRAME UPDATE I zoomed out a bit to look at the full 1H chart of #BTC. As you can see, price is clearly trading inside a range. Yesterday, #BTC tapped the lower boundary of the range around $87,000–$86,300 and reacted with a small bounce. Where could price go next? 💭 The most likely scenario is a move toward the top of the range. The upper boundary of this range sits roughly between $90,632 and $91,400. At the moment, #Bitcoin is trading around $87,926. If we get proper confirmation during the New York session, we can look for long opportunities, targeting the top of the trading range. Once price reaches that area, longs should be closed. ⚠️ Important note: We’re at the very end of December (December 30), and liquidity is usually thin. Every trade taken during the final days of December carries higher risk, so manage risk carefully.#BTCUSDT | 4 HOUR TIMEFRAME UPDATE If you have pay attention to our last analysis I said the price is still in a range and it was near to the bottom of the range and the price was around $88,000 and the price pumped 3.21% without leverage and reached to the top of the range at $90,632 - $91,400.🚨 QUICK #BITCOIN UPDATE 🚨 Guys, check out #BTC — it’s hitting the top of its trading range, and look at those shadows! Definitely something to think about! 🤔
Disclaimer
Any content and materials included in Sahmeto's website and official communication channels are a compilation of personal opinions and analyses and are not binding. They do not constitute any recommendation for buying, selling, entering or exiting the stock market and cryptocurrency market. Also, all news and analyses included in the website and channels are merely republished information from official and unofficial domestic and foreign sources, and it is obvious that users of the said content are responsible for following up and ensuring the authenticity and accuracy of the materials. Therefore, while disclaiming responsibility, it is declared that the responsibility for any decision-making, action, and potential profit and loss in the capital market and cryptocurrency market lies with the trader.