
jirapattinn
@t_jirapattinn

What symbols does the trader recommend buying?
Purchase History
پیام های تریدر
Filter
jirapattinn
پیشبینی موج الیوت اتریوم (ETH) تا پایان ۲۰۲۵: آیا کف قیمتی آخر فرا رسیده است؟
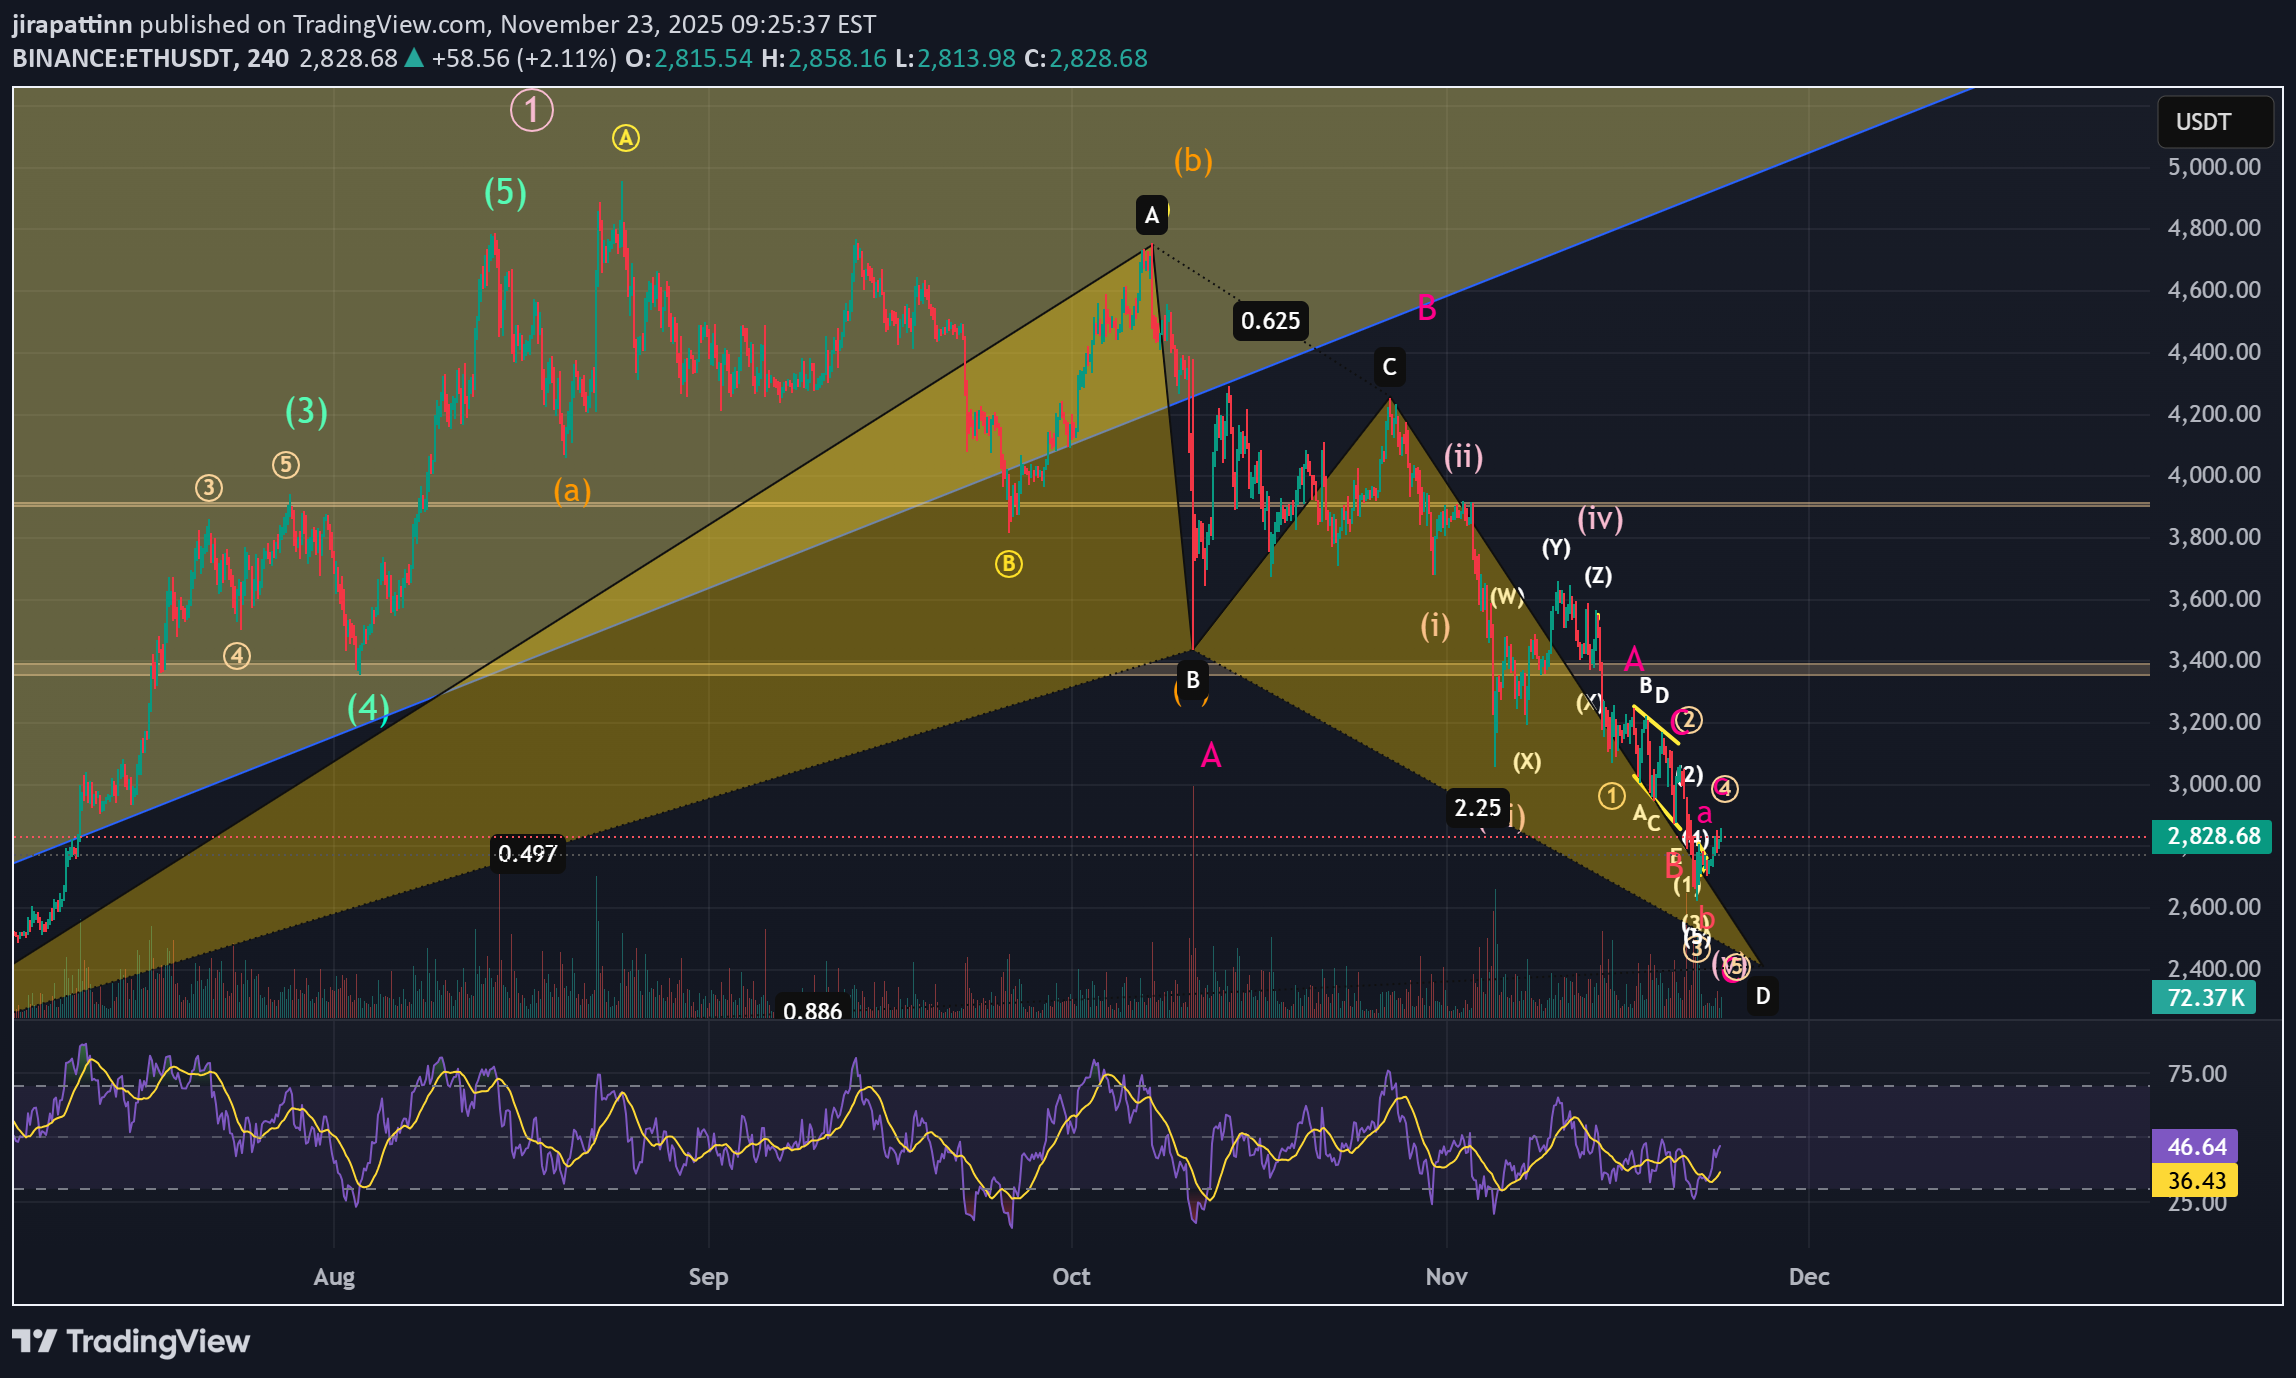
This is my current Elliott wave count of ETH.I think that there will be a last lower low and then,the wave 3 shall begin.
jirapattinn
پیشبینی موج سوم اتریوم: آیا ETH آماده انفجار قیمتی است؟

I think that ETH is ready to go for the next wave 3 impluse
jirapattinn
jirapattinn
پایان اصلاح اتریوم تا ۲۰۲۵: پیشبینی موج نهایی و تکمیل ساختار WXYXZ
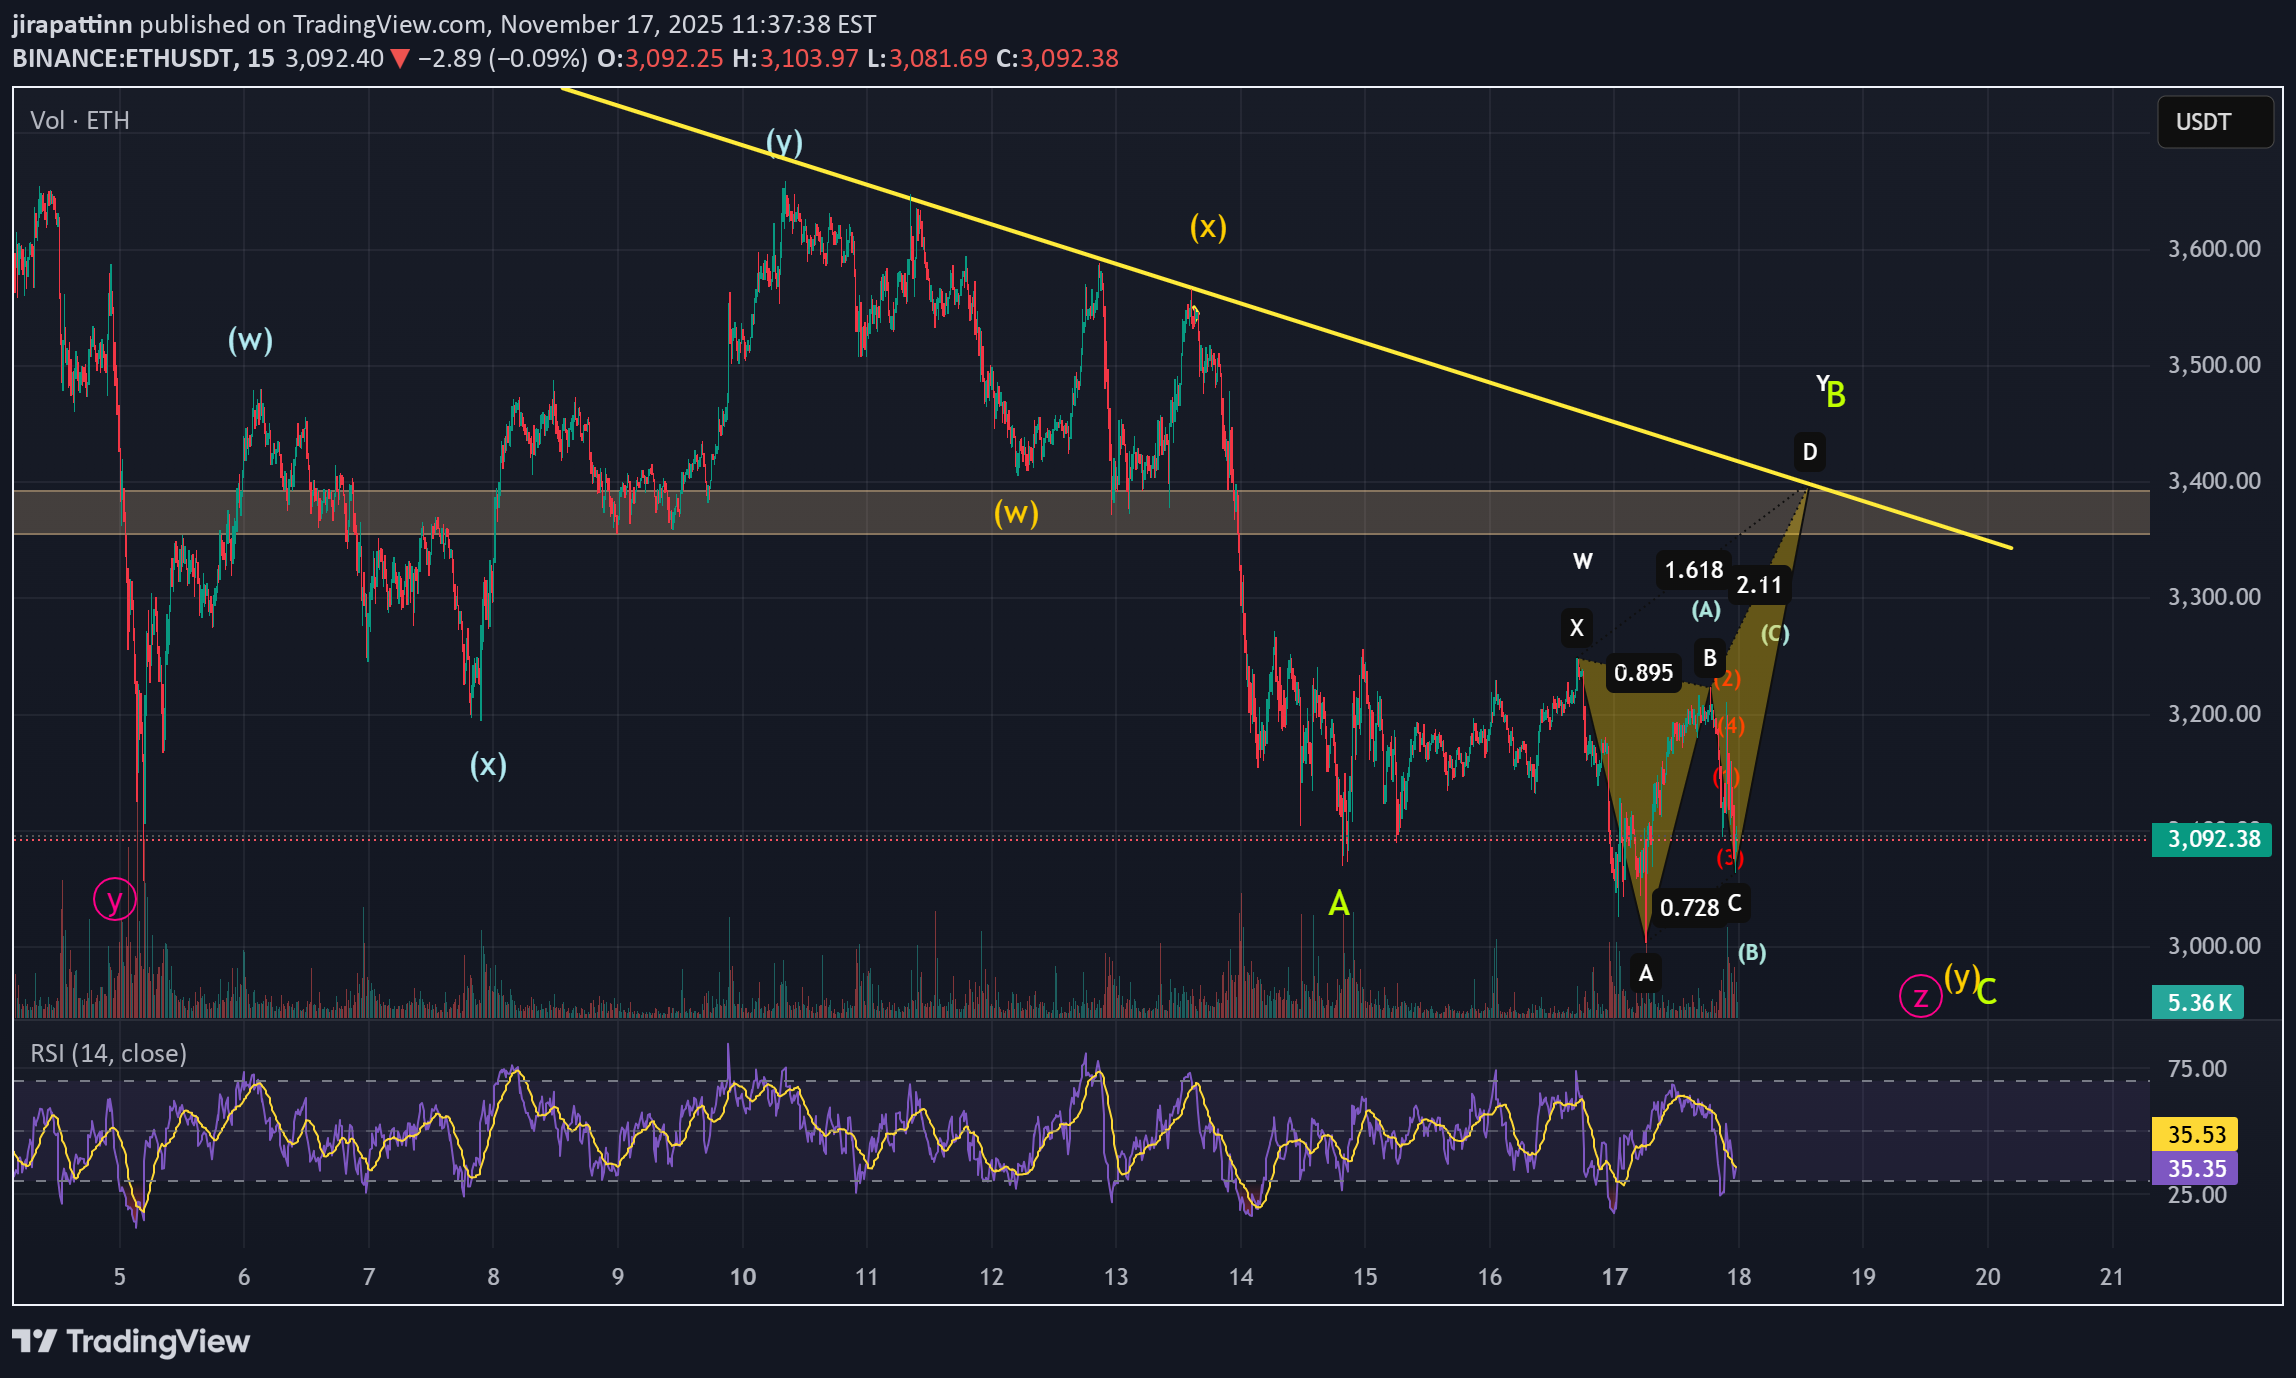
We are close to the end of the correction, Expect for another lower high to meet the resistance and then the last lower low to complete WXYXZ correction.
jirapattinn
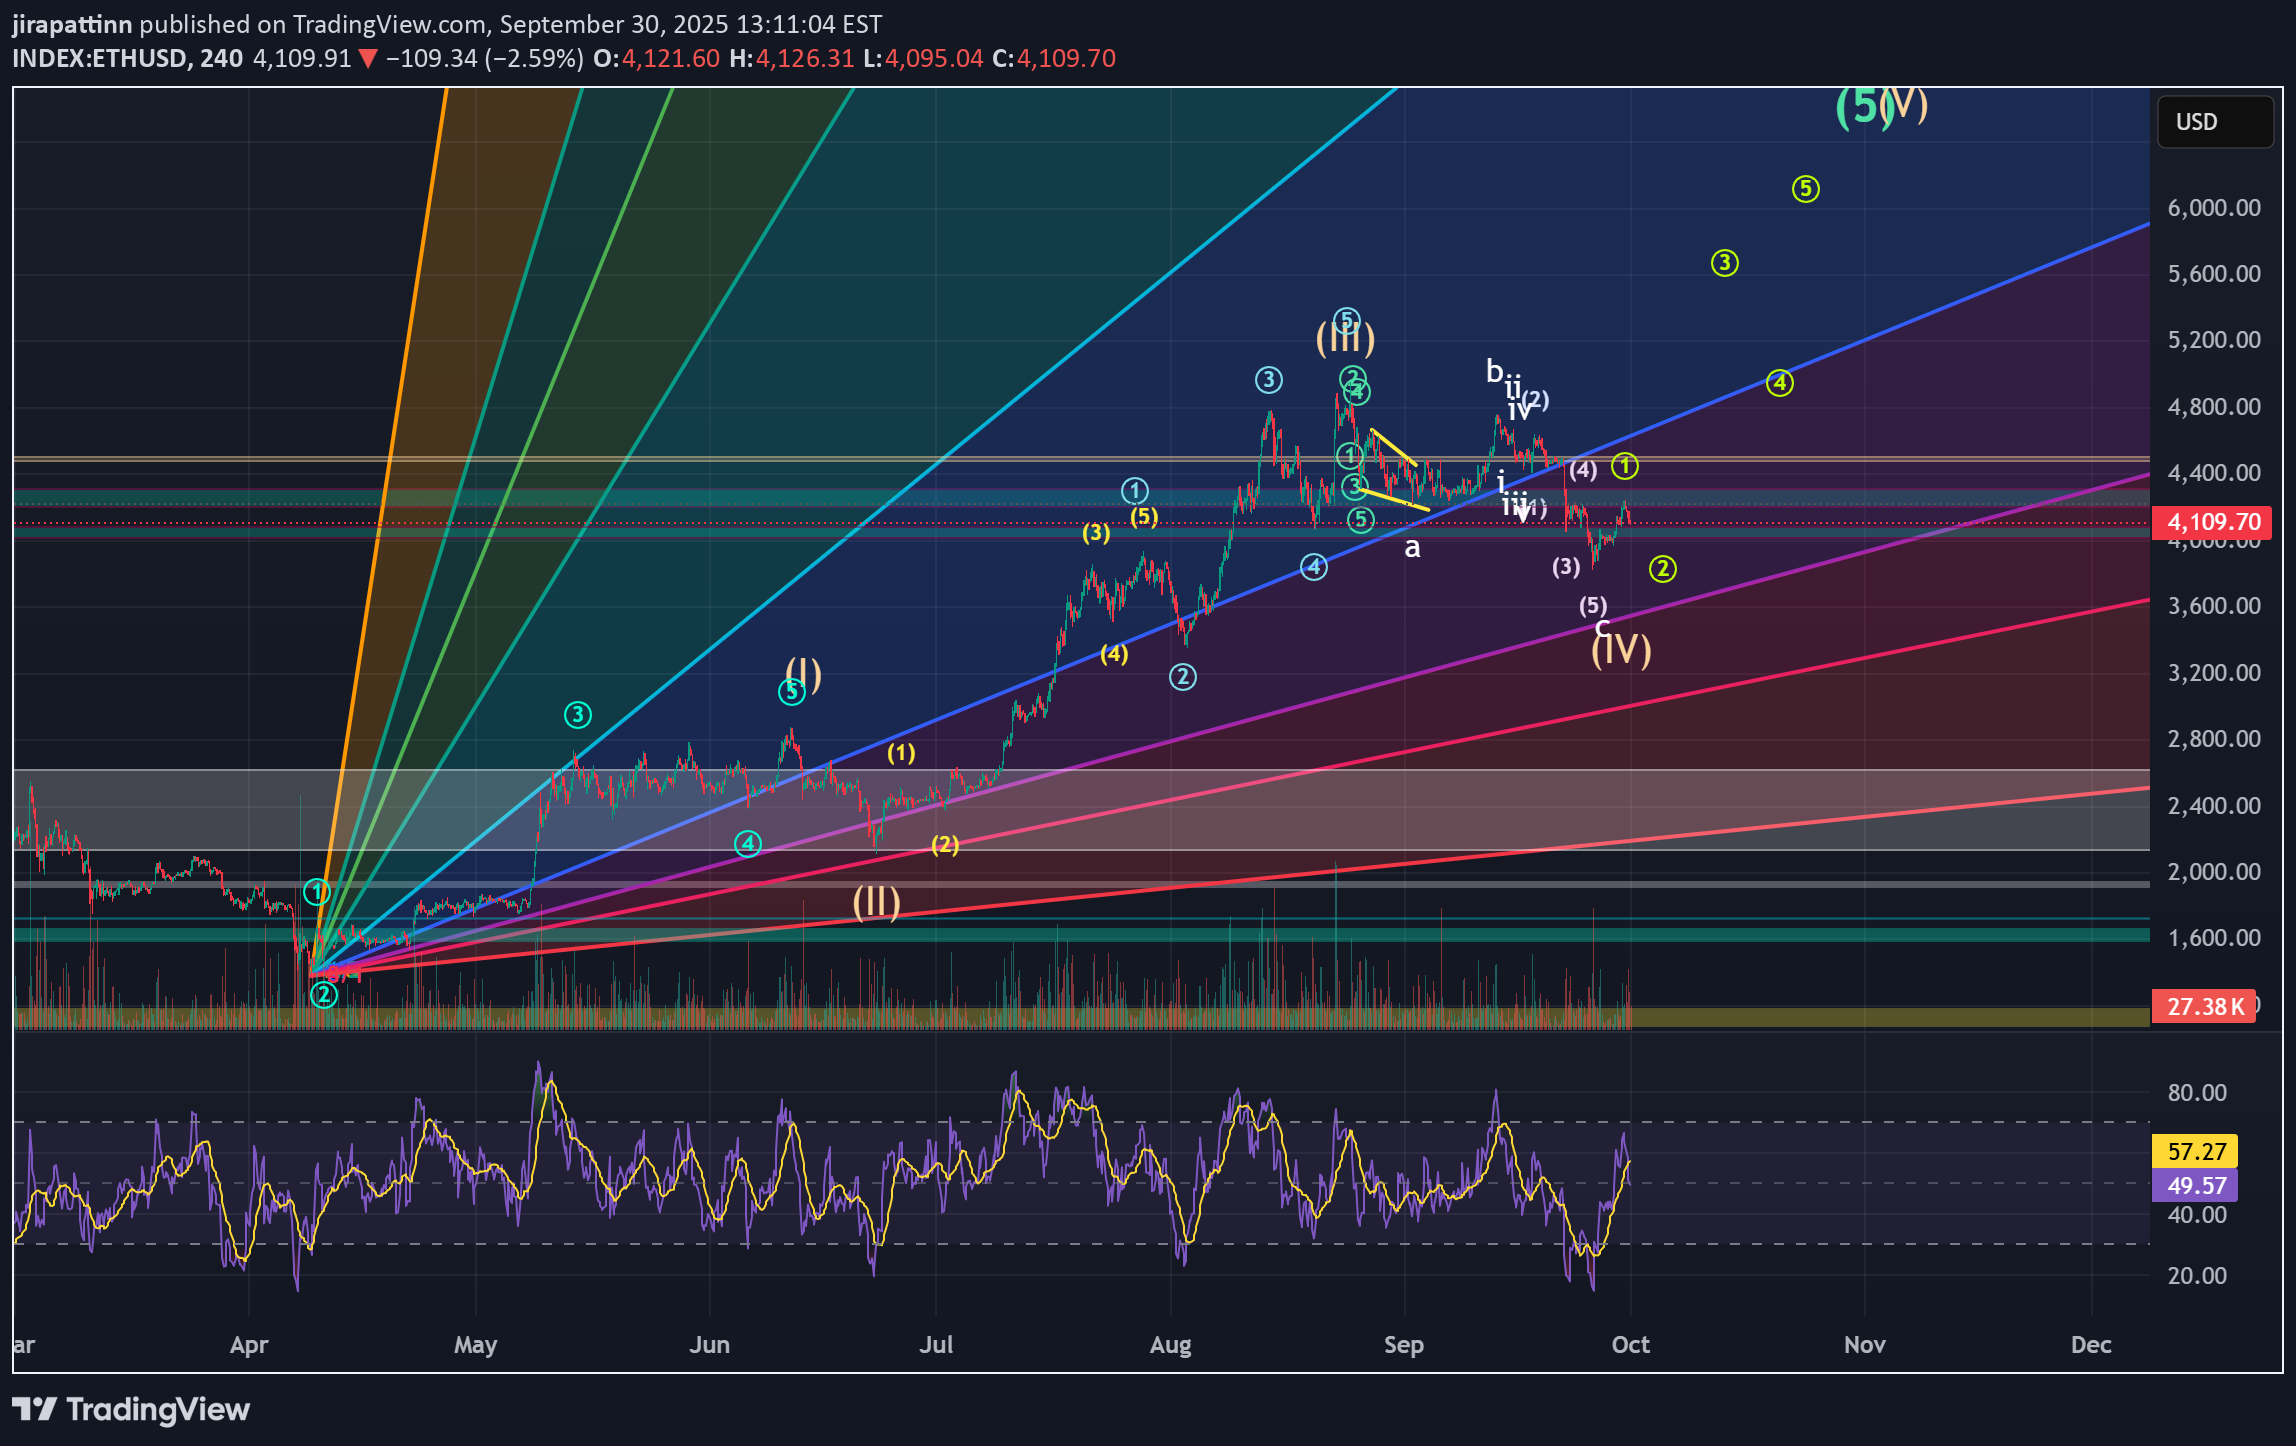
تحلیل موج الیوت اتریوم (ETH): مسیر صعودی تا ۵۱۰۰ دلار و منطقه حیاتی حمایت!
In my view, ETH has not yet completed its upside cycle, and the recent decline is simply part of wave (c) within wave (IV). I believe we are currently in wave (5), specifically within wave 3 of that structure. The reason is that if waves 1 and 3 were corrective ABC structures, then wave C should not exceed 138.2% of wave A, otherwise it would invalidate the b-failure flat pattern—and this limit has already been exceeded, confirming the impulsive nature of the current move. The Shark harmonic pattern indicates a potential target zone around $5,000–$5,100, which aligns with the requirement for a higher high to complete wave 5. Interestingly, this target also coincides with a Gann Fan resistance level, adding further confluence to this projection. The invalidation level for this bullish scenario is at $3,800. A break below this level would suggest that a full bear market structure has already begun.
jirapattinn
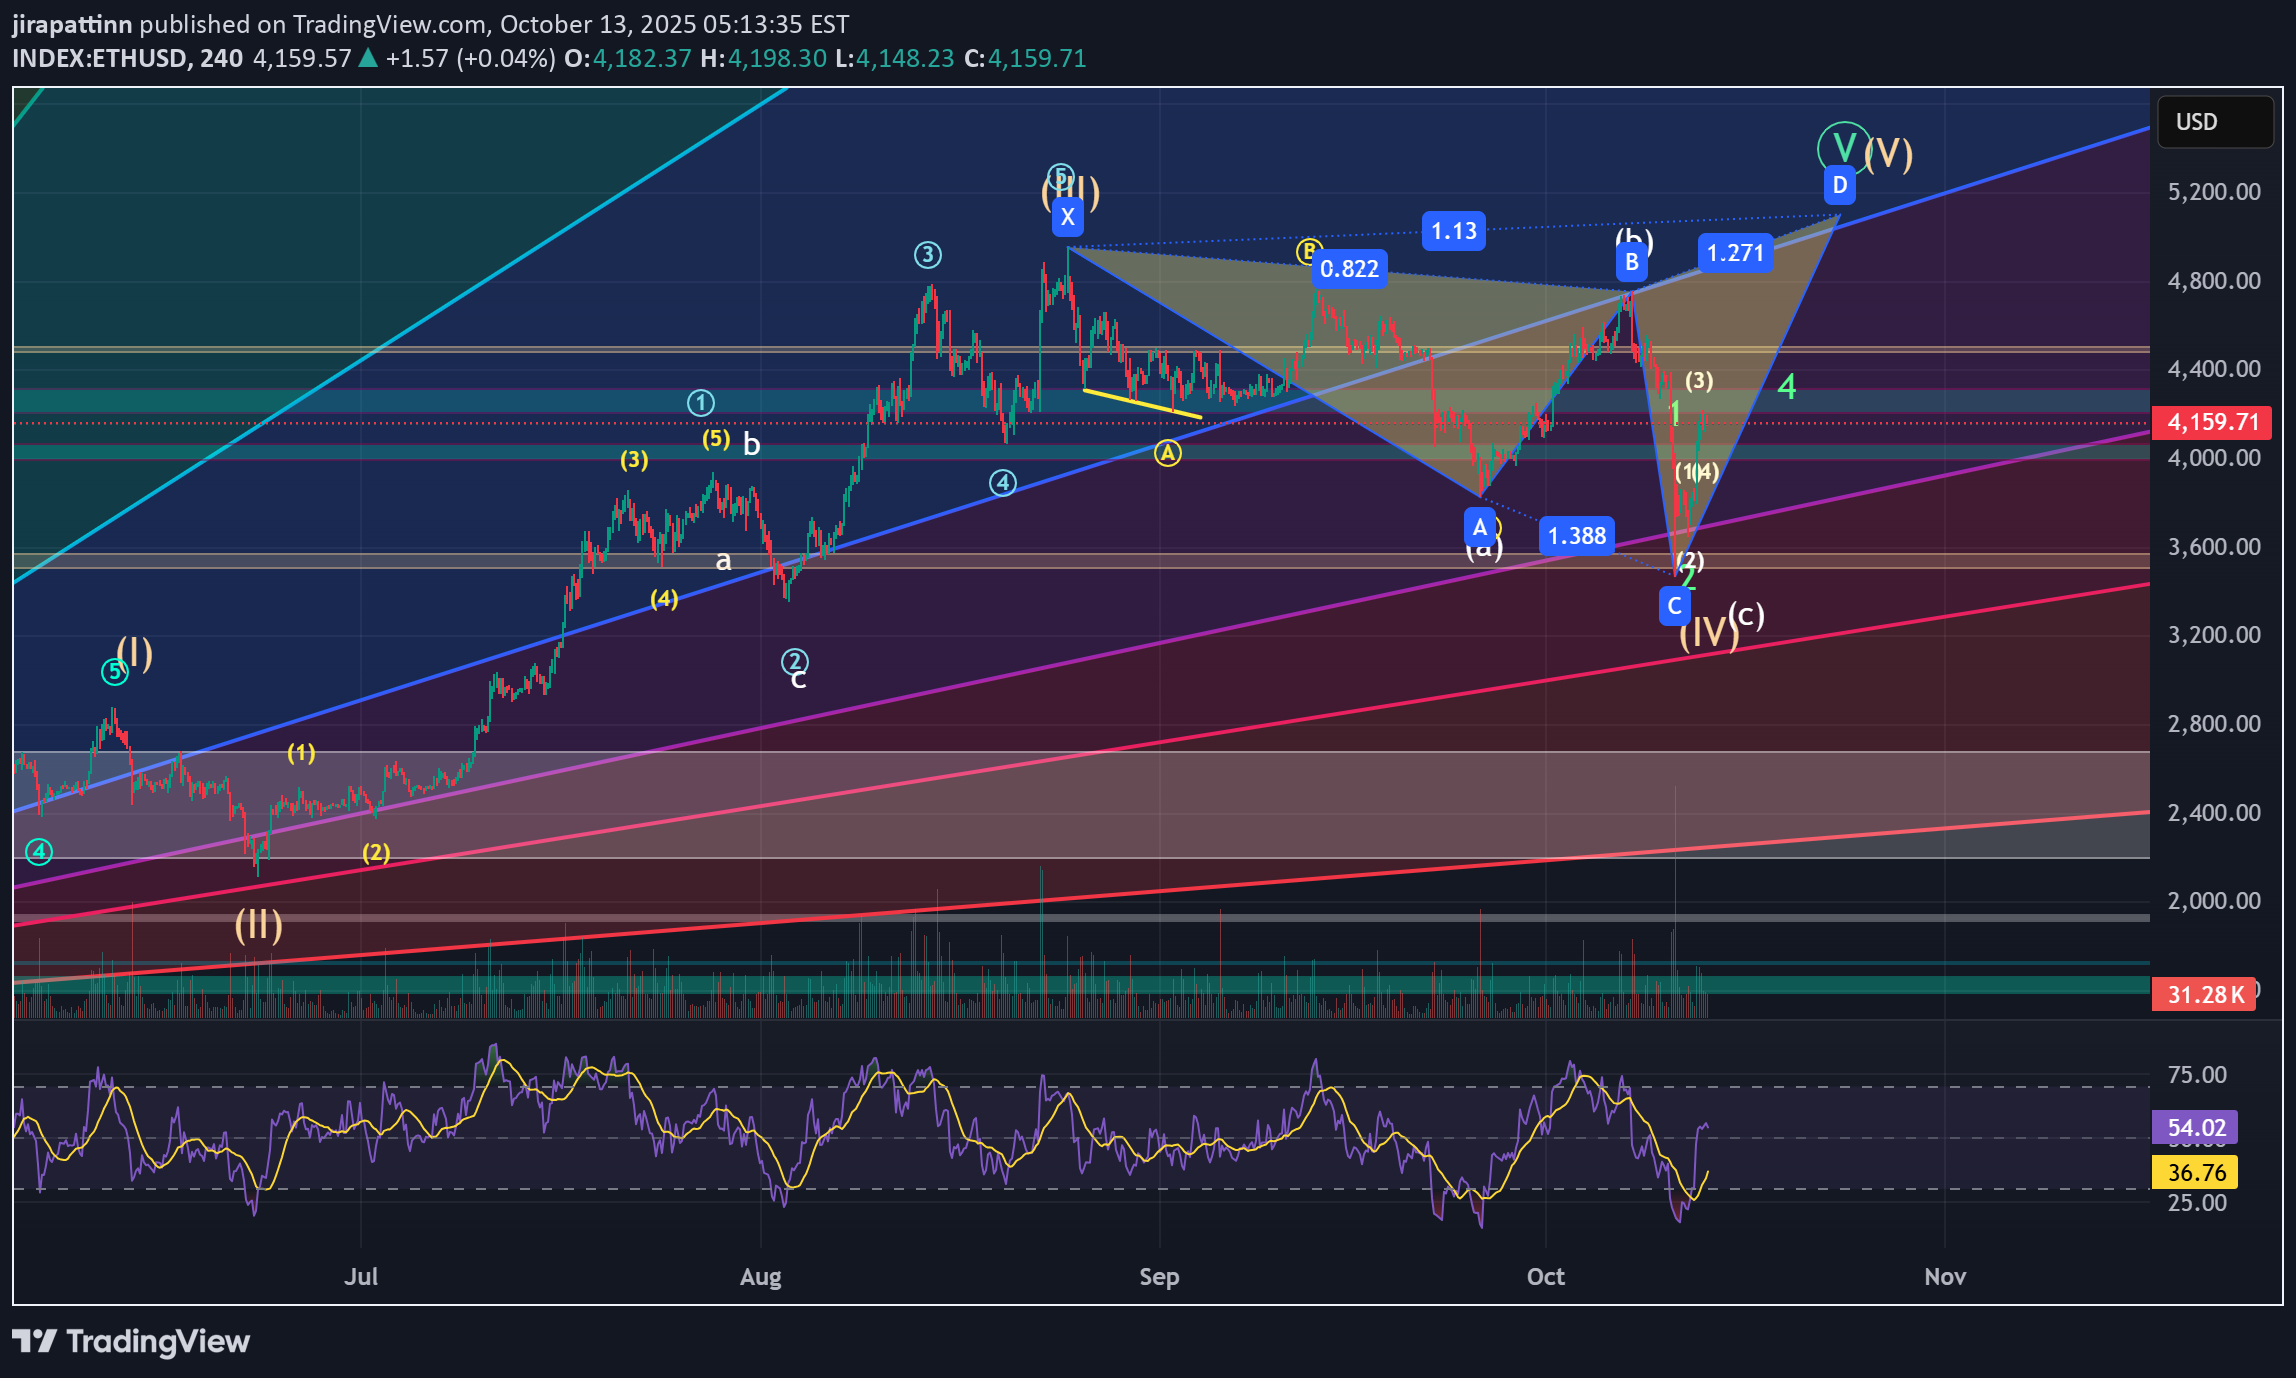
ETH Elliott wave analysis 1/10 /2025
In my point of view , The wave (IV) is end and we are going to finish the wave (5).The new wave ①, which has surpassed the top of wave (4) with a strong impulse, indicates that the beginning of wave (V) has likely started. Wave (IV) appears to have formed a b-failure flat, where wave C slightly exceeded 132.8%. Based on the Butterfly harmonic pattern from the higher time frame ETH analysis, the target price is projected to be in the range of $5,900–$6,400. An alternative count is that the recent abc structure may represent waves 1, 2, and 3, with the current correction being only a minor retracement. This scenario requires further observation. However, the overall Elliott Wave structure still suggests that one more upward wave is needed to complete wave (5).
jirapattinn
ETH HTF Butterfly Harmonic
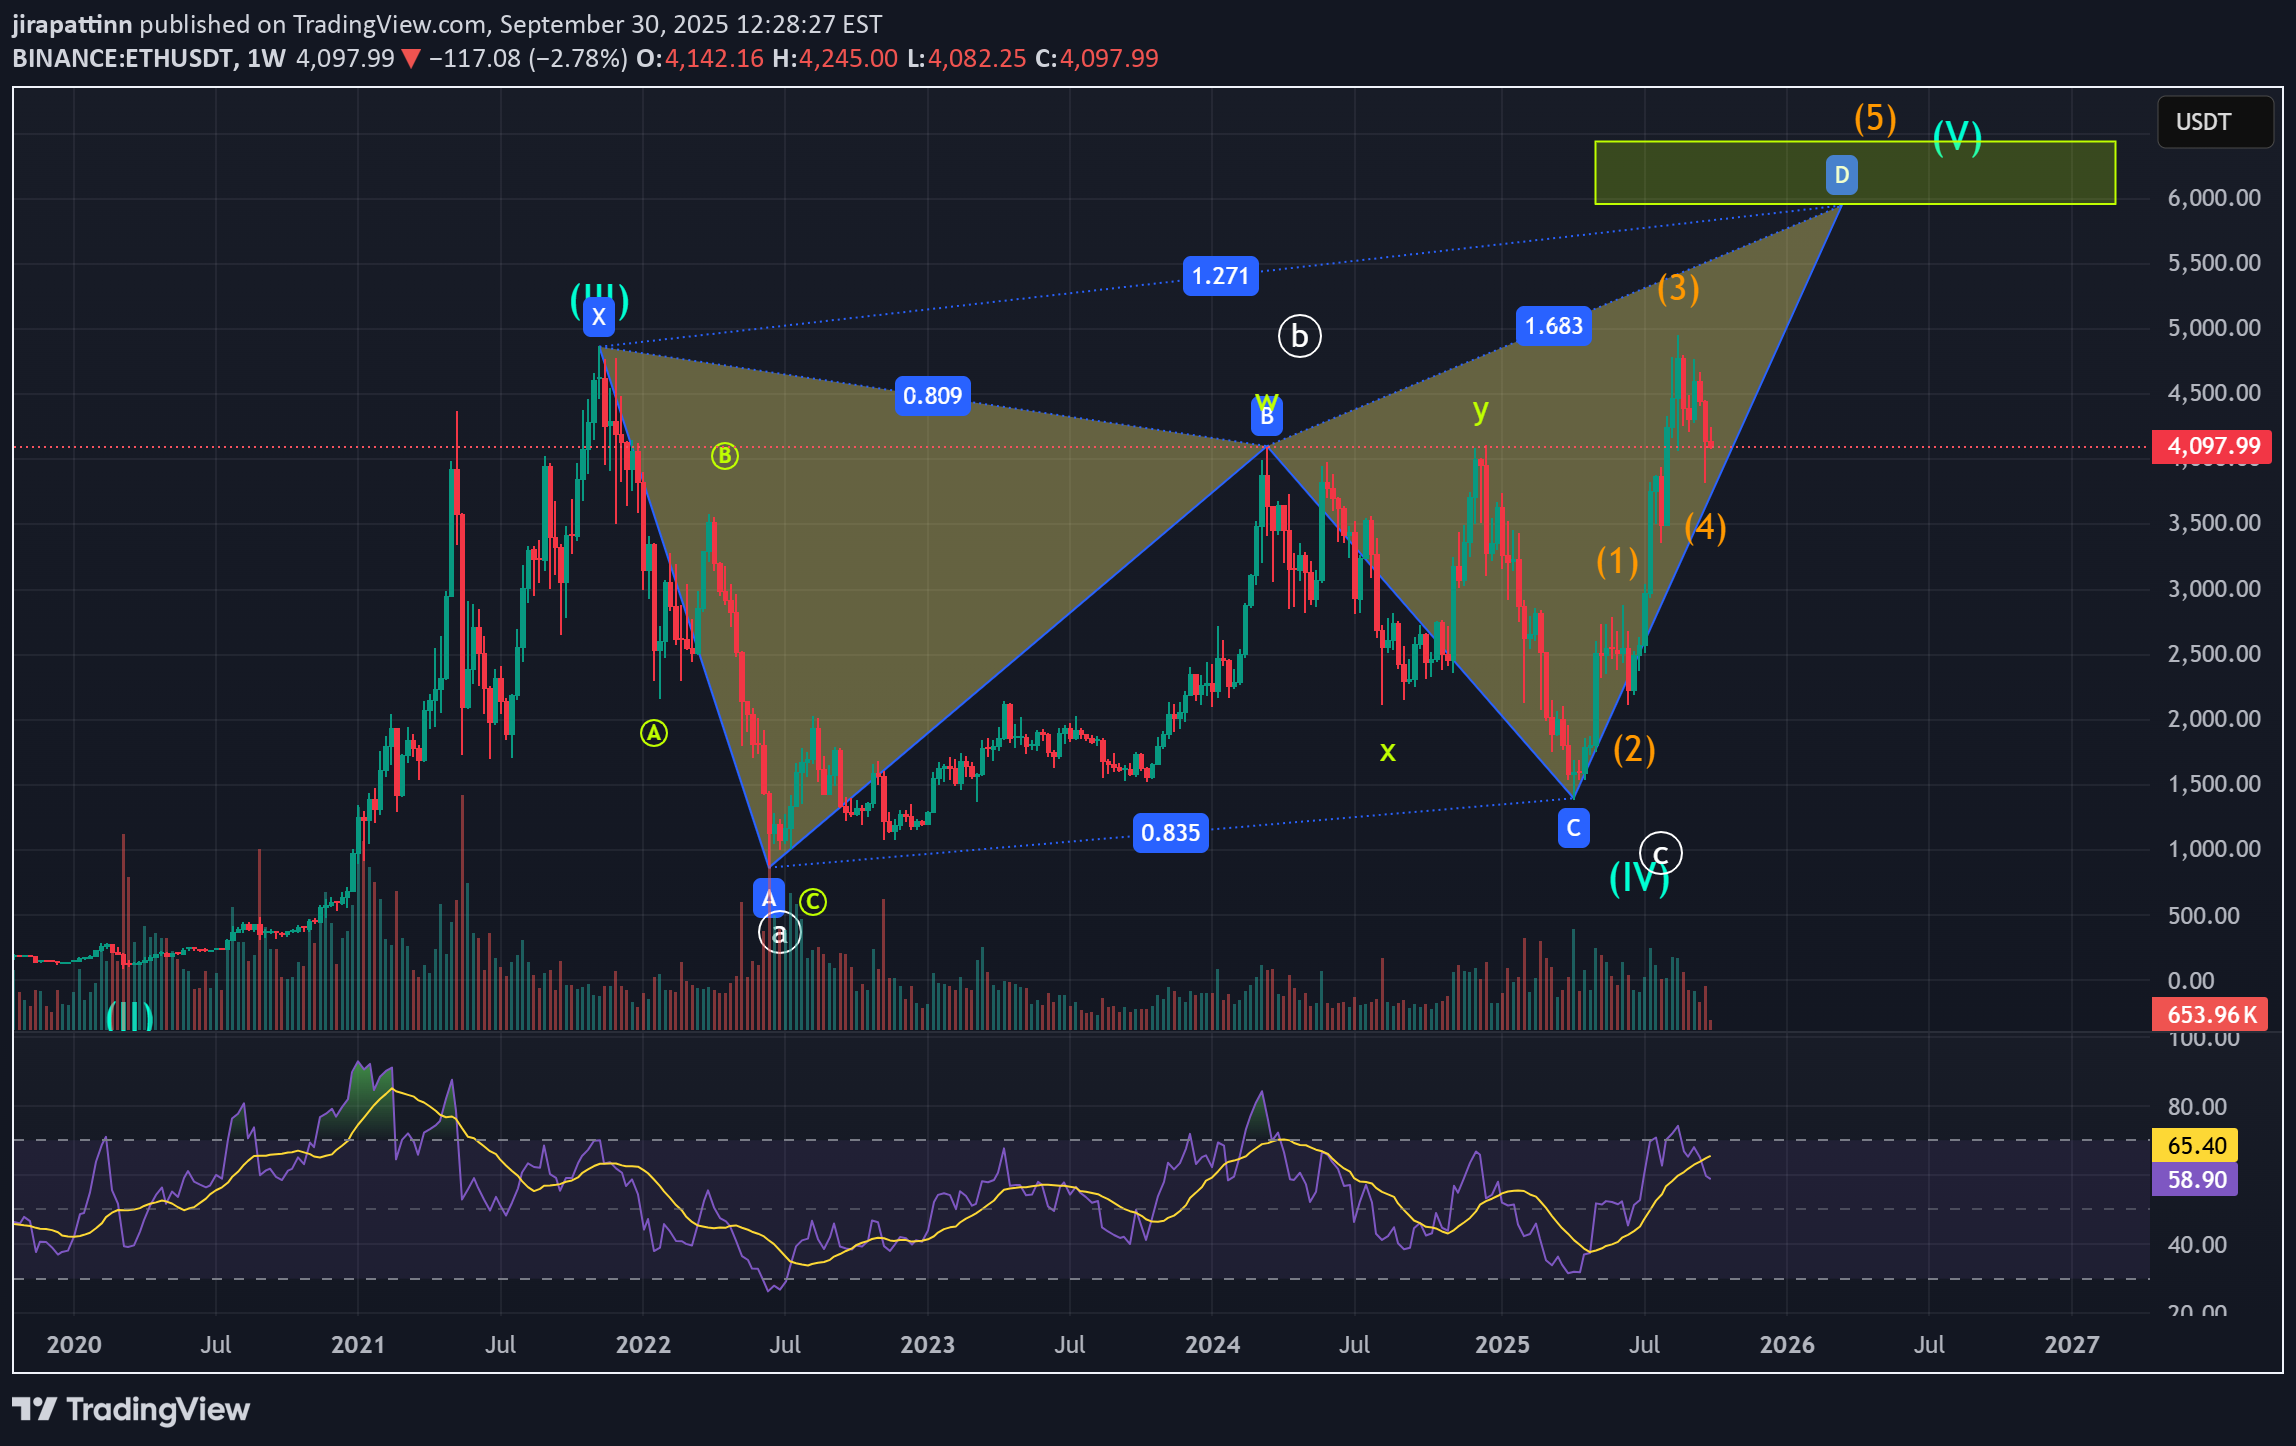
As we can see, the Elliott Wave count for wave (V) is still incomplete. Combined with the Butterfly harmonic pattern, this suggests a target price in the range of $5,900–$6,400. The invalidation level is if wave (4) overlaps with the top of wave (1).
jirapattinn
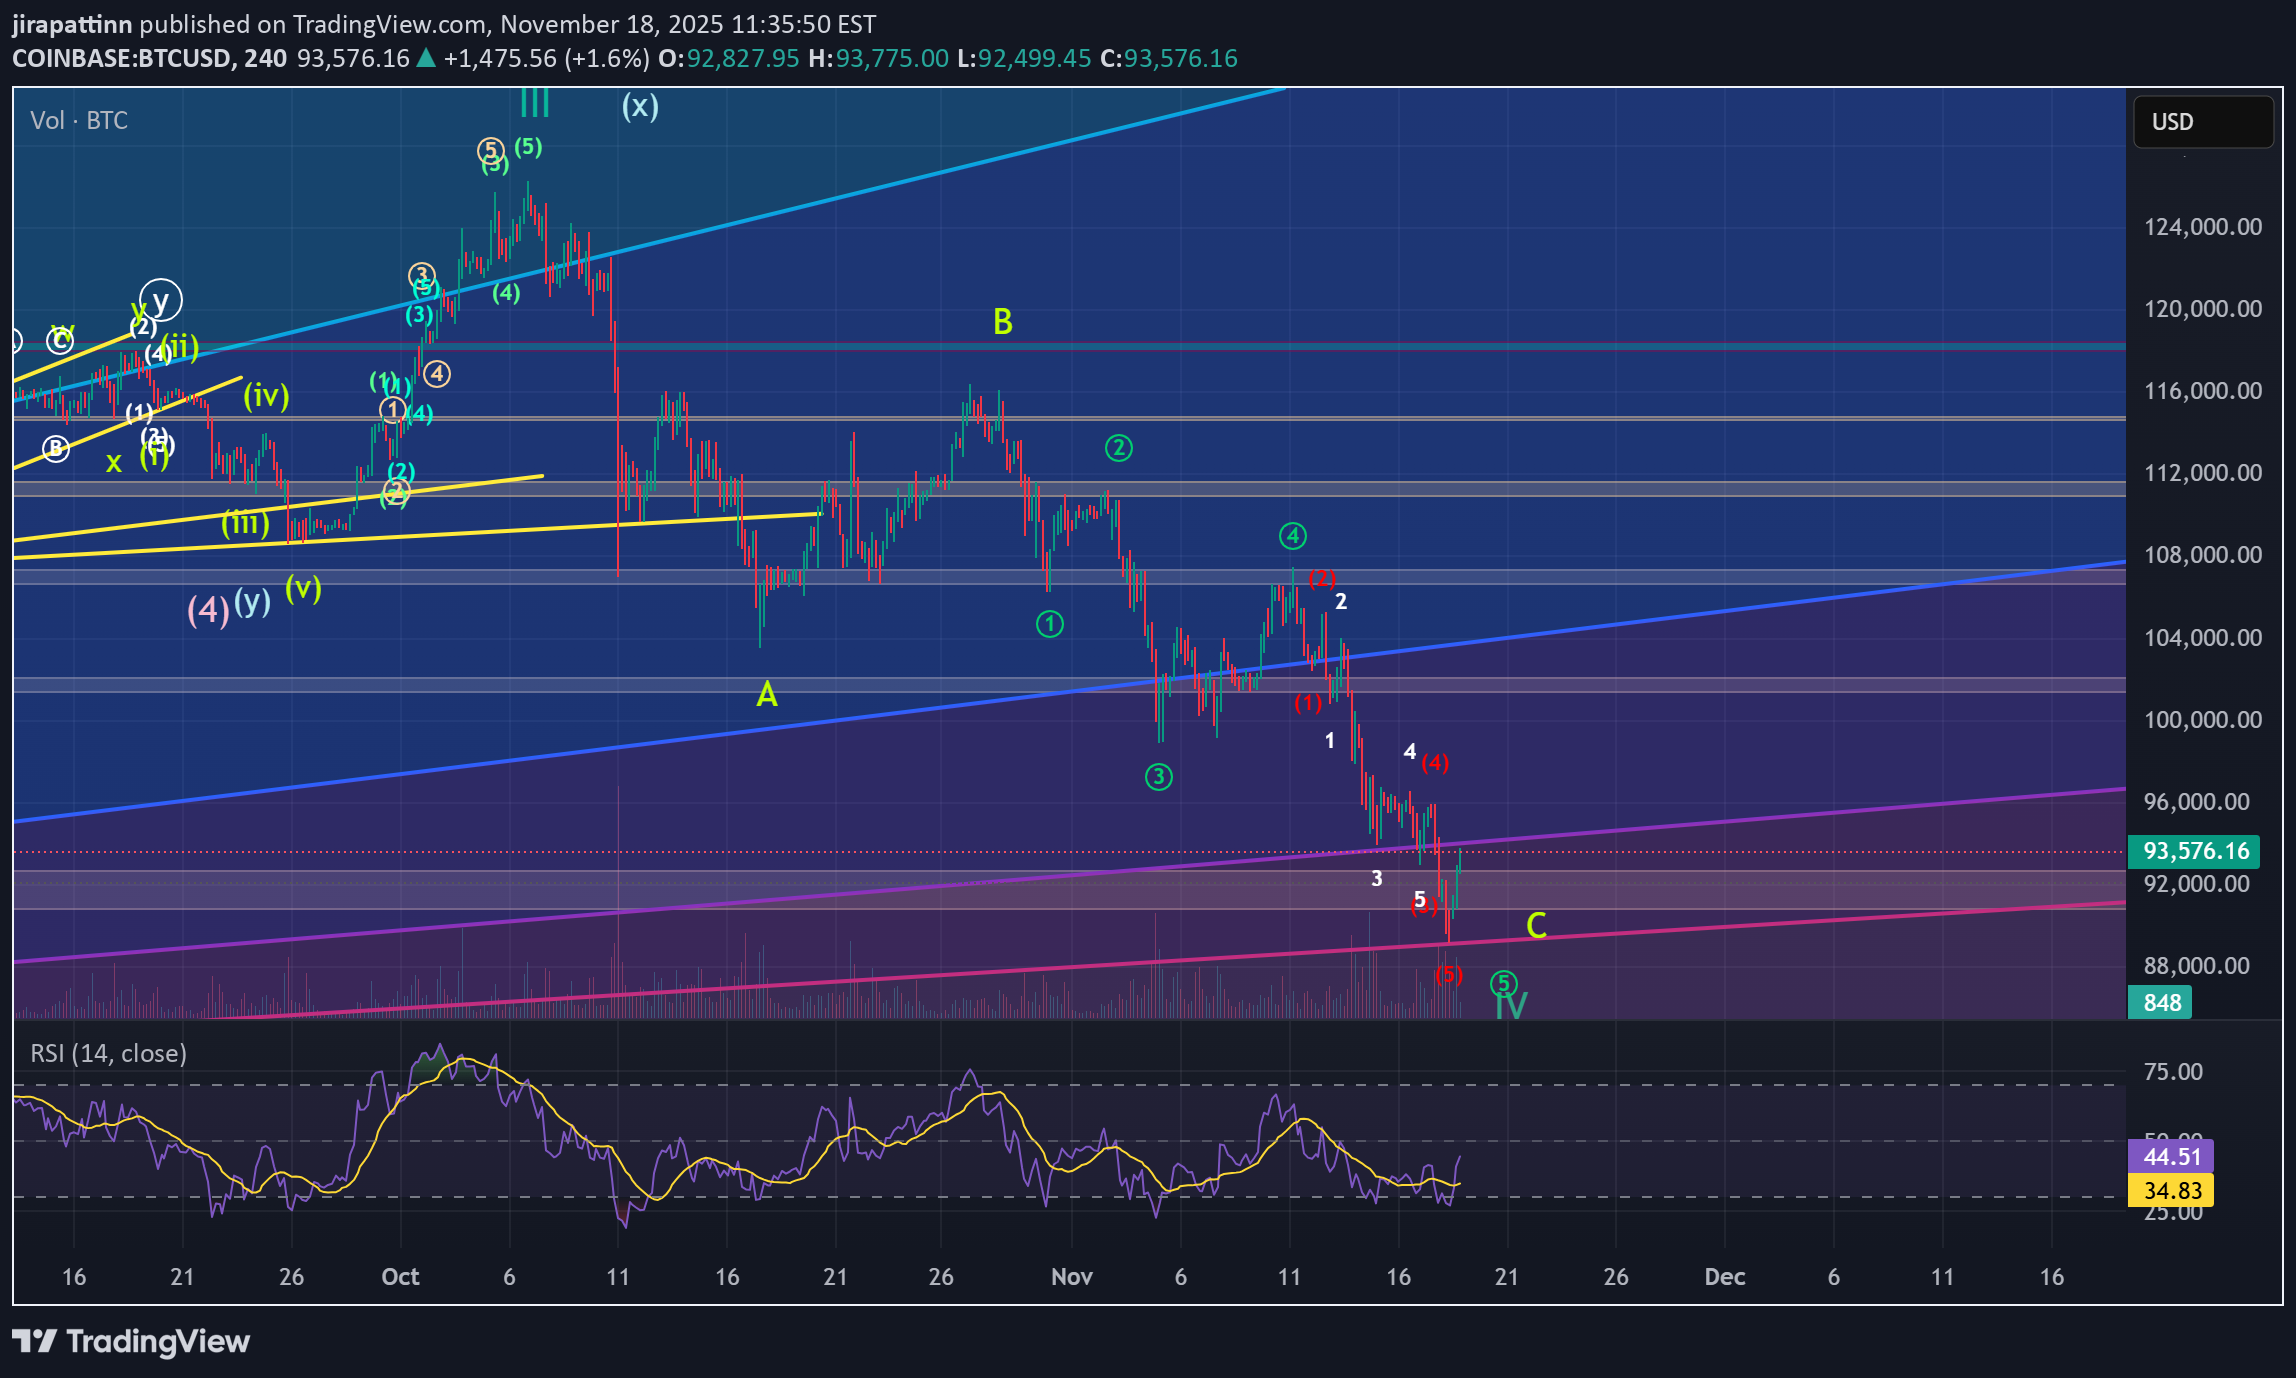
BTC Elliott wave analysis 9/16 /2025
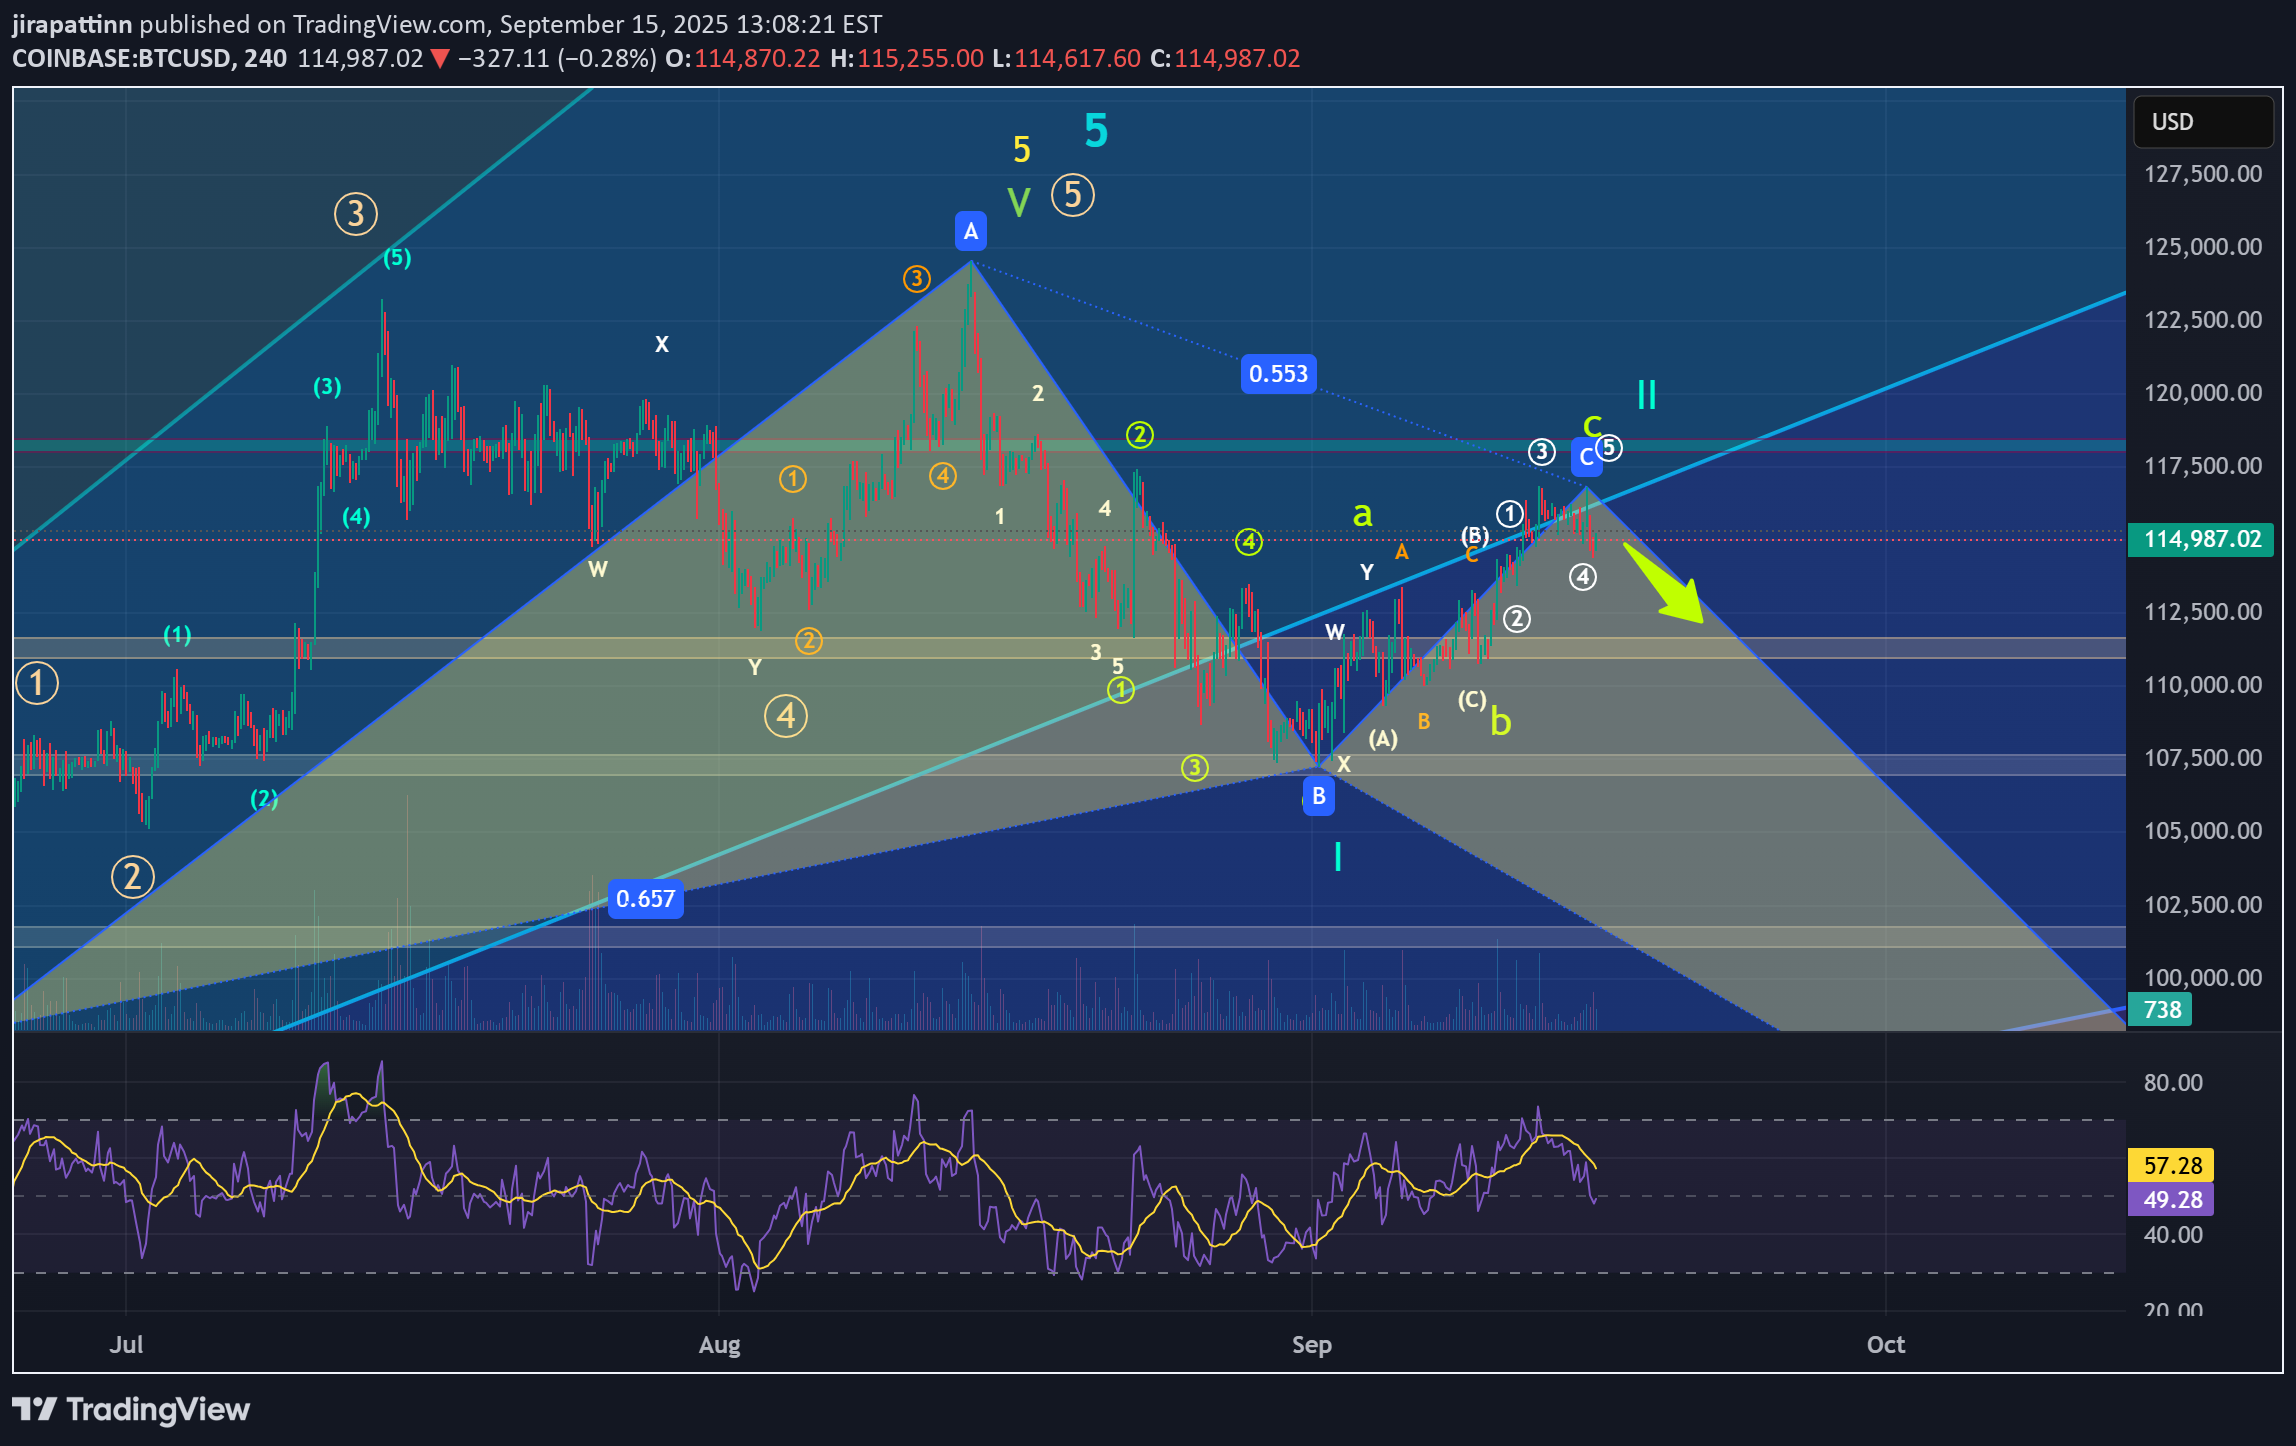
Is Bitcoin’s Cycle Ending, or Just Another Correction? BTC made a new all-time high last month, followed by significant selling pressure. This raises the question: Has the BTC cycle ended, or is this just another corrective wave before another push higher? In my view, BTC has already completed its cycle since the bear market ended in November 2022, based on the following factors: 1. Wave Structure Suggests Completion of Wave 5 From my primary scenario, the 5-wave cycle beginning after the November 2022 bear market is as follows: Cycle Wave I: Nov 21, 2022 – Apr 14, 2023 Cycle Wave II: Apr 14, 2023 – Sep 11, 2023 Cycle Wave III: Sep 11, 2023 – Jan 20, 2025 Cycle Wave IV: Jan 20, 2025 – Apr 9, 2025 Cycle Wave V: Apr 9, 2025 – Aug 14, 2025 Within Cycle Wave V, we can clearly see wave 1 and wave 3 of the initial impulse, followed by a correction (wave 4), and then a final 5-wave sequence. This last push shows signs of exhaustion: although wave ④ (part of wave 5) lasted nearly a month, the market struggled to achieve new highs. This behavior suggests that buying pressure is exhausted and Cycle Wave V may have ended. 2. Post-High Wave Structure The decline after BTC’s all-time high could be interpreted as the start of a new impulse down, or as part of a complex corrective structure such as WXY or WXYXZ. We need further confirmation, but one thing is clear: after the upward correction completes, another downward wave should follow, either to complete the correction or as wave 3 of a larger bearish impulse. Micro Analysis Based on my Elliott Wave count, it seems BTC has completed wave II or wave b. This is confirmed not only by Gann fan resistance, but also by the divergence on the abrupt wave 5 in the 4-hour chart, which was followed by a strong downward move. This implies BTC has already entered wave III, or has at least completed its correction. If this current impulse is indeed wave 3 of a larger downtrend, the target for wave V would be around $81,000, supported by a Crab harmonic pattern projection.
jirapattinn
The End of BTC correction? BTC analysis 2/8/2025
In my point of view, BTC has completed its correction and is now ready for a strong upward move, potentially targeting the $137,000–$139,000 range, based on the following factors: 1. Confirmation of the Butterfly Harmonic Pattern The recent reversal occurred within the expected range of the Butterfly harmonic pattern. Typically, the XD leg in a Butterfly harmonic extends to 1.27, but in practice, this can stretch up to 1.414, which is commonly used as a flexible stop-loss zone. After testing the 1.27–1.414 range, a clear 5-wave impulse followed—testing a key trendline and making an attempt to break above the recent high. This sequence, followed by a corrective move, suggests that the broader correction may be complete. 2. Complex WXYXZ Correction Structure In my previous analysis, I underestimated the duration and depth of the correction. The wave (4) (blue), which is part of the wave (iii), has taken considerable time—likely to allow wave (5) to extend sufficiently to break above the $130,000 level. This would support the assumption that wave (5) (purple) is the extended wave. The overall corrective structure appears highly complex, and can be counted as a W–X–Y–X–Z pattern, supported by the presence of multiple internal corrections within the wave components. 3. 0.618 Fibonacci Retracement of Wave (3) Wave (4) has now reached the 0.618 Fibonacci retracement level of wave (3), which is significant. Historically, BTC’s corrections rarely retrace beyond the 0.87 level. This deep retracement suggests wave (4) is likely complete—unless price were to fall below that threshold, which would invalidate this assumption.
jirapattinn
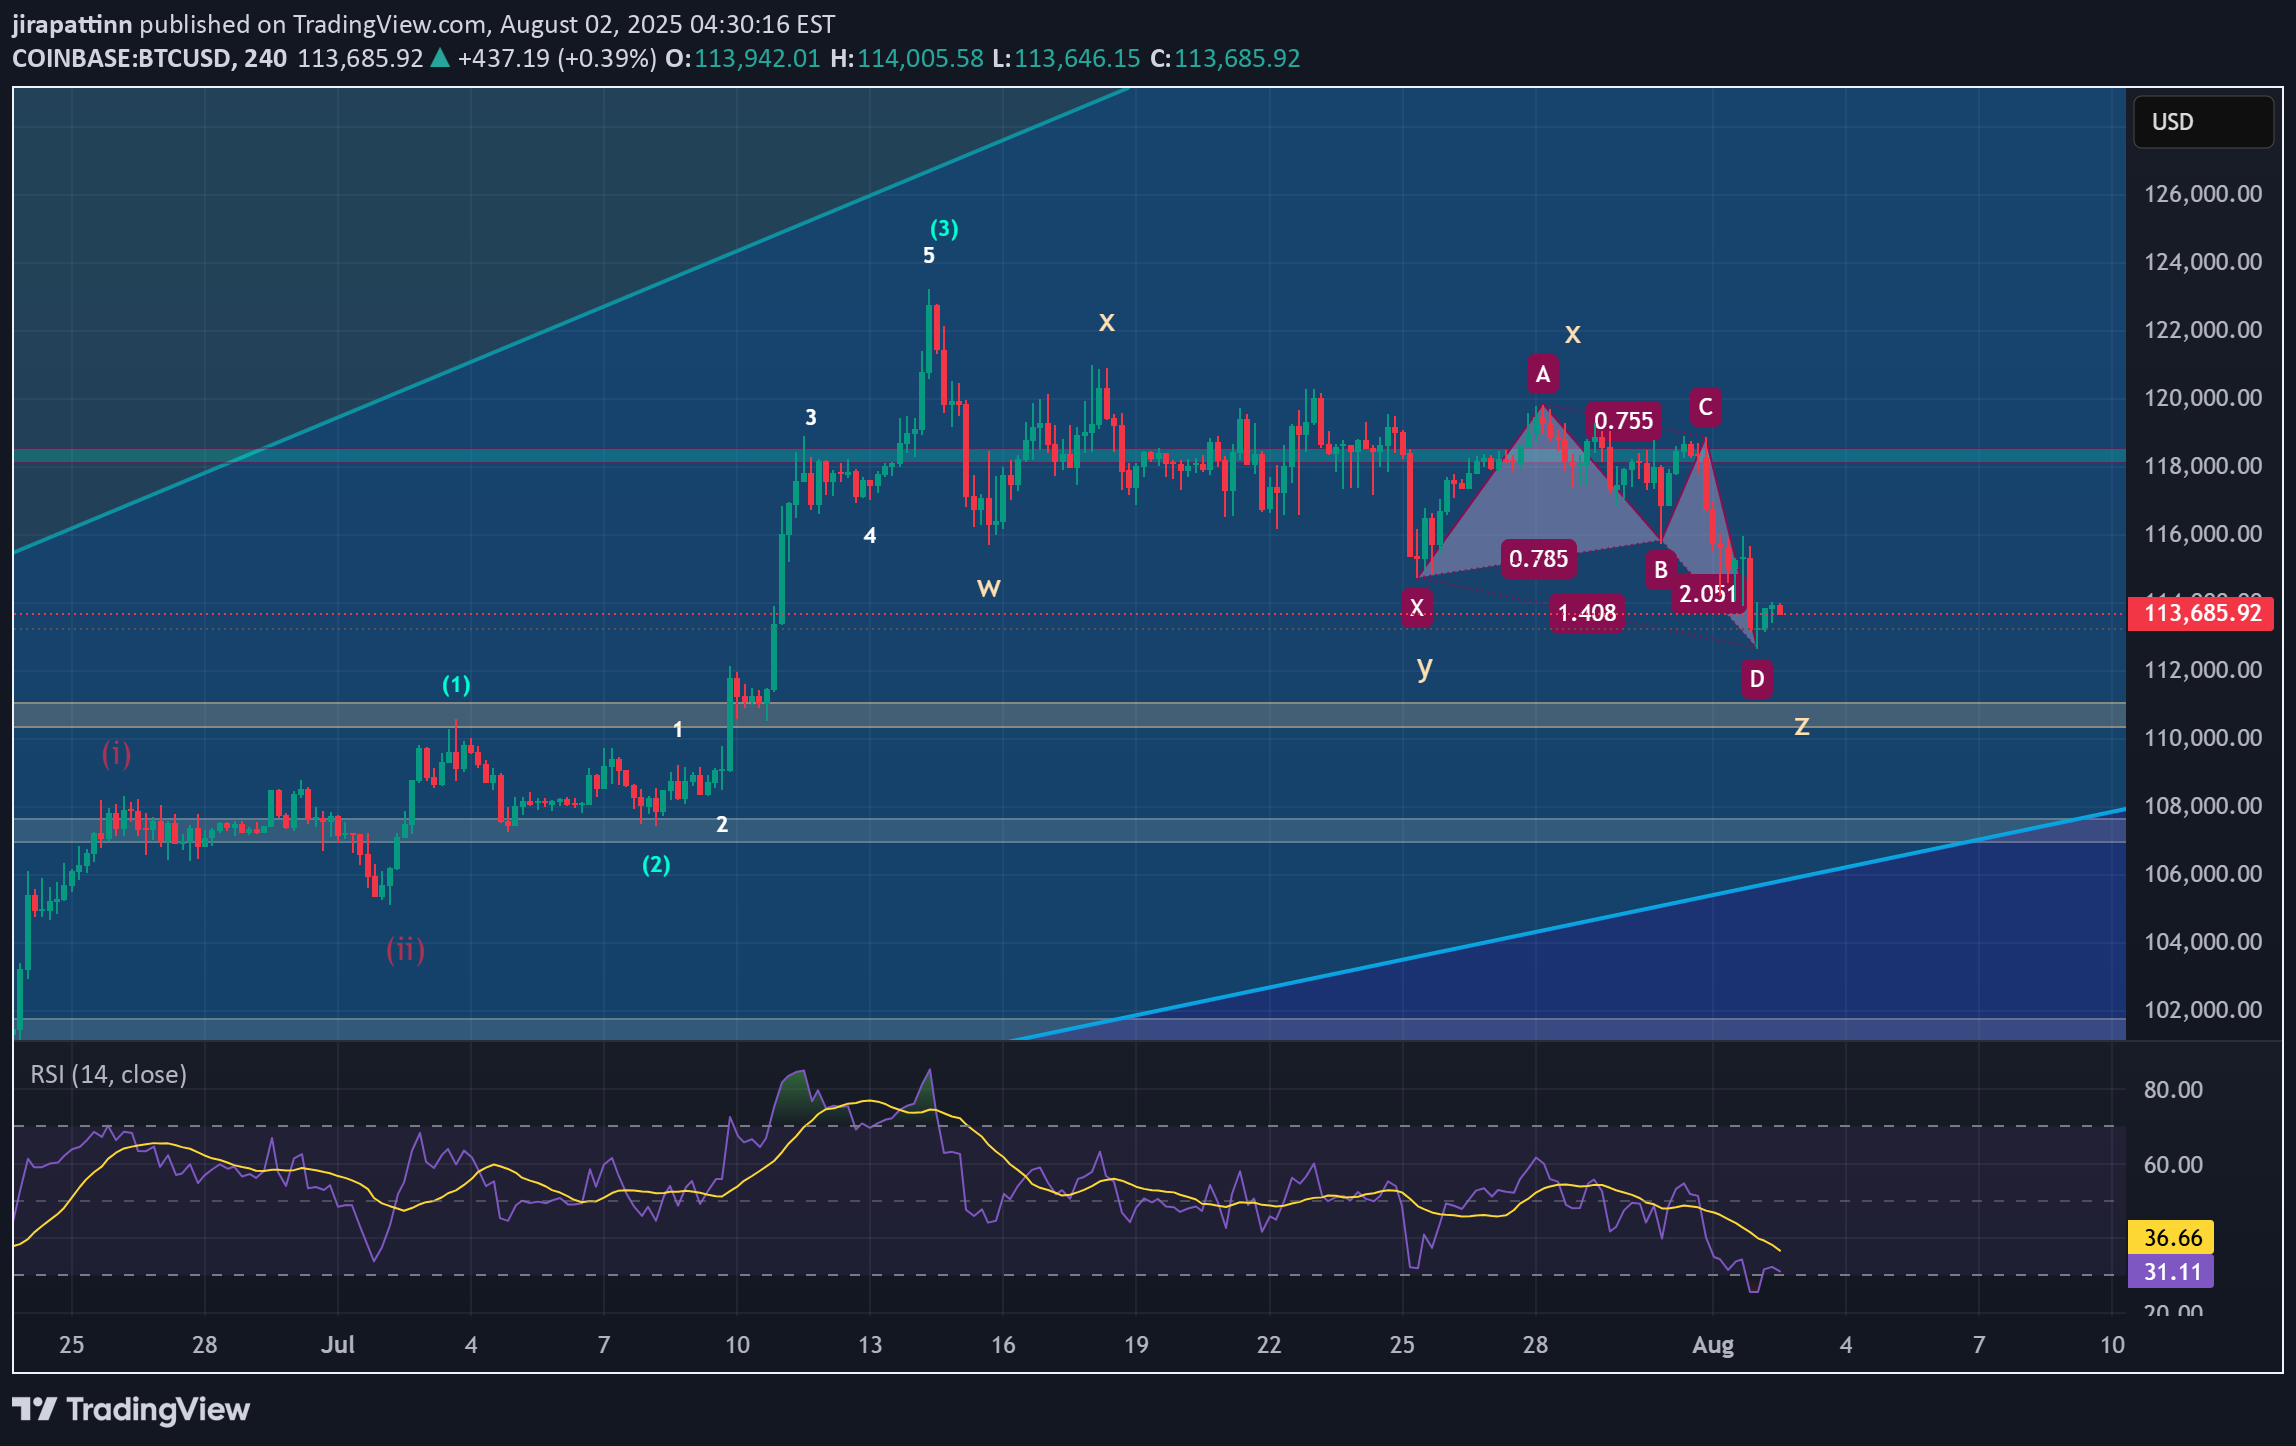
BTC Ready for the new impulse ? Elliott wave analysis 20/7/2025
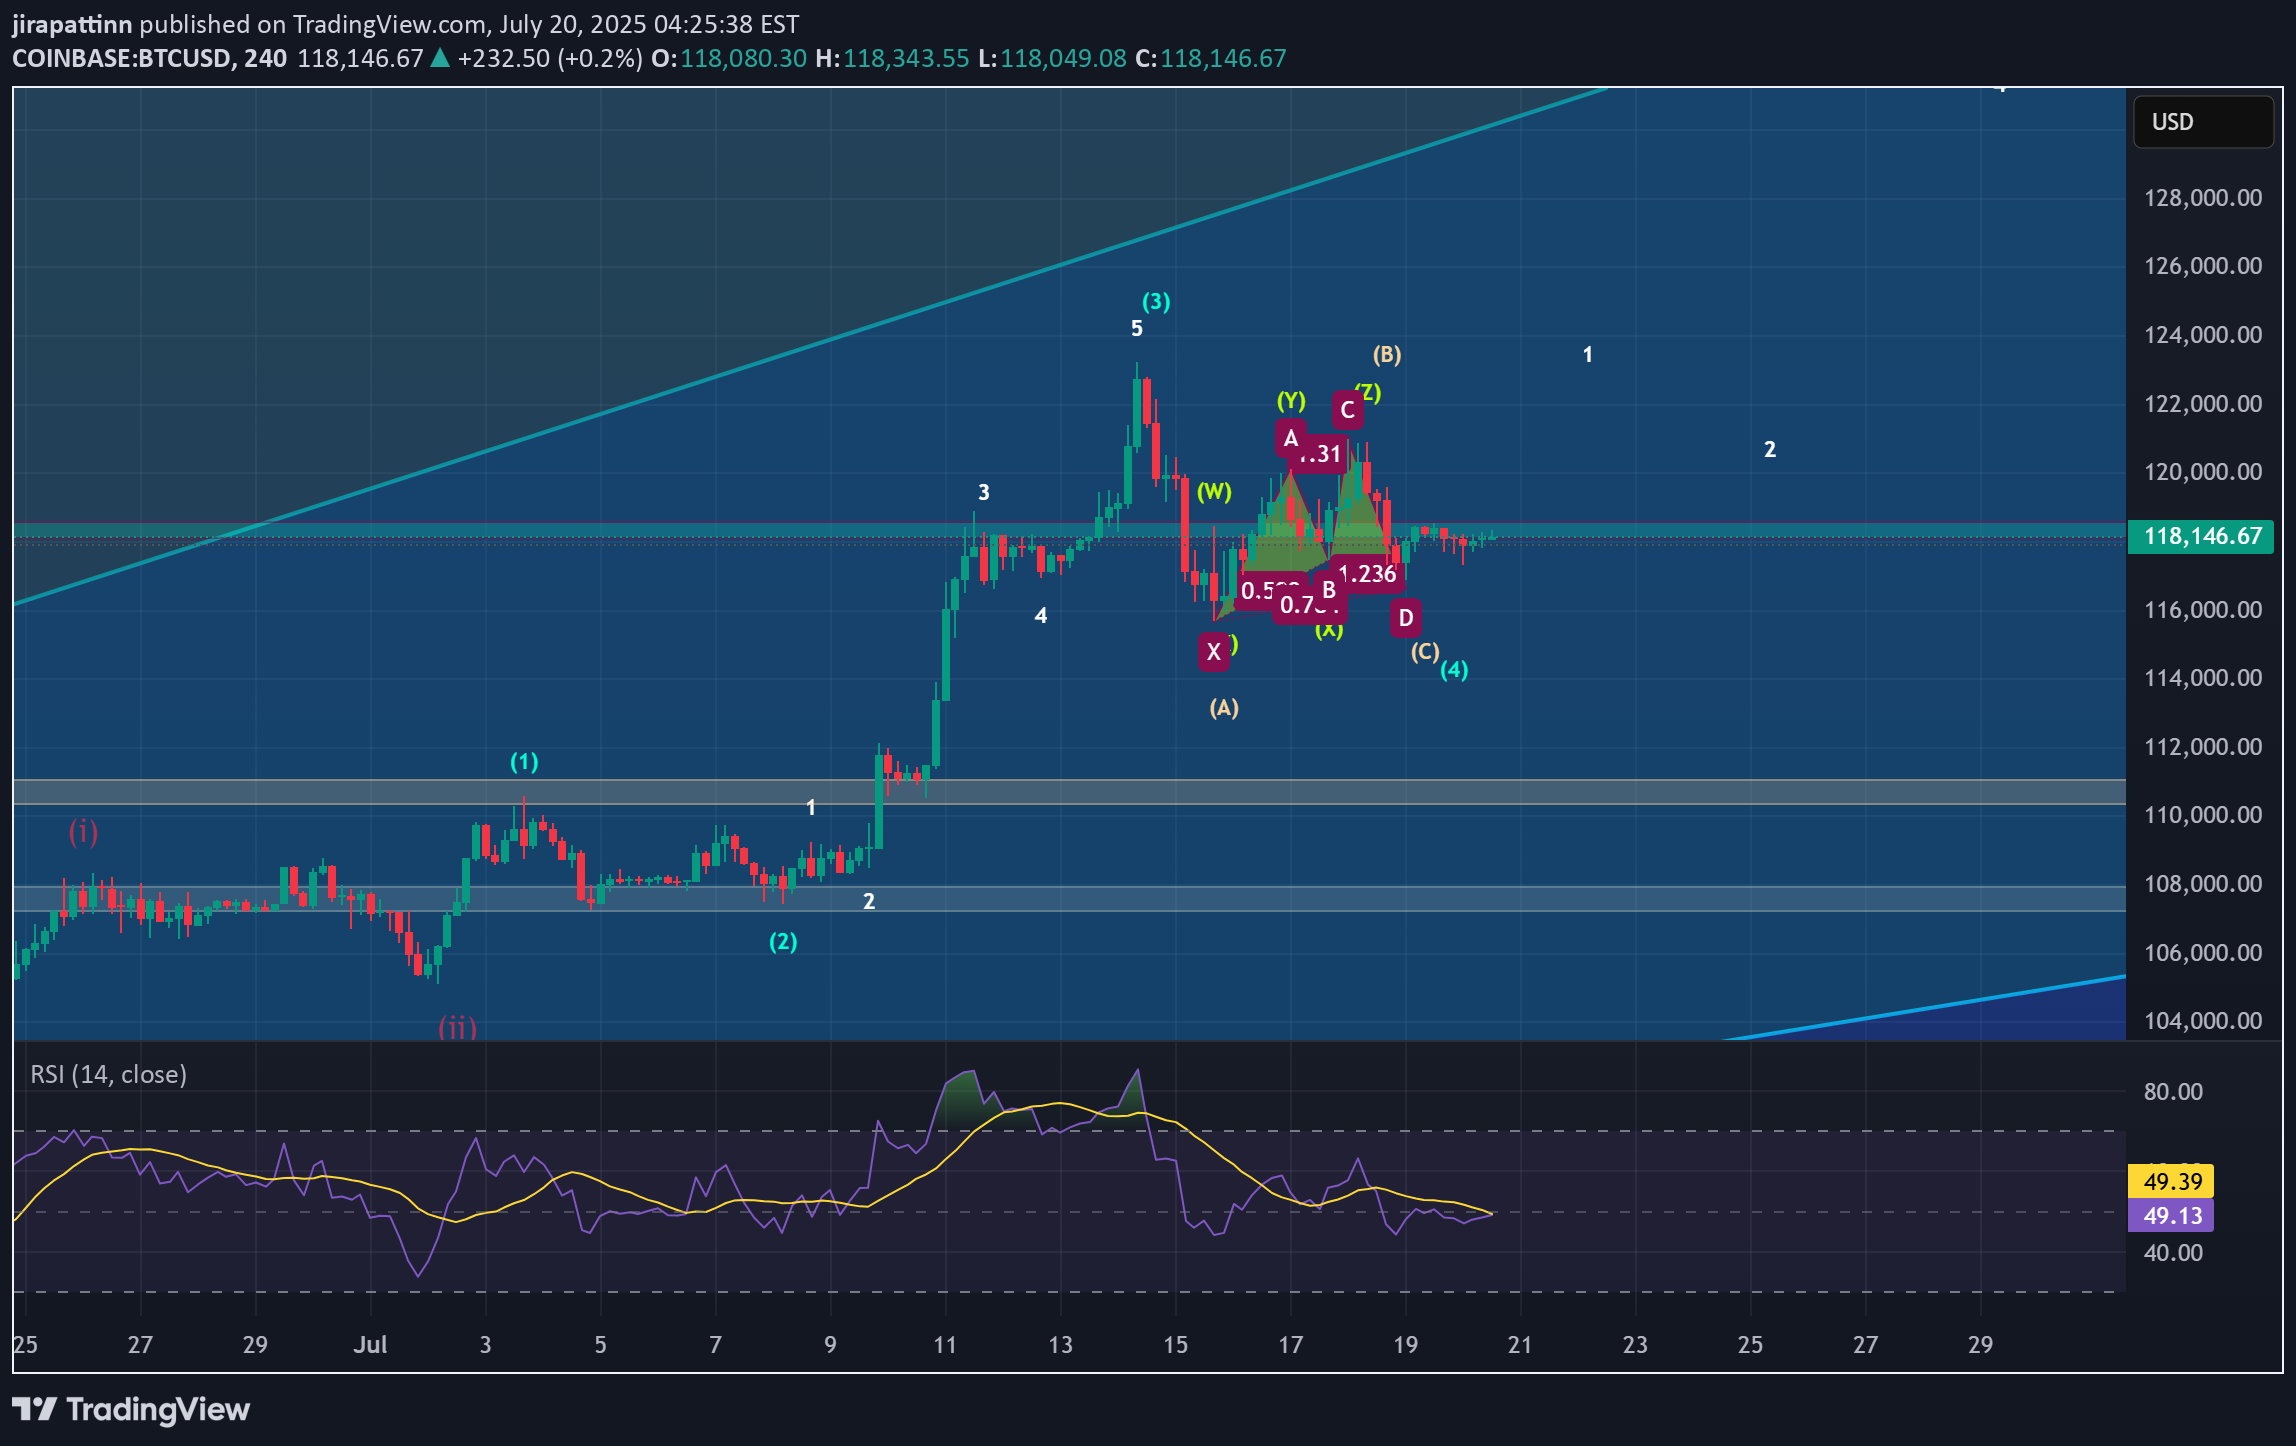
In my view, Bitcoin (BTC) has completed its micro correction and is now poised to move toward the $135,000–$139,000 target zone. This expectation is supported by the following factors: 1. Completion of the Sub-Waves in Wave (4) My analysis of wave (4) indicates that it consists of an ABC correction, where wave B formed a WXYXZ pattern. Additionally, I have counted the sub-waves within wave C of wave (4) and observed a complete 5-wave structure, suggesting that the fifth wave of wave C has ended, confirming the completion of wave (4). 2. Cypher Harmonic Pattern Pivot Point I have identified a Cypher harmonic pattern with a pivot point around $116,600. The termination of wave (4) occurred close to this pivot level, followed by a new impulsive move that made a higher high and formed a clear 5-wave structure—further confirming that wave (4) has likely ended. 3. Hidden Bullish Divergence on the 4-Hour Timeframe A hidden bullish divergence can be observed on the 4-hour chart, particularly at the end of wave (a) and wave (c). Historically, 4-hour hidden bullish divergences have often preceded strong bullish impulses. For instance, a similar setup occurred during the bullish rally from April 9, 2025, to May 22, 2025. 4. Failure to Make a New Low After Resistance Retest The new impulse wave that emerged after the end of wave (4) has met resistance but failed to make a new low, suggesting that a fresh upward impulse is underway. How Far Could Wave (5) Extend? It is important to note that the wave (5) (blue) impulse is a sub-wave of wave (5) (purple). The lengths of wave (3) (purple) and wave (5) (purple) are currently similar, which is unlikely because both are part of the major wave V (green), where typically only one wave should extend. Since wave (3) has already completed, wave (5) is likely to be the extended wave, with a target length between 1.272 and 1.618 times the length of wave (3). Interestingly, two Gann fan projections point to resistance levels in the $135,000–$139,000 range, which perfectly aligns with this 1.272–1.618 extension zone. Invalidation Point The invalidation level is around $117,000, as the micro correction within the new impulse should not drop this low. If BTC falls below $117,000, it could imply that wave (4) has not yet completed and may be taking another corrective form. For example, the wave (c) we currently see might only be wave 1 of a larger wave (c), or the correction in wave (b) may still be ongoing. However, this scenario seems unlikely given the weight of evidence suggesting that wave (4) has already ended.
Disclaimer
Any content and materials included in Sahmeto's website and official communication channels are a compilation of personal opinions and analyses and are not binding. They do not constitute any recommendation for buying, selling, entering or exiting the stock market and cryptocurrency market. Also, all news and analyses included in the website and channels are merely republished information from official and unofficial domestic and foreign sources, and it is obvious that users of the said content are responsible for following up and ensuring the authenticity and accuracy of the materials. Therefore, while disclaiming responsibility, it is declared that the responsibility for any decision-making, action, and potential profit and loss in the capital market and cryptocurrency market lies with the trader.