Technical analysis by jirapattinn about Symbol BTC: Buy recommendation (7/20/2025)

BTC Ready for the new impulse ? Elliott wave analysis 20/7/2025
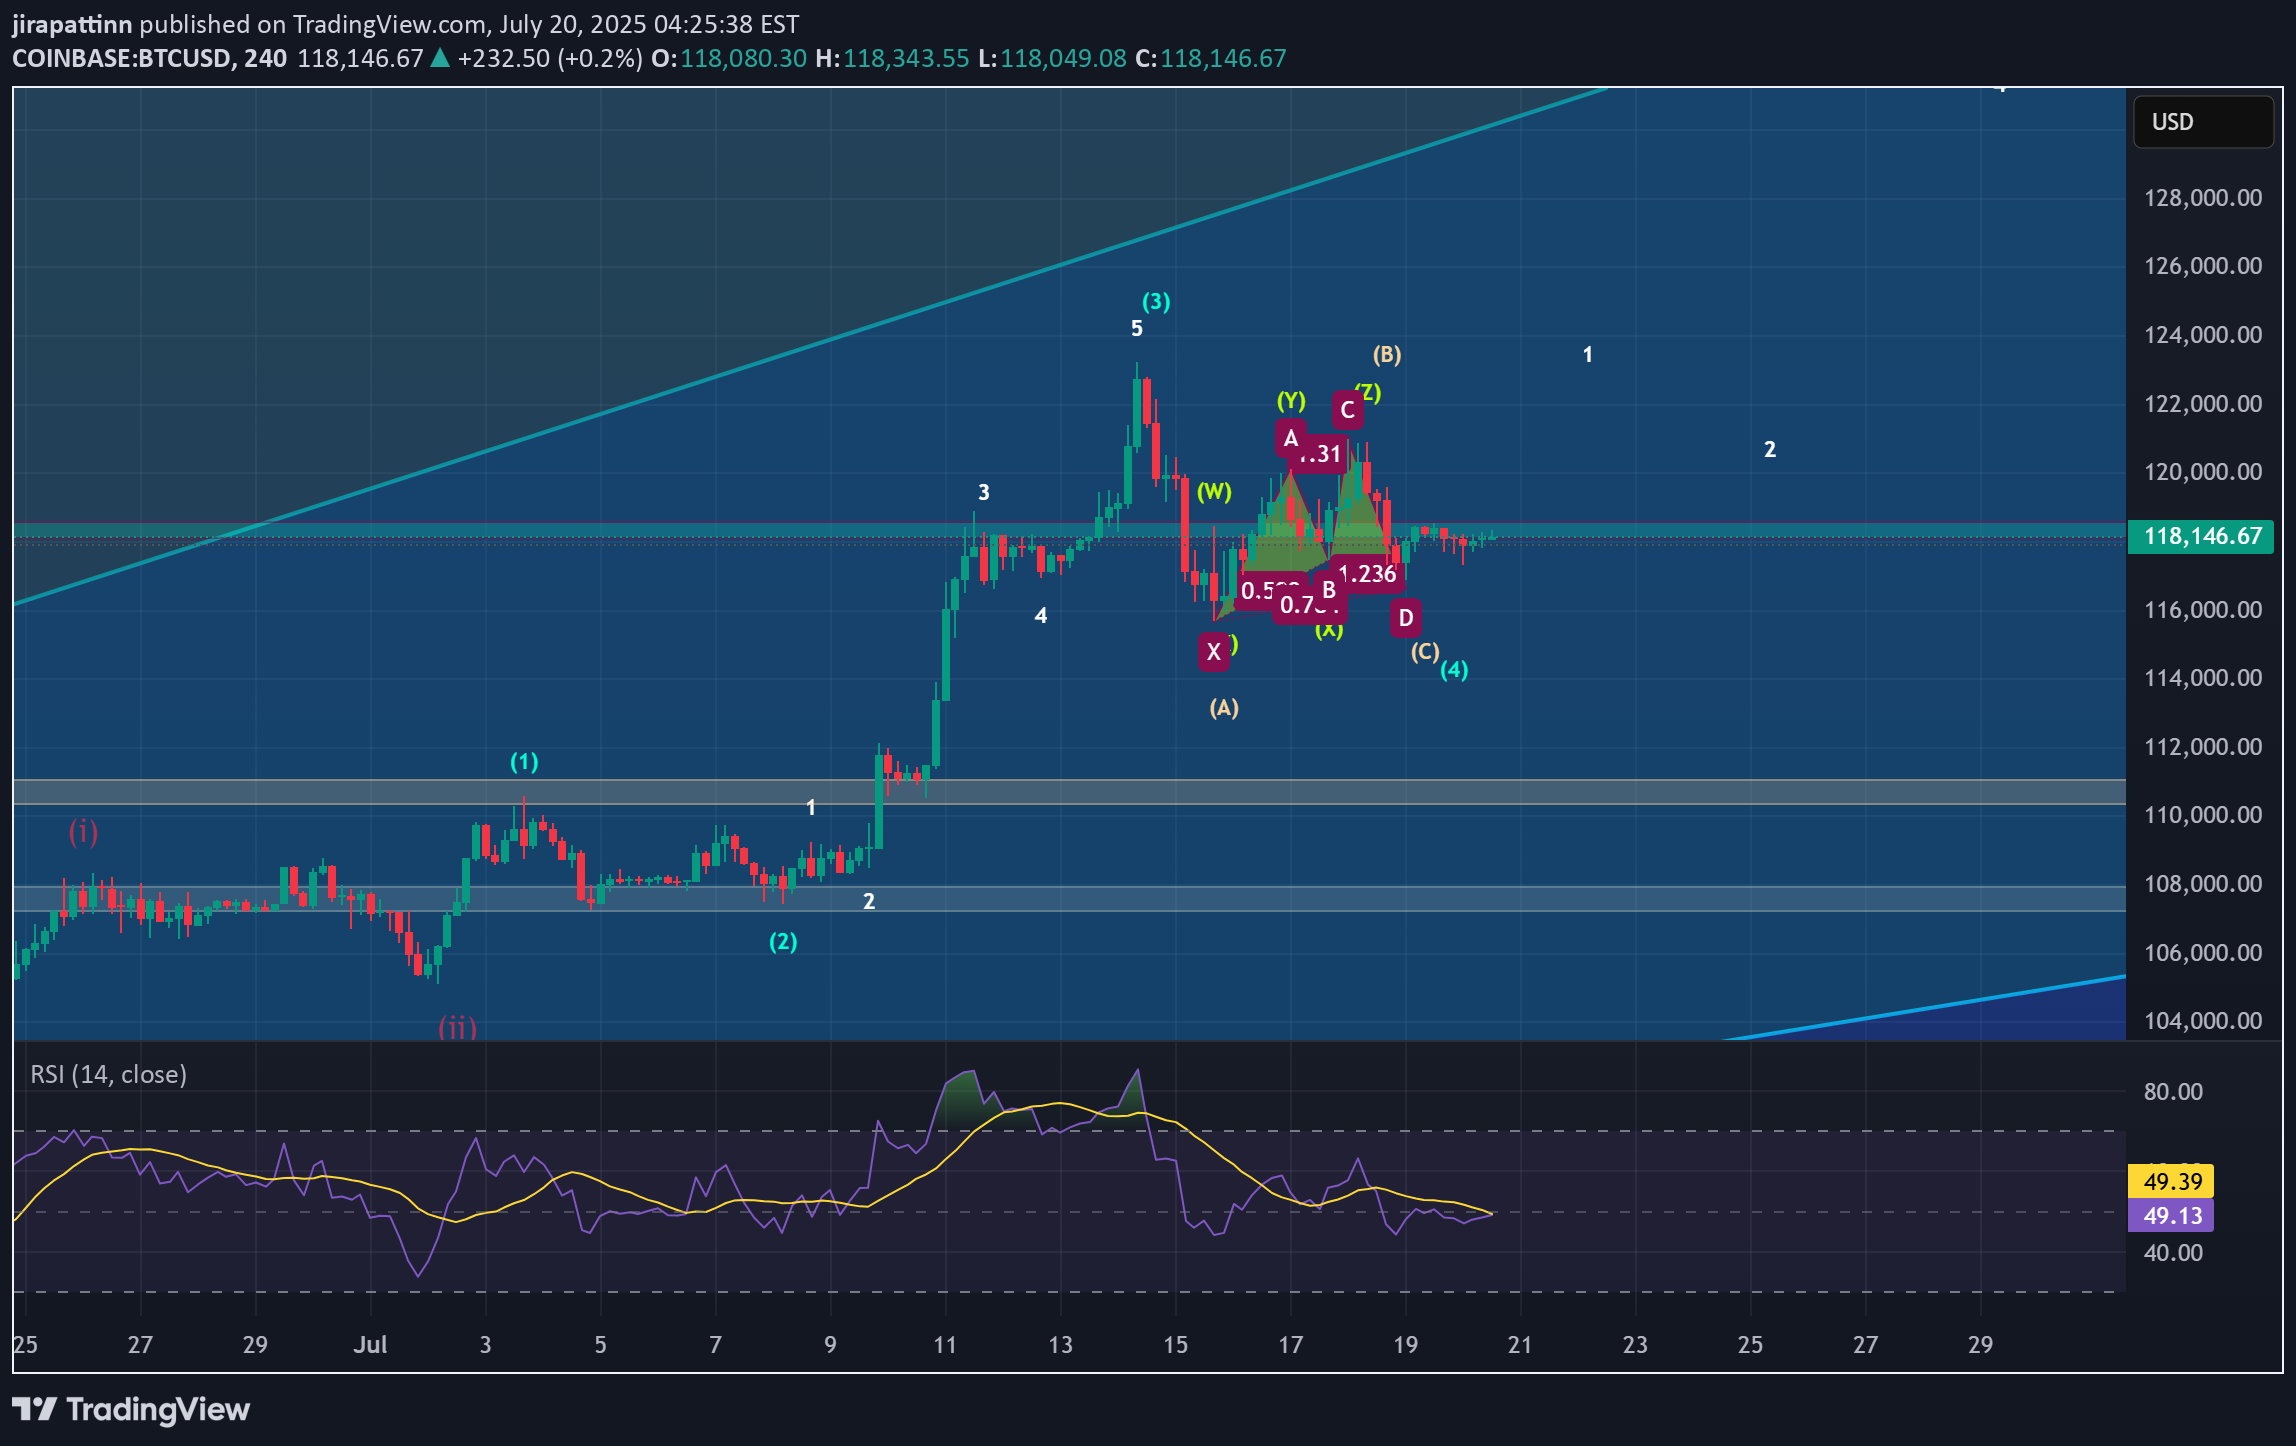
In my view, Bitcoin (BTC) has completed its micro correction and is now poised to move toward the $135,000–$139,000 target zone. This expectation is supported by the following factors: 1. Completion of the Sub-Waves in Wave (4) My analysis of wave (4) indicates that it consists of an ABC correction, where wave B formed a WXYXZ pattern. Additionally, I have counted the sub-waves within wave C of wave (4) and observed a complete 5-wave structure, suggesting that the fifth wave of wave C has ended, confirming the completion of wave (4). 2. Cypher Harmonic Pattern Pivot Point I have identified a Cypher harmonic pattern with a pivot point around $116,600. The termination of wave (4) occurred close to this pivot level, followed by a new impulsive move that made a higher high and formed a clear 5-wave structure—further confirming that wave (4) has likely ended. 3. Hidden Bullish Divergence on the 4-Hour Timeframe A hidden bullish divergence can be observed on the 4-hour chart, particularly at the end of wave (a) and wave (c). Historically, 4-hour hidden bullish divergences have often preceded strong bullish impulses. For instance, a similar setup occurred during the bullish rally from April 9, 2025, to May 22, 2025. 4. Failure to Make a New Low After Resistance Retest The new impulse wave that emerged after the end of wave (4) has met resistance but failed to make a new low, suggesting that a fresh upward impulse is underway. How Far Could Wave (5) Extend? It is important to note that the wave (5) (blue) impulse is a sub-wave of wave (5) (purple). The lengths of wave (3) (purple) and wave (5) (purple) are currently similar, which is unlikely because both are part of the major wave V (green), where typically only one wave should extend. Since wave (3) has already completed, wave (5) is likely to be the extended wave, with a target length between 1.272 and 1.618 times the length of wave (3). Interestingly, two Gann fan projections point to resistance levels in the $135,000–$139,000 range, which perfectly aligns with this 1.272–1.618 extension zone. Invalidation Point The invalidation level is around $117,000, as the micro correction within the new impulse should not drop this low. If BTC falls below $117,000, it could imply that wave (4) has not yet completed and may be taking another corrective form. For example, the wave (c) we currently see might only be wave 1 of a larger wave (c), or the correction in wave (b) may still be ongoing. However, this scenario seems unlikely given the weight of evidence suggesting that wave (4) has already ended.