
Momonoo
@t_Momonoo

What symbols does the trader recommend buying?
Purchase History
پیام های تریدر
Filter
ETH Downtrend Accelerates, Rallies Favoured for Short Setups
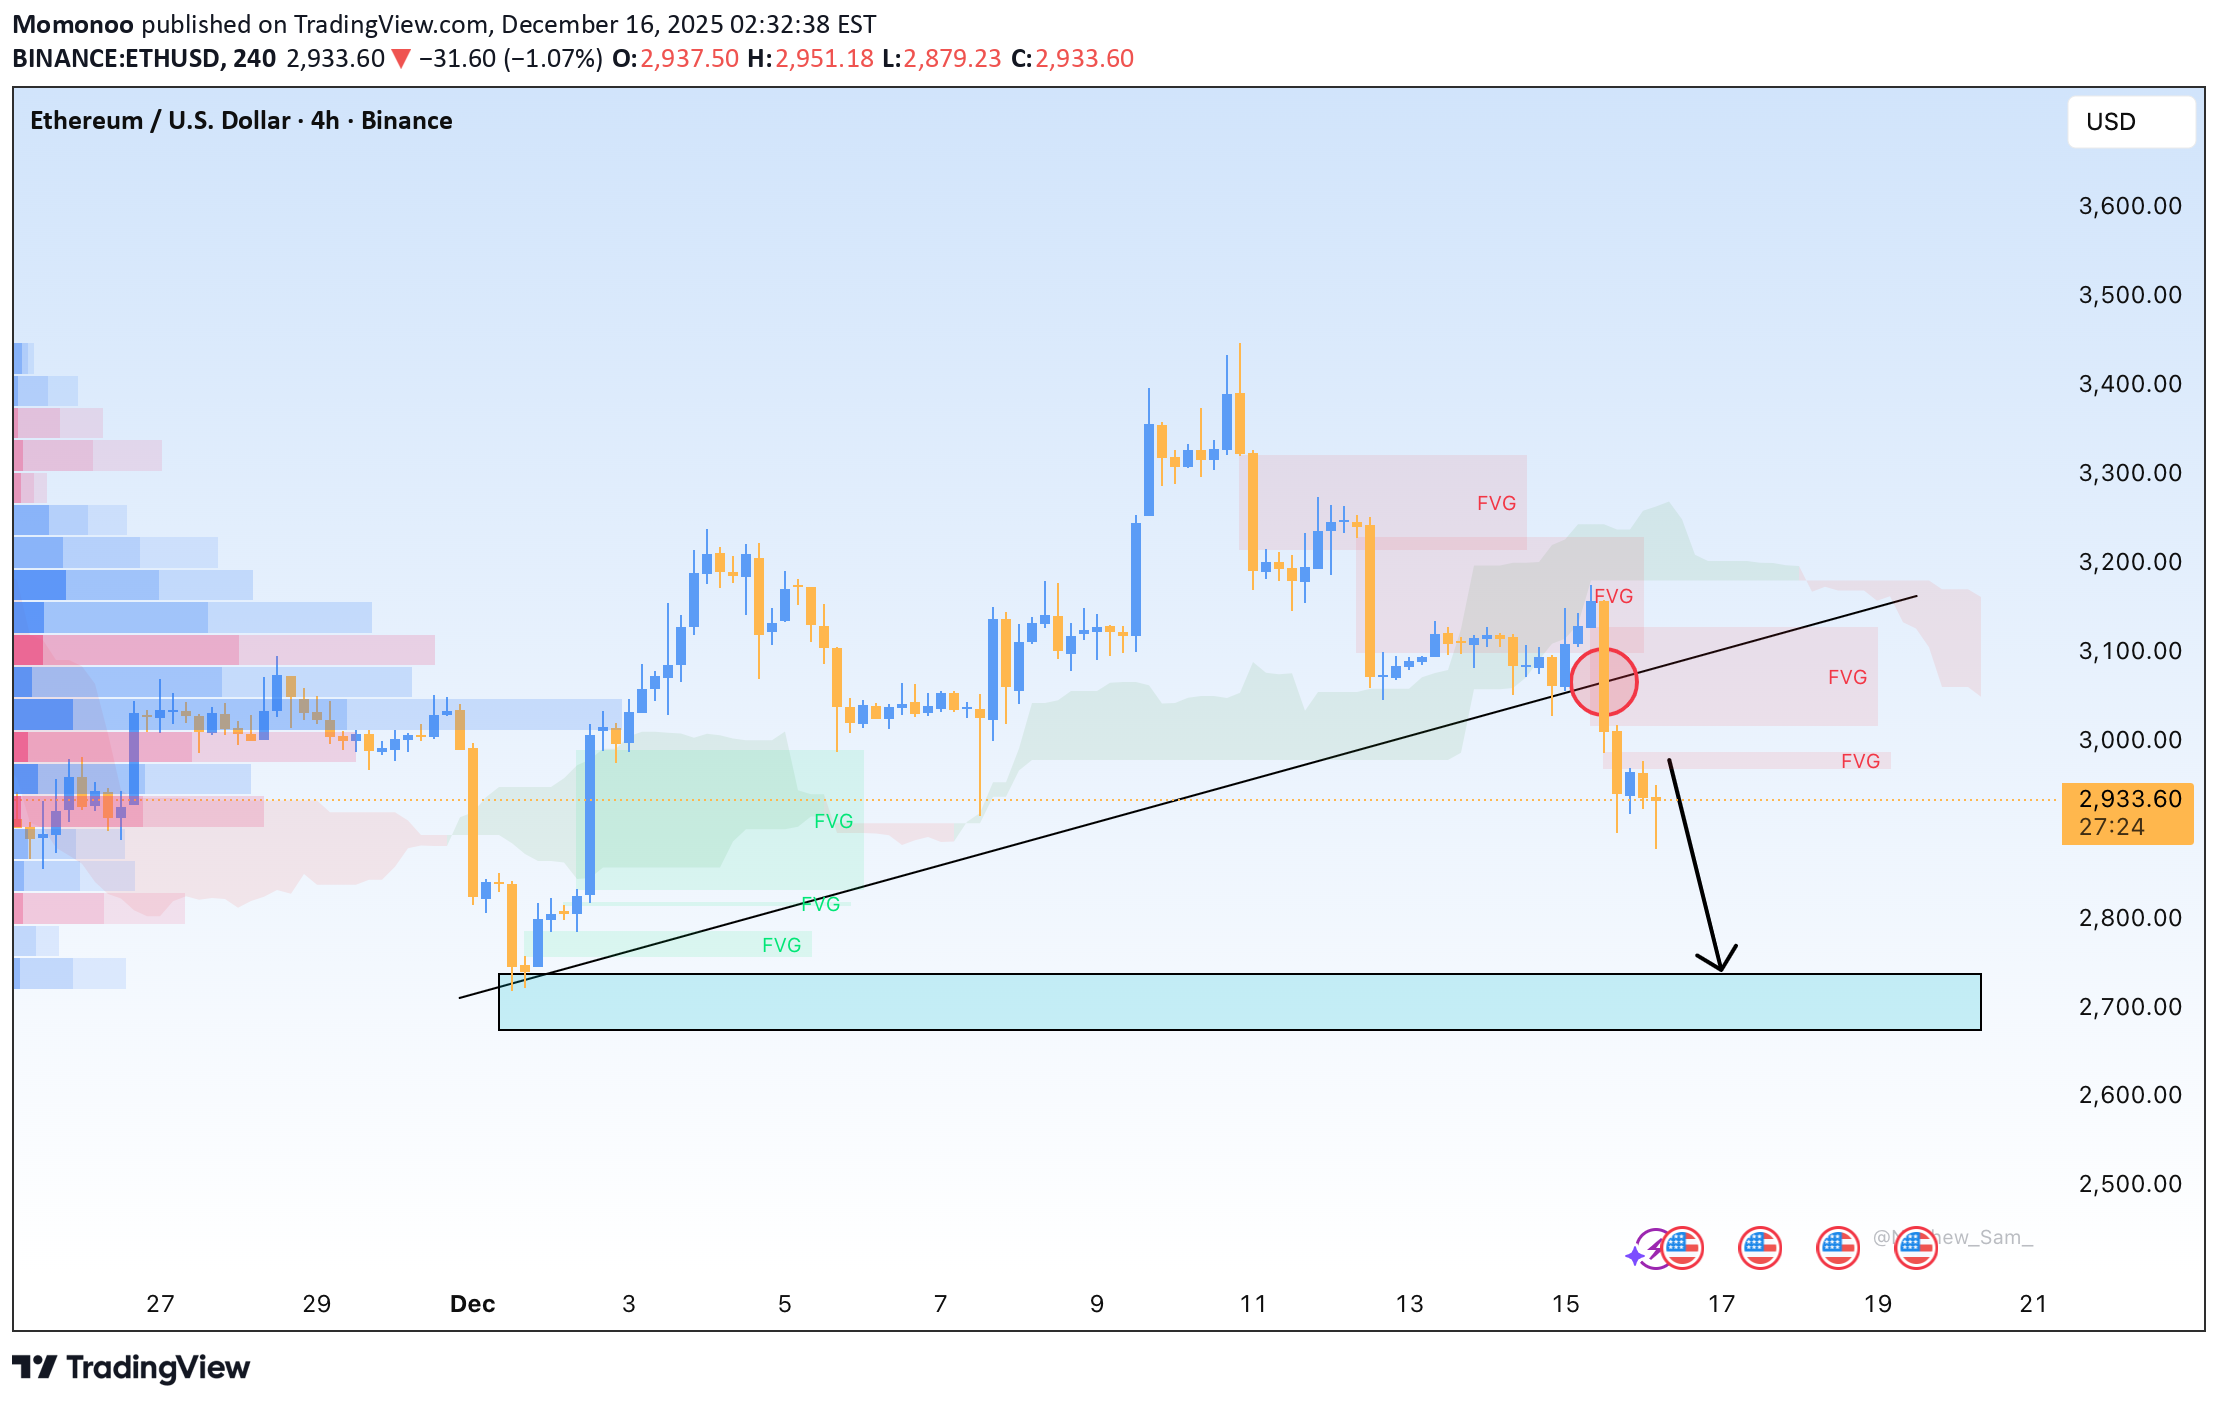
On the H4 chart, ETH has decisively broken below the 3,050–3,100 support zone and sold off aggressively under 2,950 with a long-bodied bearish candle, highlighting active selling pressure and an expanding downtrend. Following this drop, a fresh Fair Value Gap has formed around 2,980–3,020, extending a sequence of bearish FVGs — a typical signature of a market losing liquidity to the downside. The key supply zone is now located between 3,080 and 3,150, where several technical elements align: the FVG, the lower boundary of the Ichimoku cloud, and a dense volume cluster. This confluence suggests a high probability of renewed selling interest should price stage a technical rebound into this area. The preferred scenario is for ETH to retrace toward the 3,080–3,150 zone before resuming its decline, with an initial target at 2,880–2,900. If this level gives way, downside momentum could extend further toward 2,750–2,800. The bearish structure would only be invalidated by a clear H4 close above 3,200 accompanied by strong volume; until then, any rebound is viewed as a selling opportunity in line with the prevailing trend.
Gold Pulls Back from 4,350 as Uptrend Remains Intact
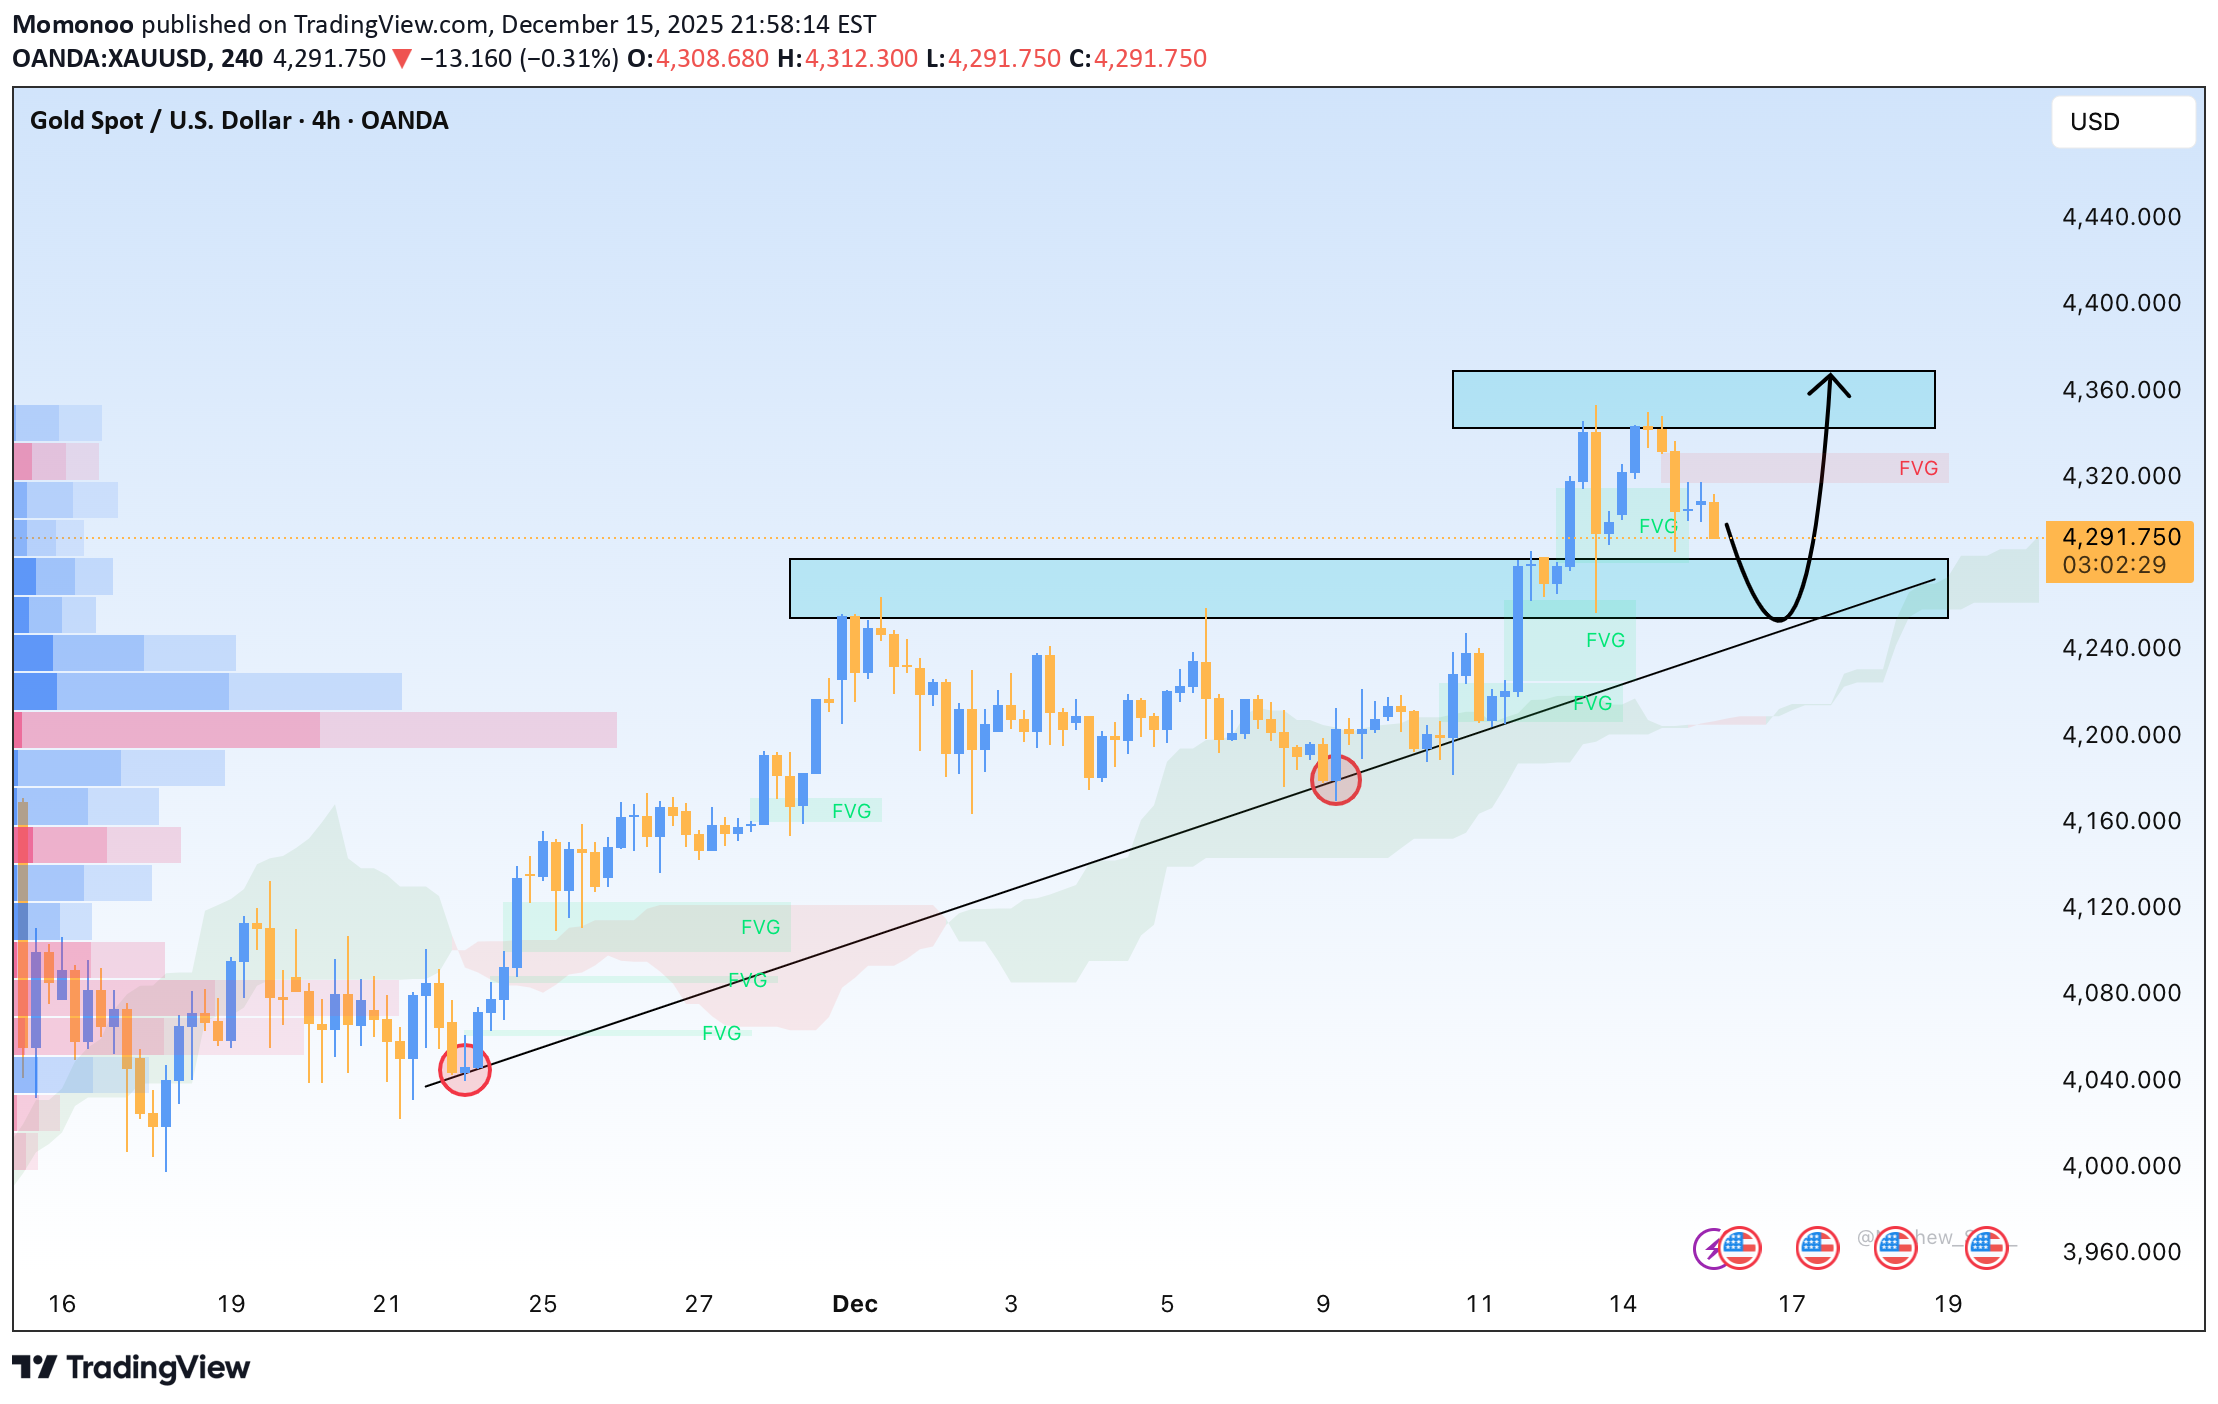
After reaching a peak at 4,350 USD per ounce, gold quickly corrected to the 4,306 area. This decline appears to be technical in nature, occurring precisely within the Fair Value Gap (FVG) zone and near short-term resistance, without any clear signal of a trend reversal. From a broader perspective, profit-taking pressure emerged following an extended bullish run, while market sentiment shifted modestly toward a risk-on stance amid positive signals from Russia–Ukraine negotiations. Although a weaker DXY and falling US Treasury yields around 4.18% typically provide support for gold, short-term profit-taking temporarily dominated price action. At the same time, crude oil prices slipping to around 56.5 USD per barrel eased inflation expectations to some extent, slowing capital inflows into gold in the near term.
ETHUSDT Enters a Consolidation Phase
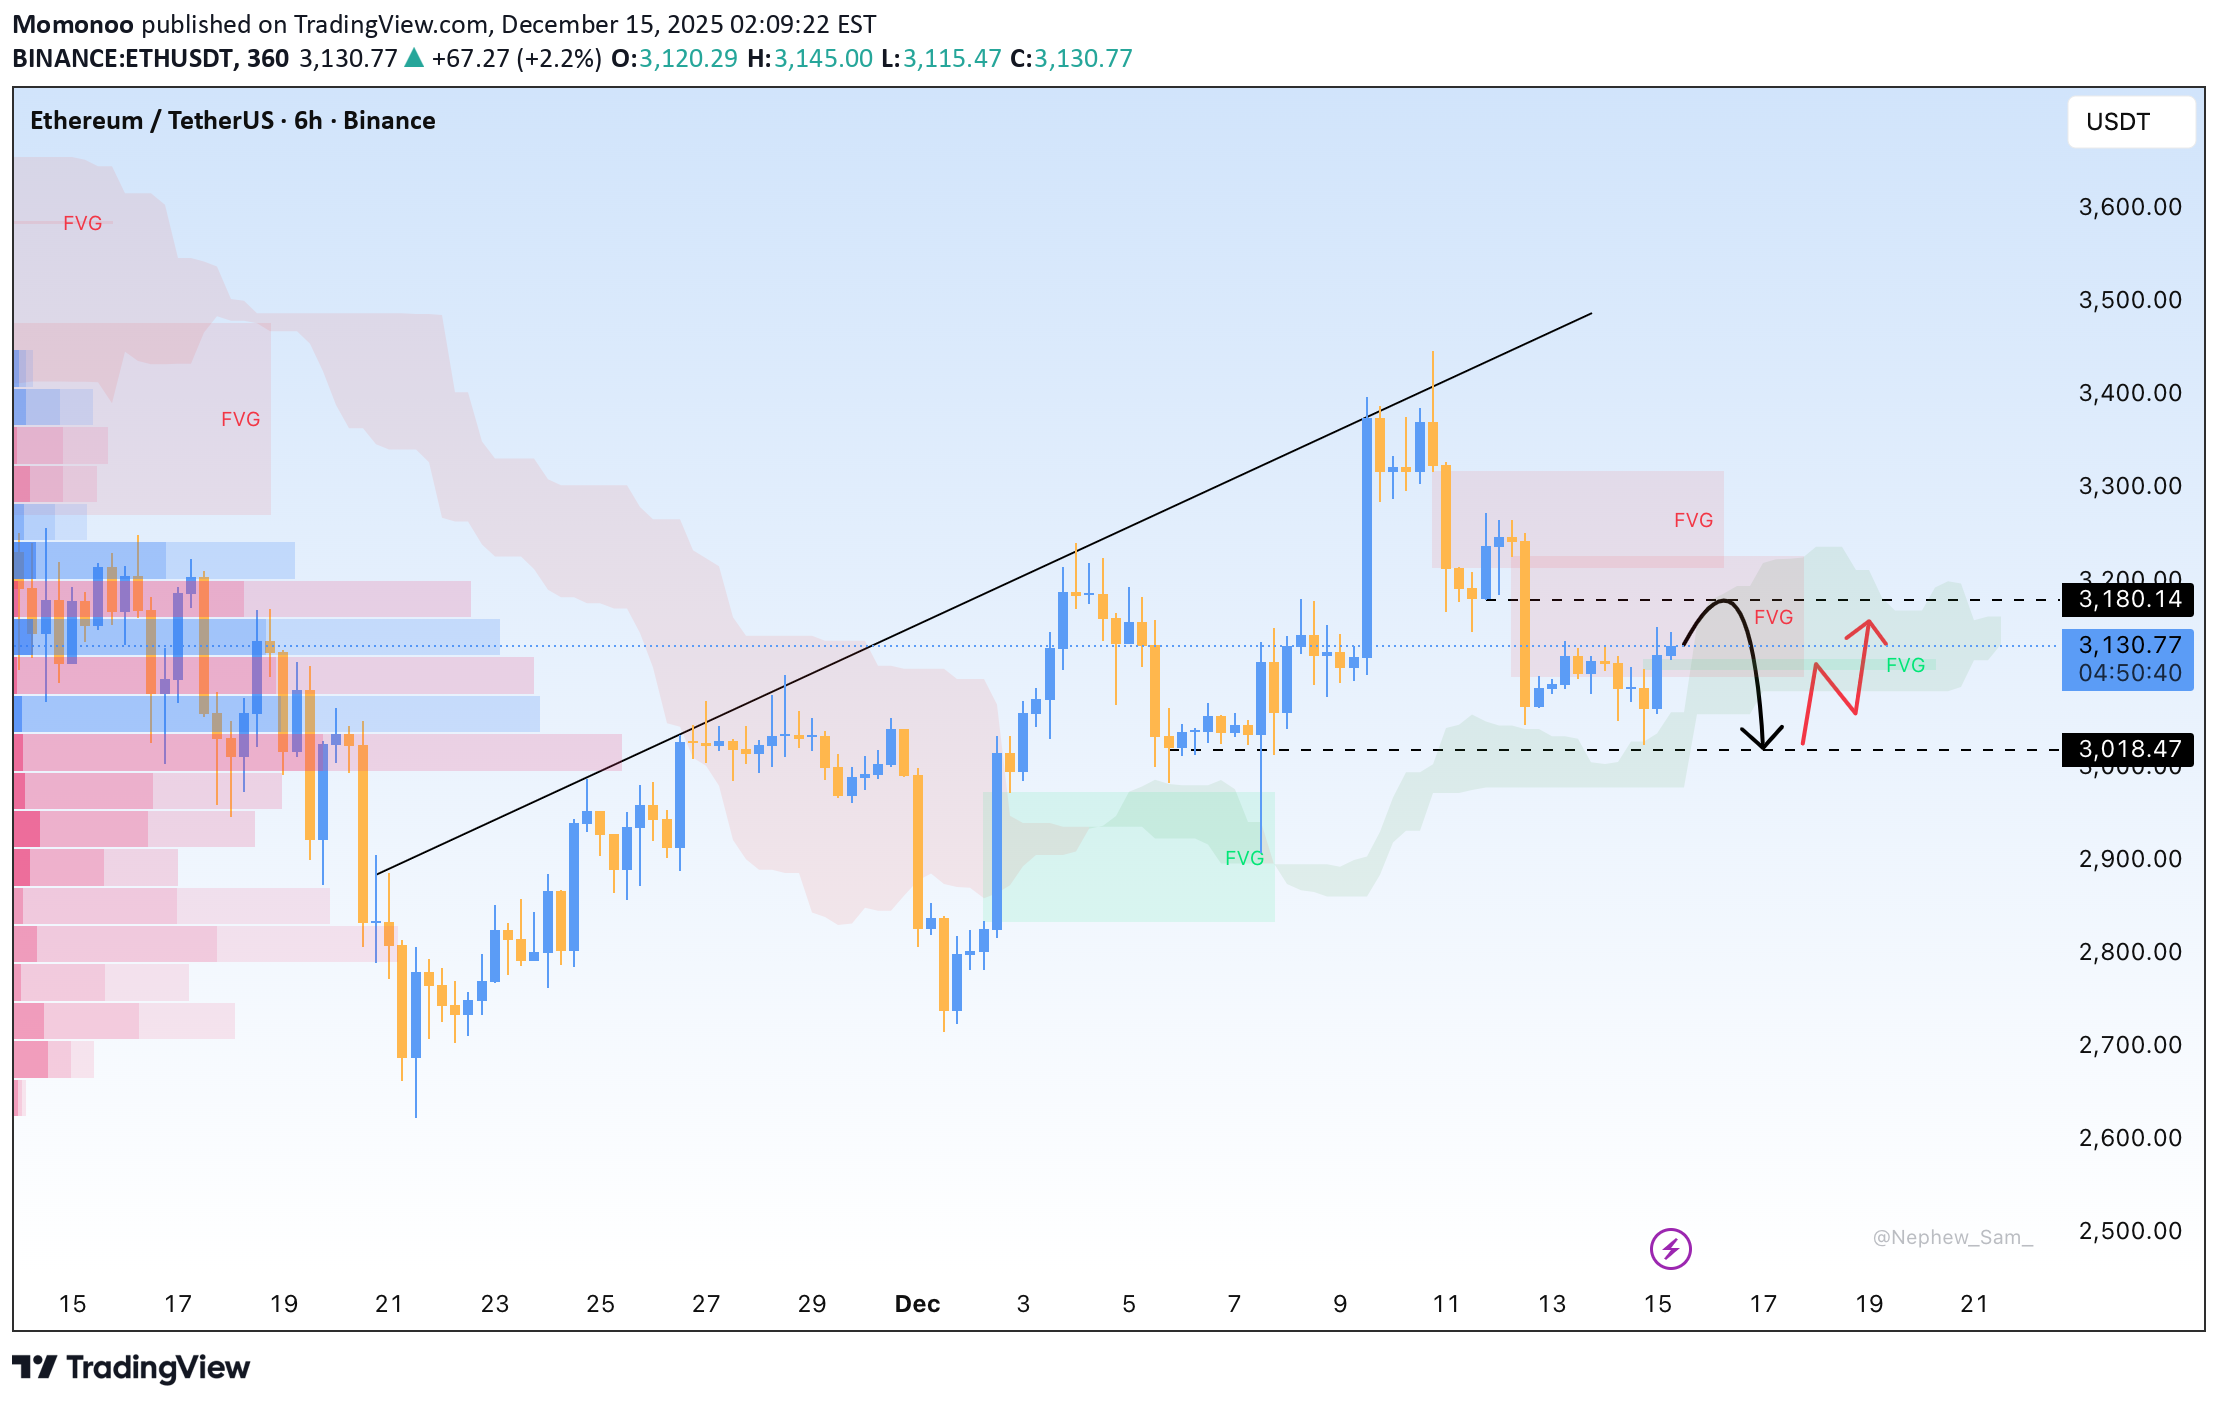
On the 6H chart, ETHUSDT is stabilising after the drop from 3,350. Selling pressure has eased, but demand remains insufficient to establish a fresh uptrend. Price action suggests a pause rather than a reversal, with the market waiting for clearer direction. From a broader perspective, Bitcoin’s inability to break key resistance levels continues to cap upside across altcoins. A steady DXY also limits risk appetite, while Ethereum lacks a new catalyst following EIP-4844. As a result, rebounds remain slow and are quickly met with supply. As long as ETH holds above the 3,050–3,120 area, sideways accumulation between 3,080 and 3,200 is the base case. A break above 3,280–3,330 would be required to confirm a broader bullish continuation.
Gold at $4,300: A Structural Bull Market Takes Shape
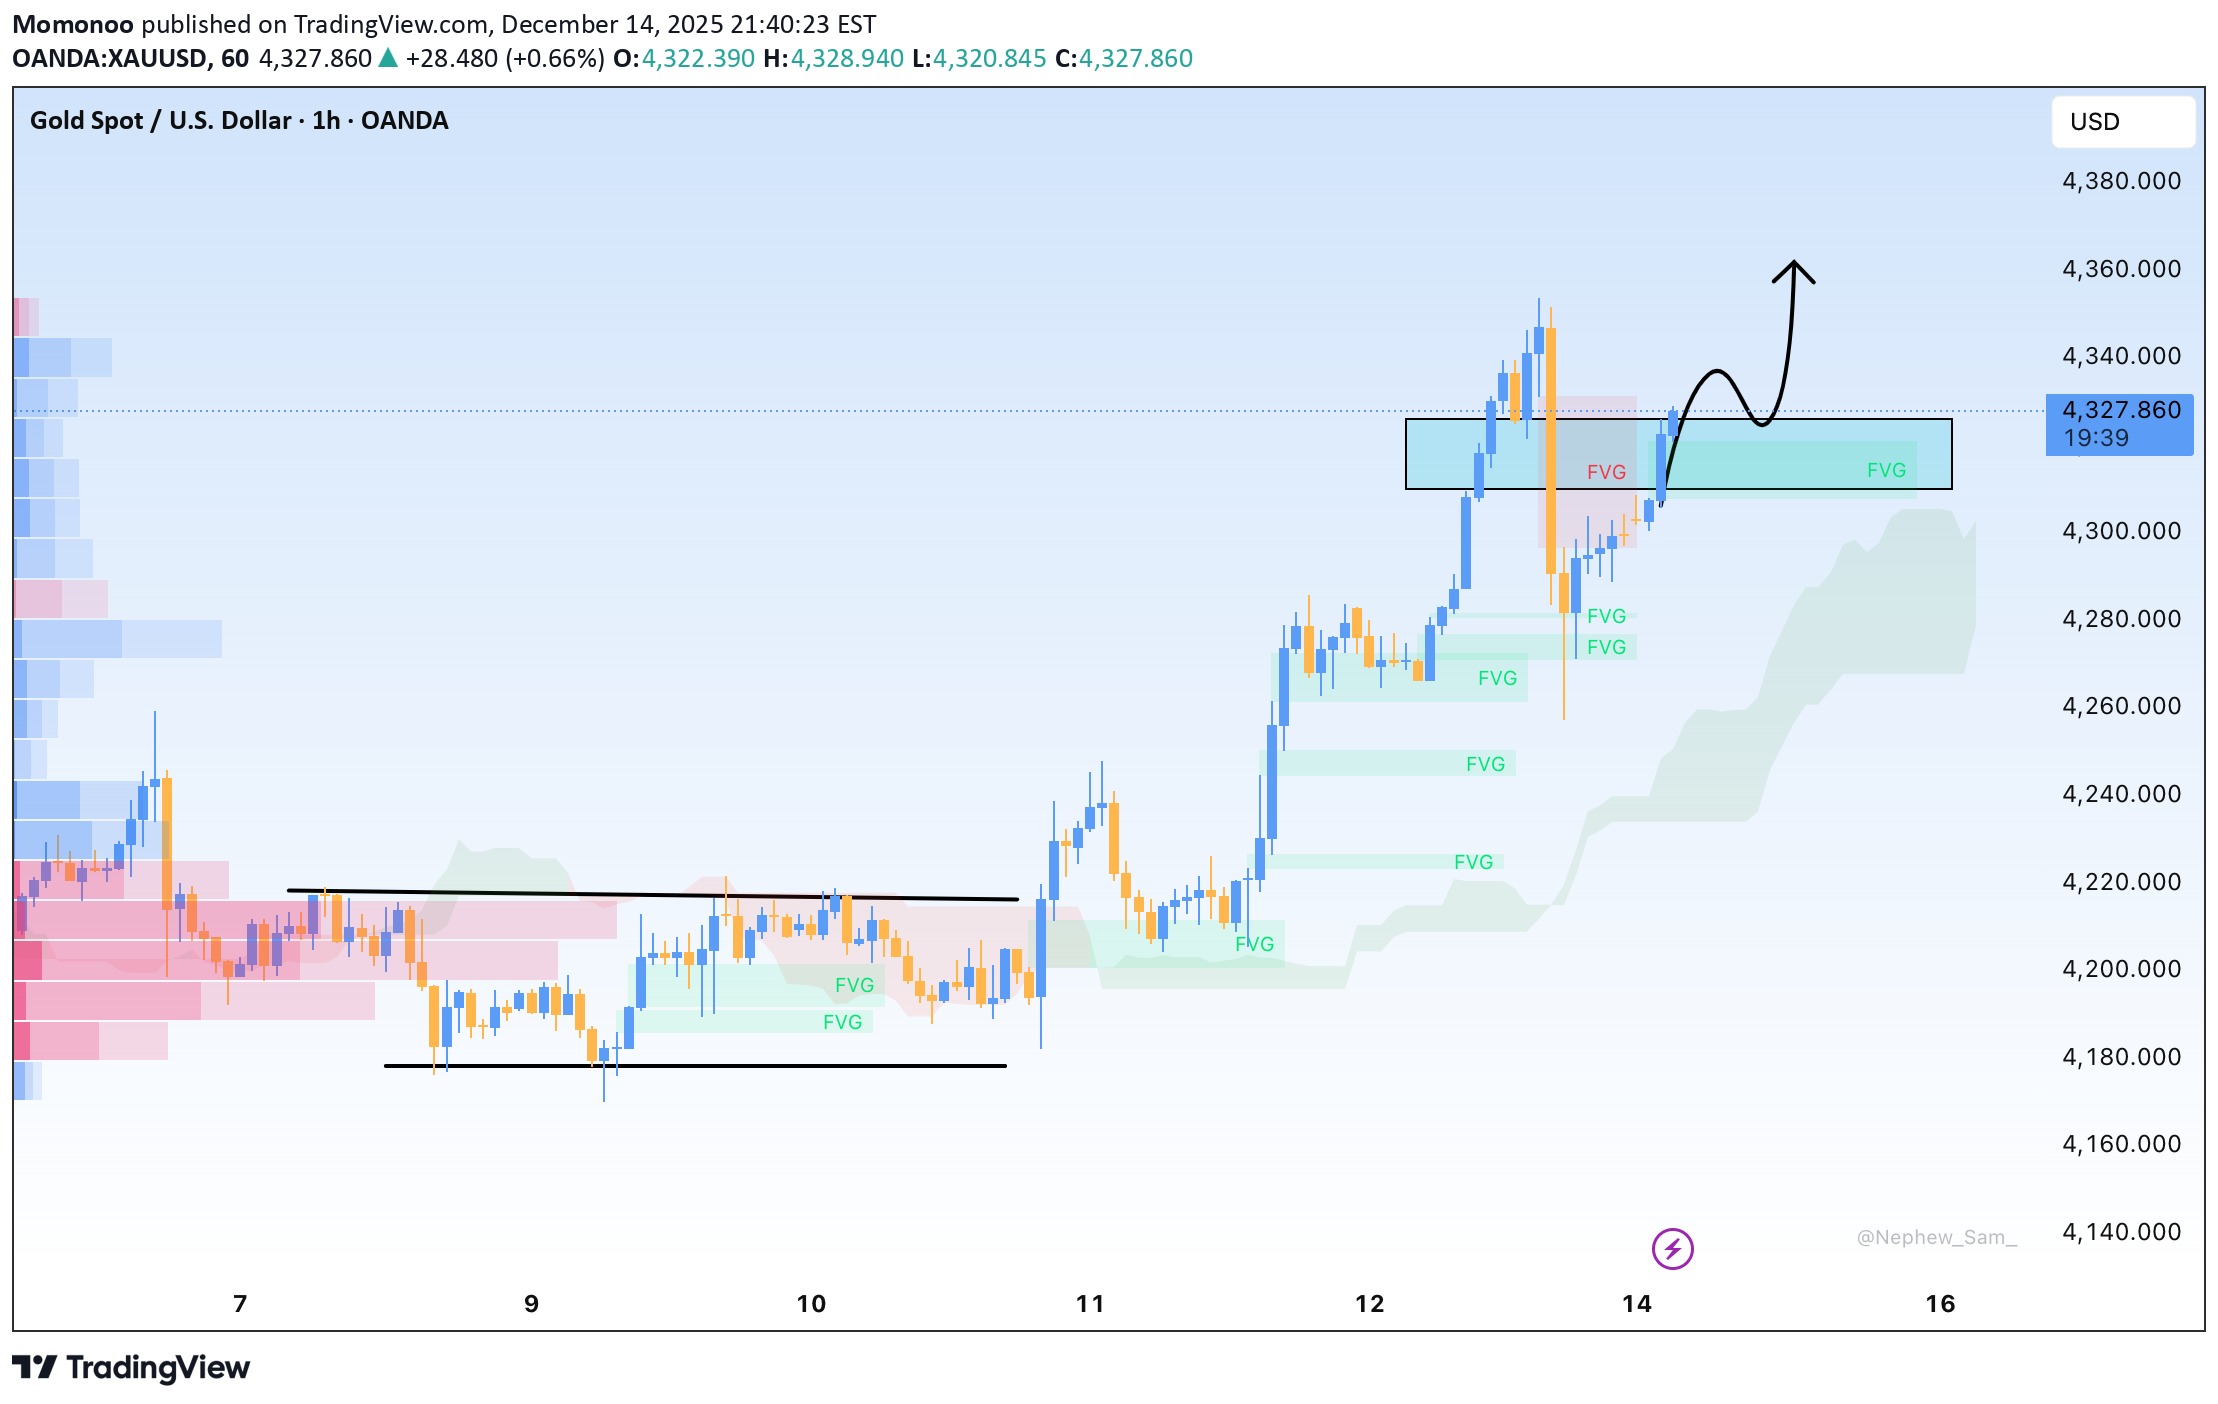
Gold’s surge to a new all-time high at $4,300 is not a short-lived spike, but a confirmation of a broader structural trend. A 62% gain in 2025, 150% over three years, and consistent outperformance versus bonds signal a shift: gold is no longer just a cyclical hedge, but a long-term strategic asset. Falling yields, persistent inflation risks, and a weakening USD continue to attract sustained institutional inflows. On the H1 chart, price action reflects a textbook re-accumulation phase. Fair Value Gaps are created and efficiently filled, indicating controlled pullbacks rather than distribution. Gold remains firmly above a rising Ichimoku cloud, keeping bullish momentum intact. The recent dip merely absorbed liquidity around the 4,305–4,315 zone before price stabilized again. As long as gold holds above that support, the next upside extension toward 4,335–4,350 remains likely. A decisive breakout could open the door toward the 4,375–4,400 region, aligning technical structure with increasingly bullish long-term projections from major institutions.
لماذا تشتري البنوك المركزية الذهب؟

عندما تقرر البنوک المرکزیة شراء الذهب، فهی لا تضیف مجرد معدن ثمین إلى احتیاطاتها، بل تعزز أساس القوة المالیة للدولة. الذهب لا یعتمد على وعود، ولا یمثل دینًا على أی جهة، ولا یمکن التلاعب به سیاسیًا. فی نظام مالی عالمی تقوم فیه معظم الأصول على الدیون والالتزامات، یبقى الذهب الأصل الوحید المستقل تمامًا. یمتلک الذهب طبیعة مزدوجة: أصل مالی طویل الأمد وأداة جیوسیاسیة فی آن واحد. فهو یحمی قیمة العملة الوطنیة ویقلل من آثار الصدمات الاقتصادیة والتضخم. تاریخیًا، کلما ضعفت العملات وارتفع التضخم، ارتفعت قیمة الذهب. وعلى المستوى الجیوسیاسی، لا یعتمد الذهب على الدولار أو نظام سویفت، ولا یمکن تجمیده، مما یجعله مخزنًا آمنًا للقوة السیادیة. تقوم البنوک المرکزیة بتجمیع الذهب بهدوء وعلى المدى الطویل. ومع الدولار والسندات الحکومیة، یشکل الذهب الرکیزة الأساسیة للاحتیاطیات. فی أوقات الأزمات، یصبح الذهب أداة لحمایة العملة واستعادة الثقة. لهذا السبب تتسارع ظاهرة تقلیل الاعتماد على الدولار فی آسیا والشرق الأوسط ودول البریکس. من الصین إلى روسیا وترکیا والهند، تؤکد التجارب الواقعیة أن الذهب لا یزال العمود الفقری للاستقرار المالی. ففی عالم یعتمد على الثقة، یبقى الذهب أصلًا یعتمد على طبیعته — ولهذا یظل مصدر قوة حتى فی القرن الحادی والعشرین.
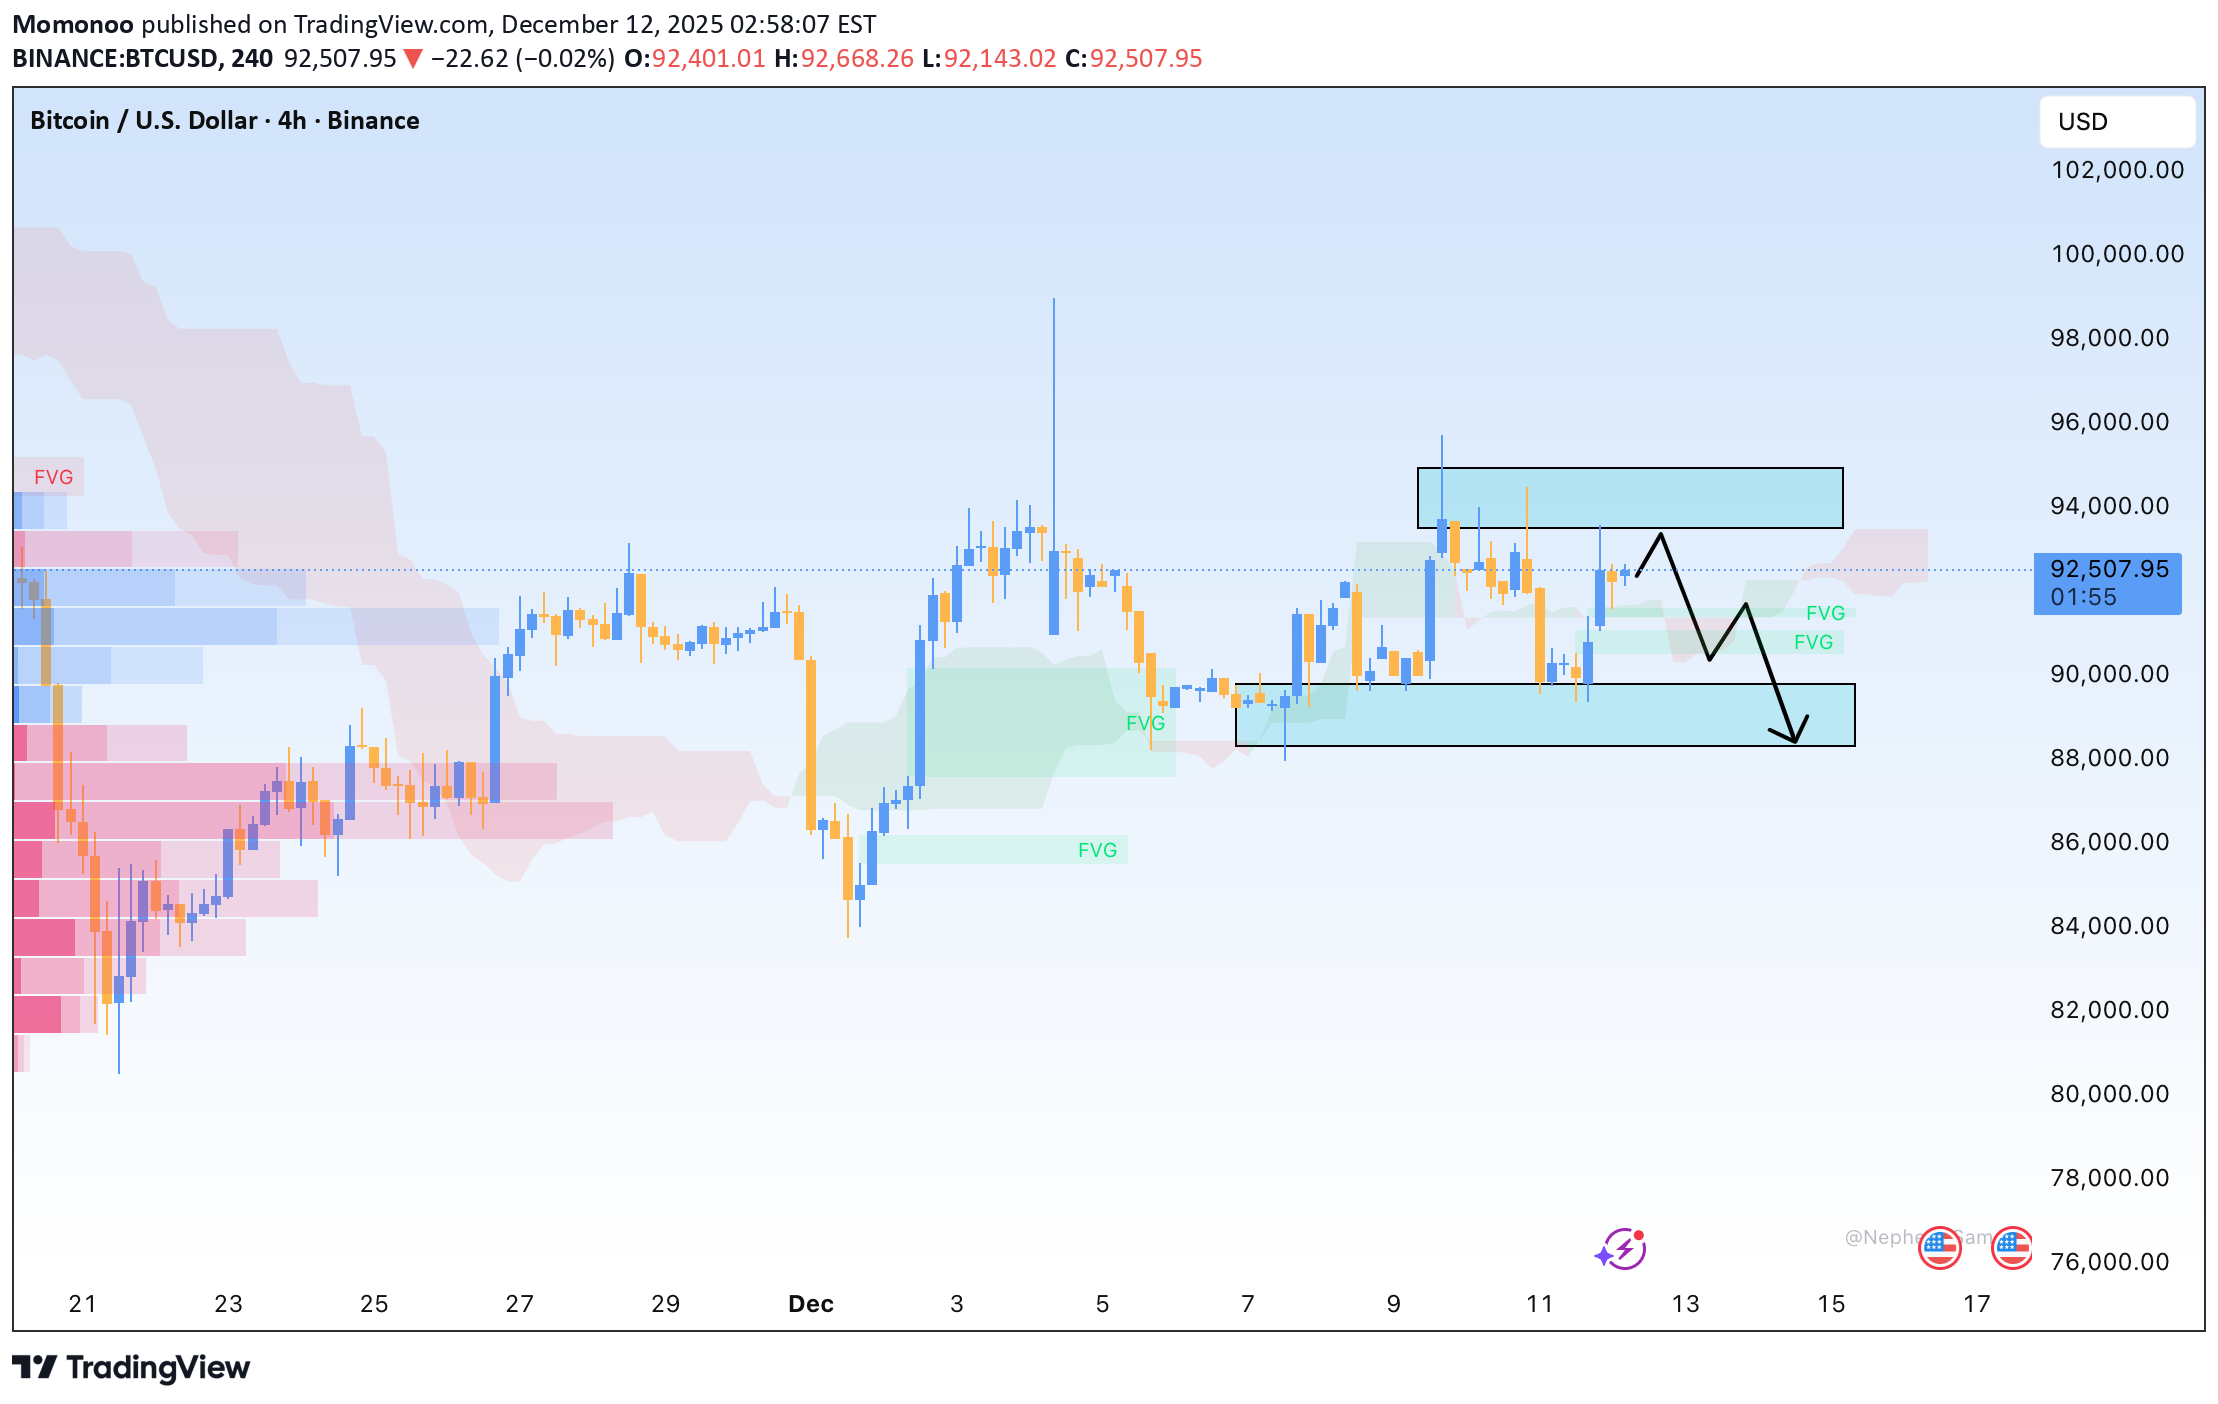
بیت کوین در آستانه انفجار: آماده پولبک نهایی و جمعآوری نقدینگی شوید!
On the H4 chart, Bitcoin is clearly entering a compression phase: volatility is shrinking, volume is fading, and price is tightly squeezed between overhead supply and underlying demand. This type of structure typically reflects a “hidden energy” phase before a decisive expansion. At the moment, BTC is ranging between 90,000 and 92,000, gravitating around the 91,500–92,500 FVG where price is repeatedly rejected. On the downside, the Ichimoku cloud aligns with the 89,500–90,000 FVG and continues to hold firm, signalling equilibrium rather than aggressive selling. Sellers are unable to push price lower, while buyers are not yet committing enough capital to force a breakout. Two Fair Value Gaps define the battlefield. The 91,500–92,500 zone acts as a strong supply pocket; only a clean H4 close above 92,500 would confirm a bullish continuation. Conversely, the 88,500–89,500 FVG represents the key demand area — a break below it would reintroduce short-term bearish structure. Given the current compression and the fact that the lower FVG remains partially unfilled, I continue to favour a final liquidity sweep to the downside before a stronger upside move. If clear buying pressure emerges from the lower FVG, the subsequent breakout is far more likely to be decisive and sustainable.
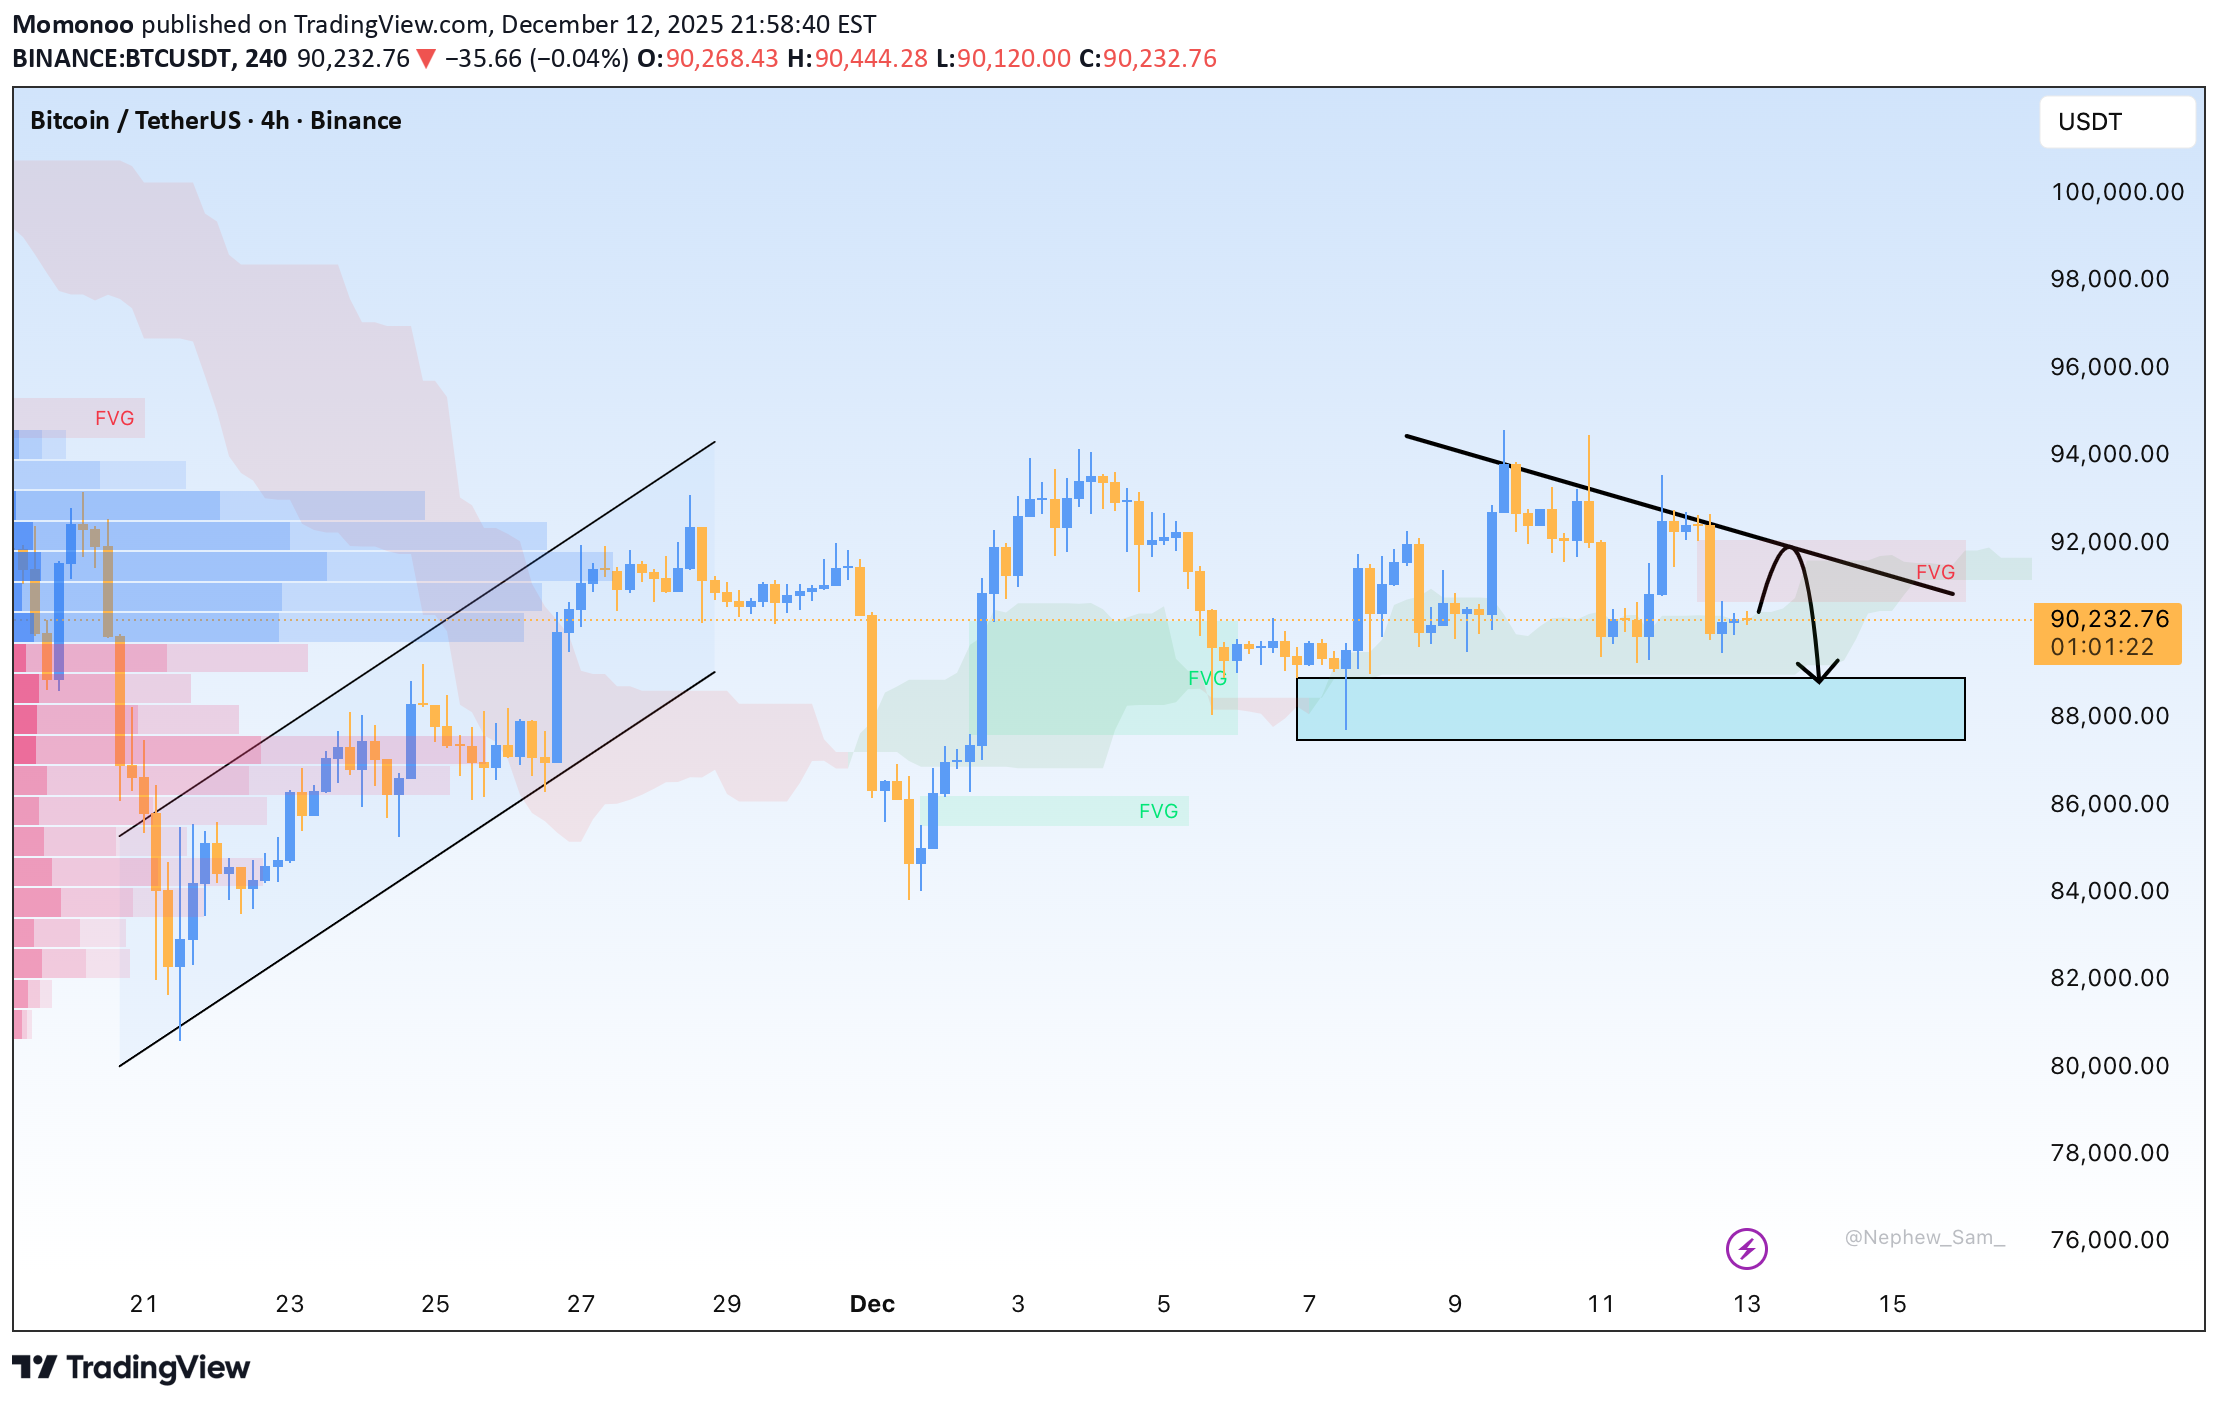
BTC Awaits a Liquidity Sweep Before Any Real Rally
Bitcoin on the H4 timeframe continues to hover inside a tight equilibrium band around 91,500–93,500, with price repeatedly tapping both edges of the range without showing directional commitment. The current movement suggests liquidity hunting rather than trend development, as every push toward 92,000 quickly gets absorbed. Macro conditions still lean supportive thanks to the low-rate outlook, yet capital flows are favoring metals over crypto, leaving BTC with a muted recovery after the prior drop. Buyers remain cautious while sellers lose momentum, causing price to float above two demand/FVG layers at 89,500–90,500 and 86,500–88,000. The scenario with the highest probability is a final liquidity flush. BTC may continue consolidating around 92,000–93,000 before sliding to 90,000 and dipping into the deeper FVG at 88,000–86,500. A clean reaction there would open room for the next impulsive leg upward.
افت شدید اتریوم: آیا حمایت حیاتی ۳۲۰۰ دلار شکسته میشود؟
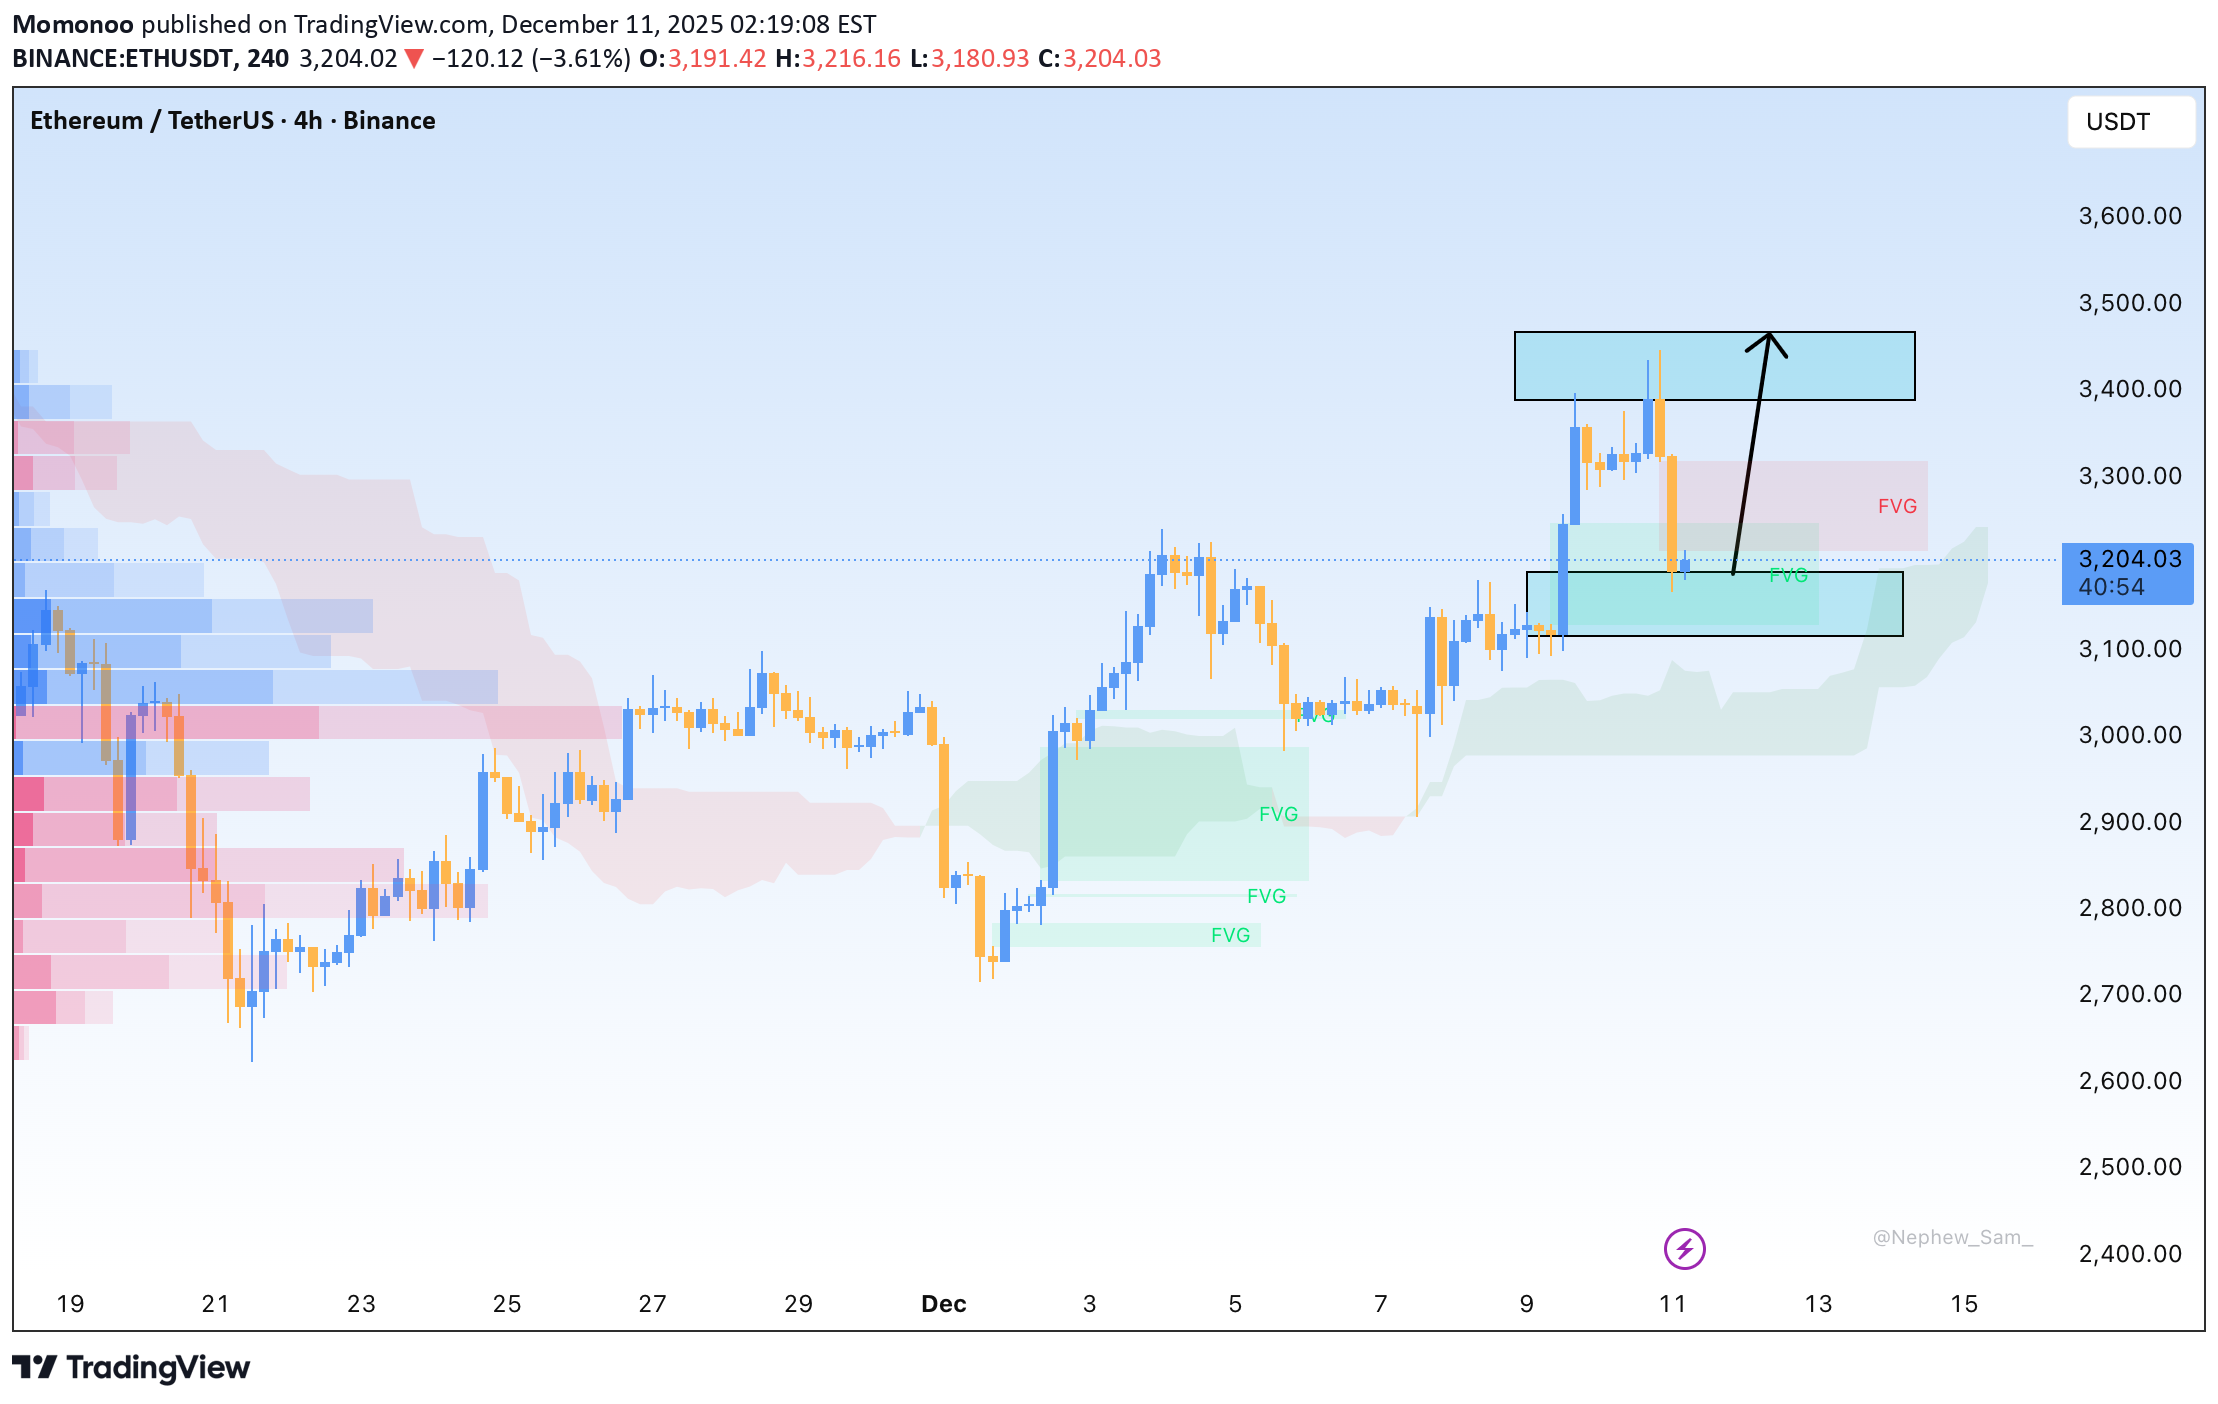
ETH has undergone a sharp correction, dropping from the 3,380–3,400 zone directly into the 3,180–3,200 FVG, where price reacted firmly. This move signals a clear liquidity sweep — a deep probe to collect orders before bouncing at a key demand pocket, reinforcing this FVG as short-term support. To the upside, the 3,300–3,360 bearish FVG remains a major barrier, where ETH previously saw strong rejection. Volume Profile shows thin liquidity in this range, explaining why sellers continue to dominate whenever price retests it. The broader market structure still leans bullish with higher lows intact, but the recent sweep places ETH in a deeper corrective phase. The 3,180–3,200 zone now acts as a crucial pivot: losing it would flip the short-term bias bearish and expose the high-volume 3,000–3,100 region.
اتریوم در انتظار فدرال رزرو: سکون قیمت یا ریزش قریبالوقوع؟
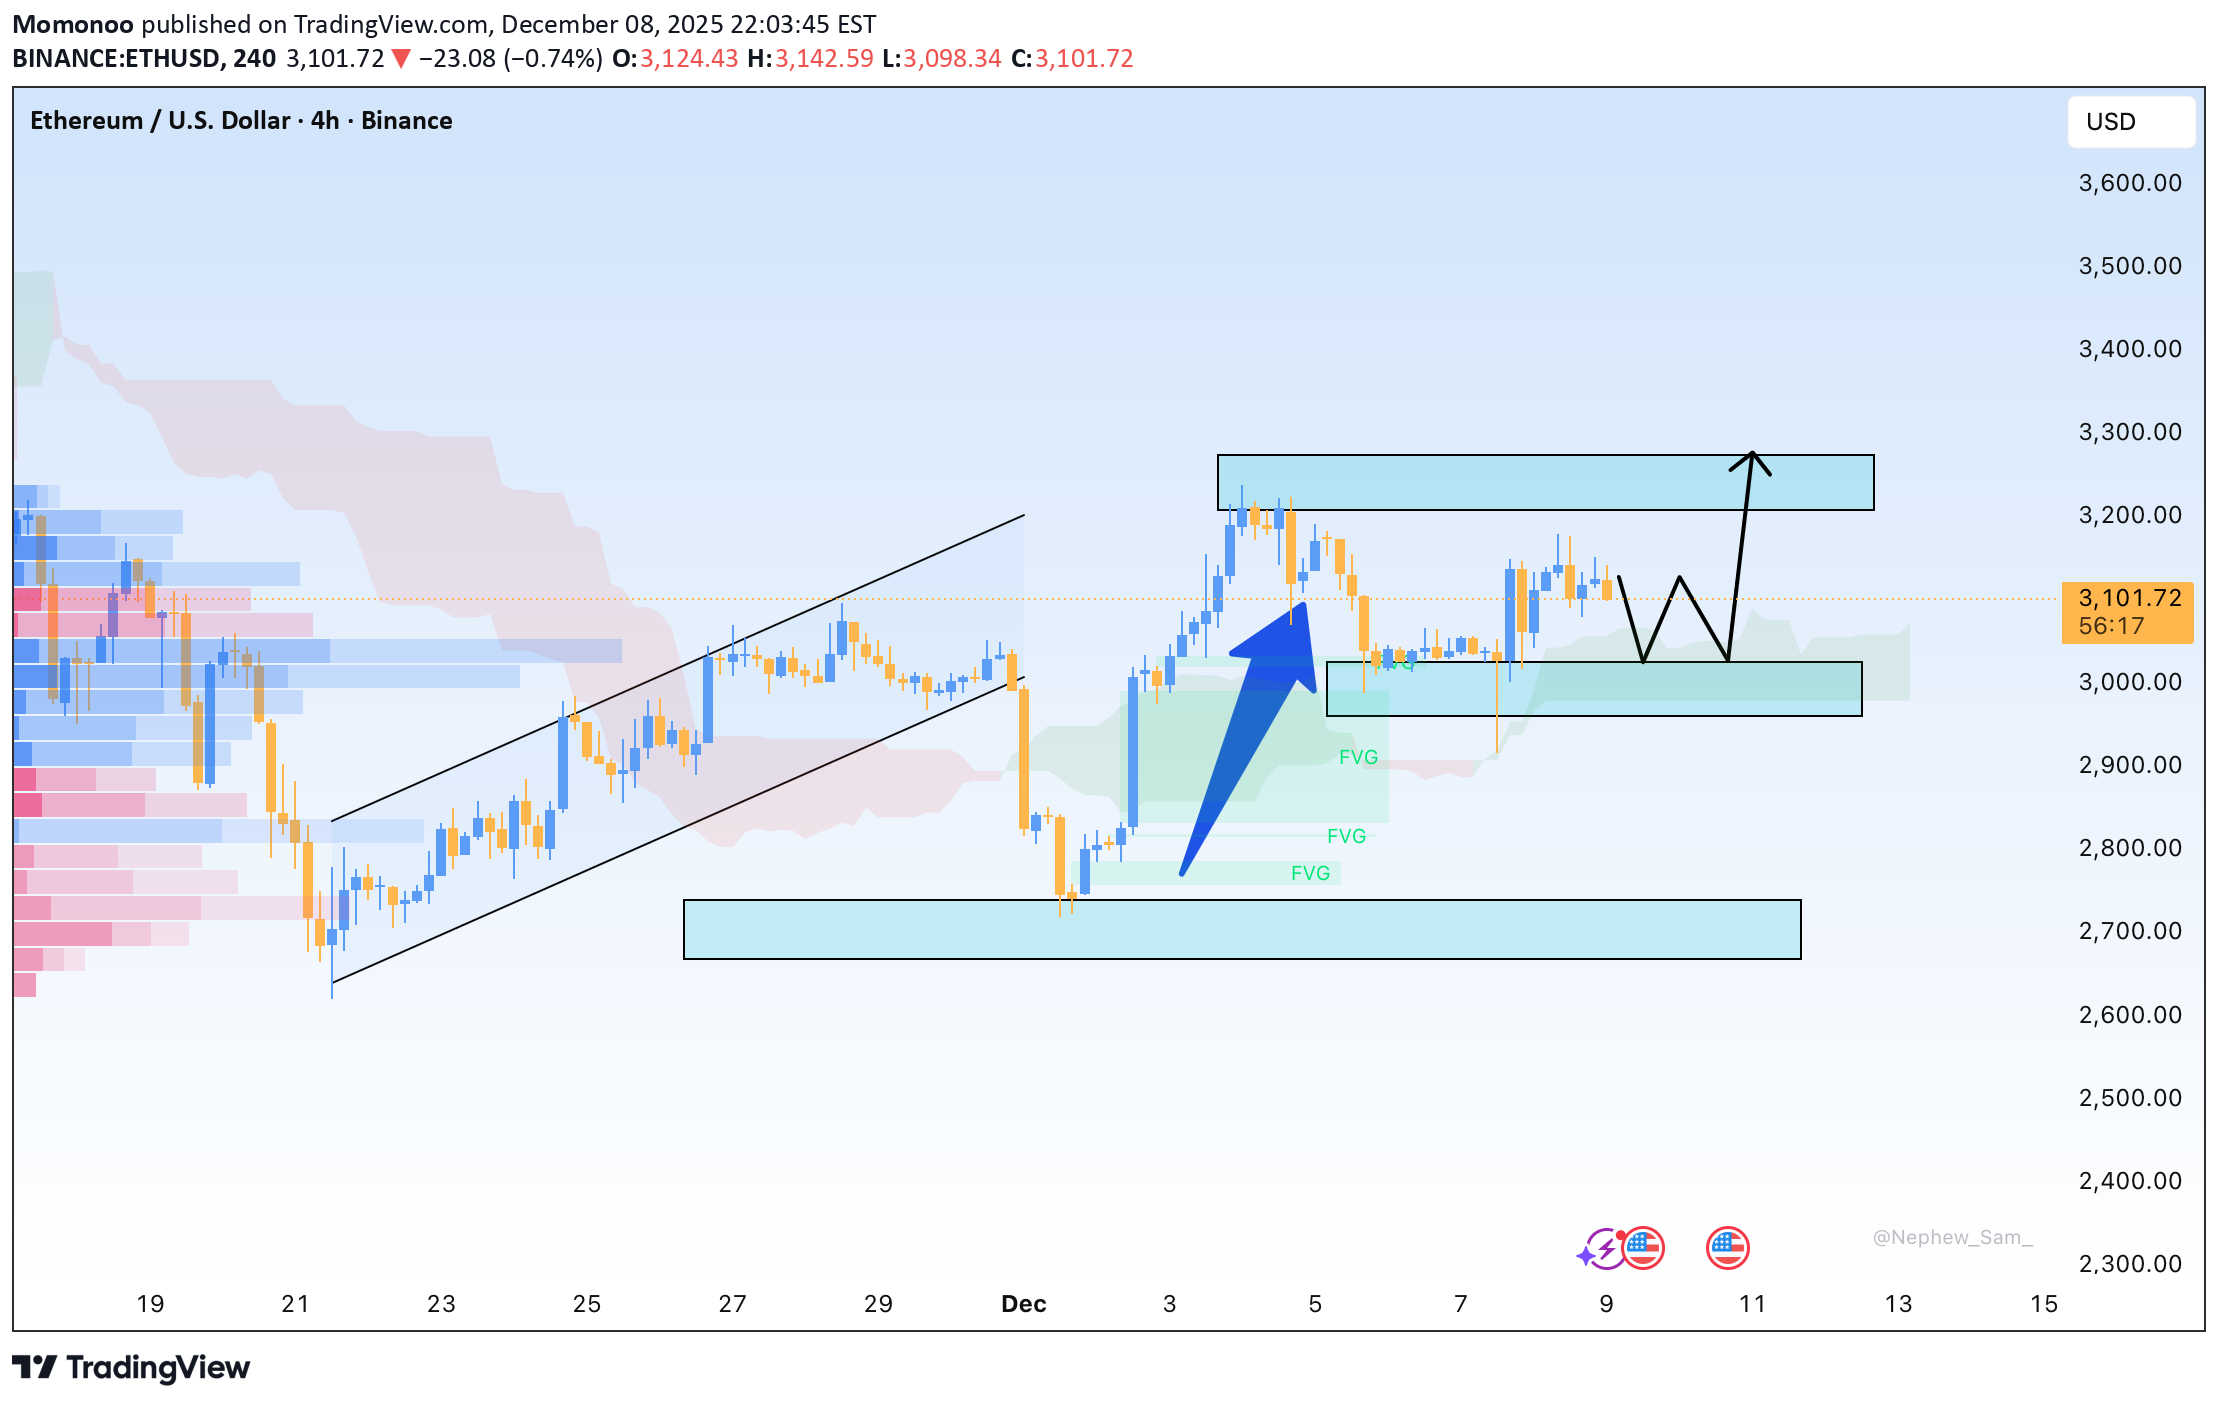
ETH on the H4 timeframe is moving sideways between 3,080–3,130 after a strong rebound from 2,750–2,800, signaling a shift into consolidation rather than continuation. The current zone overlaps a previous high-volume distribution area, while a flat Ichimoku cloud reflects indecision. Price hasn’t broken past the last high, and the lower FVG at 2,980–3,050 may still attract a retest. A clean breakout above 3,150–3,200 is needed to confirm upside momentum; until then, ETH remains in wait-and-see mode ahead of the Fed.
Solana Rebounds Weakly with No Clear Trend Signals
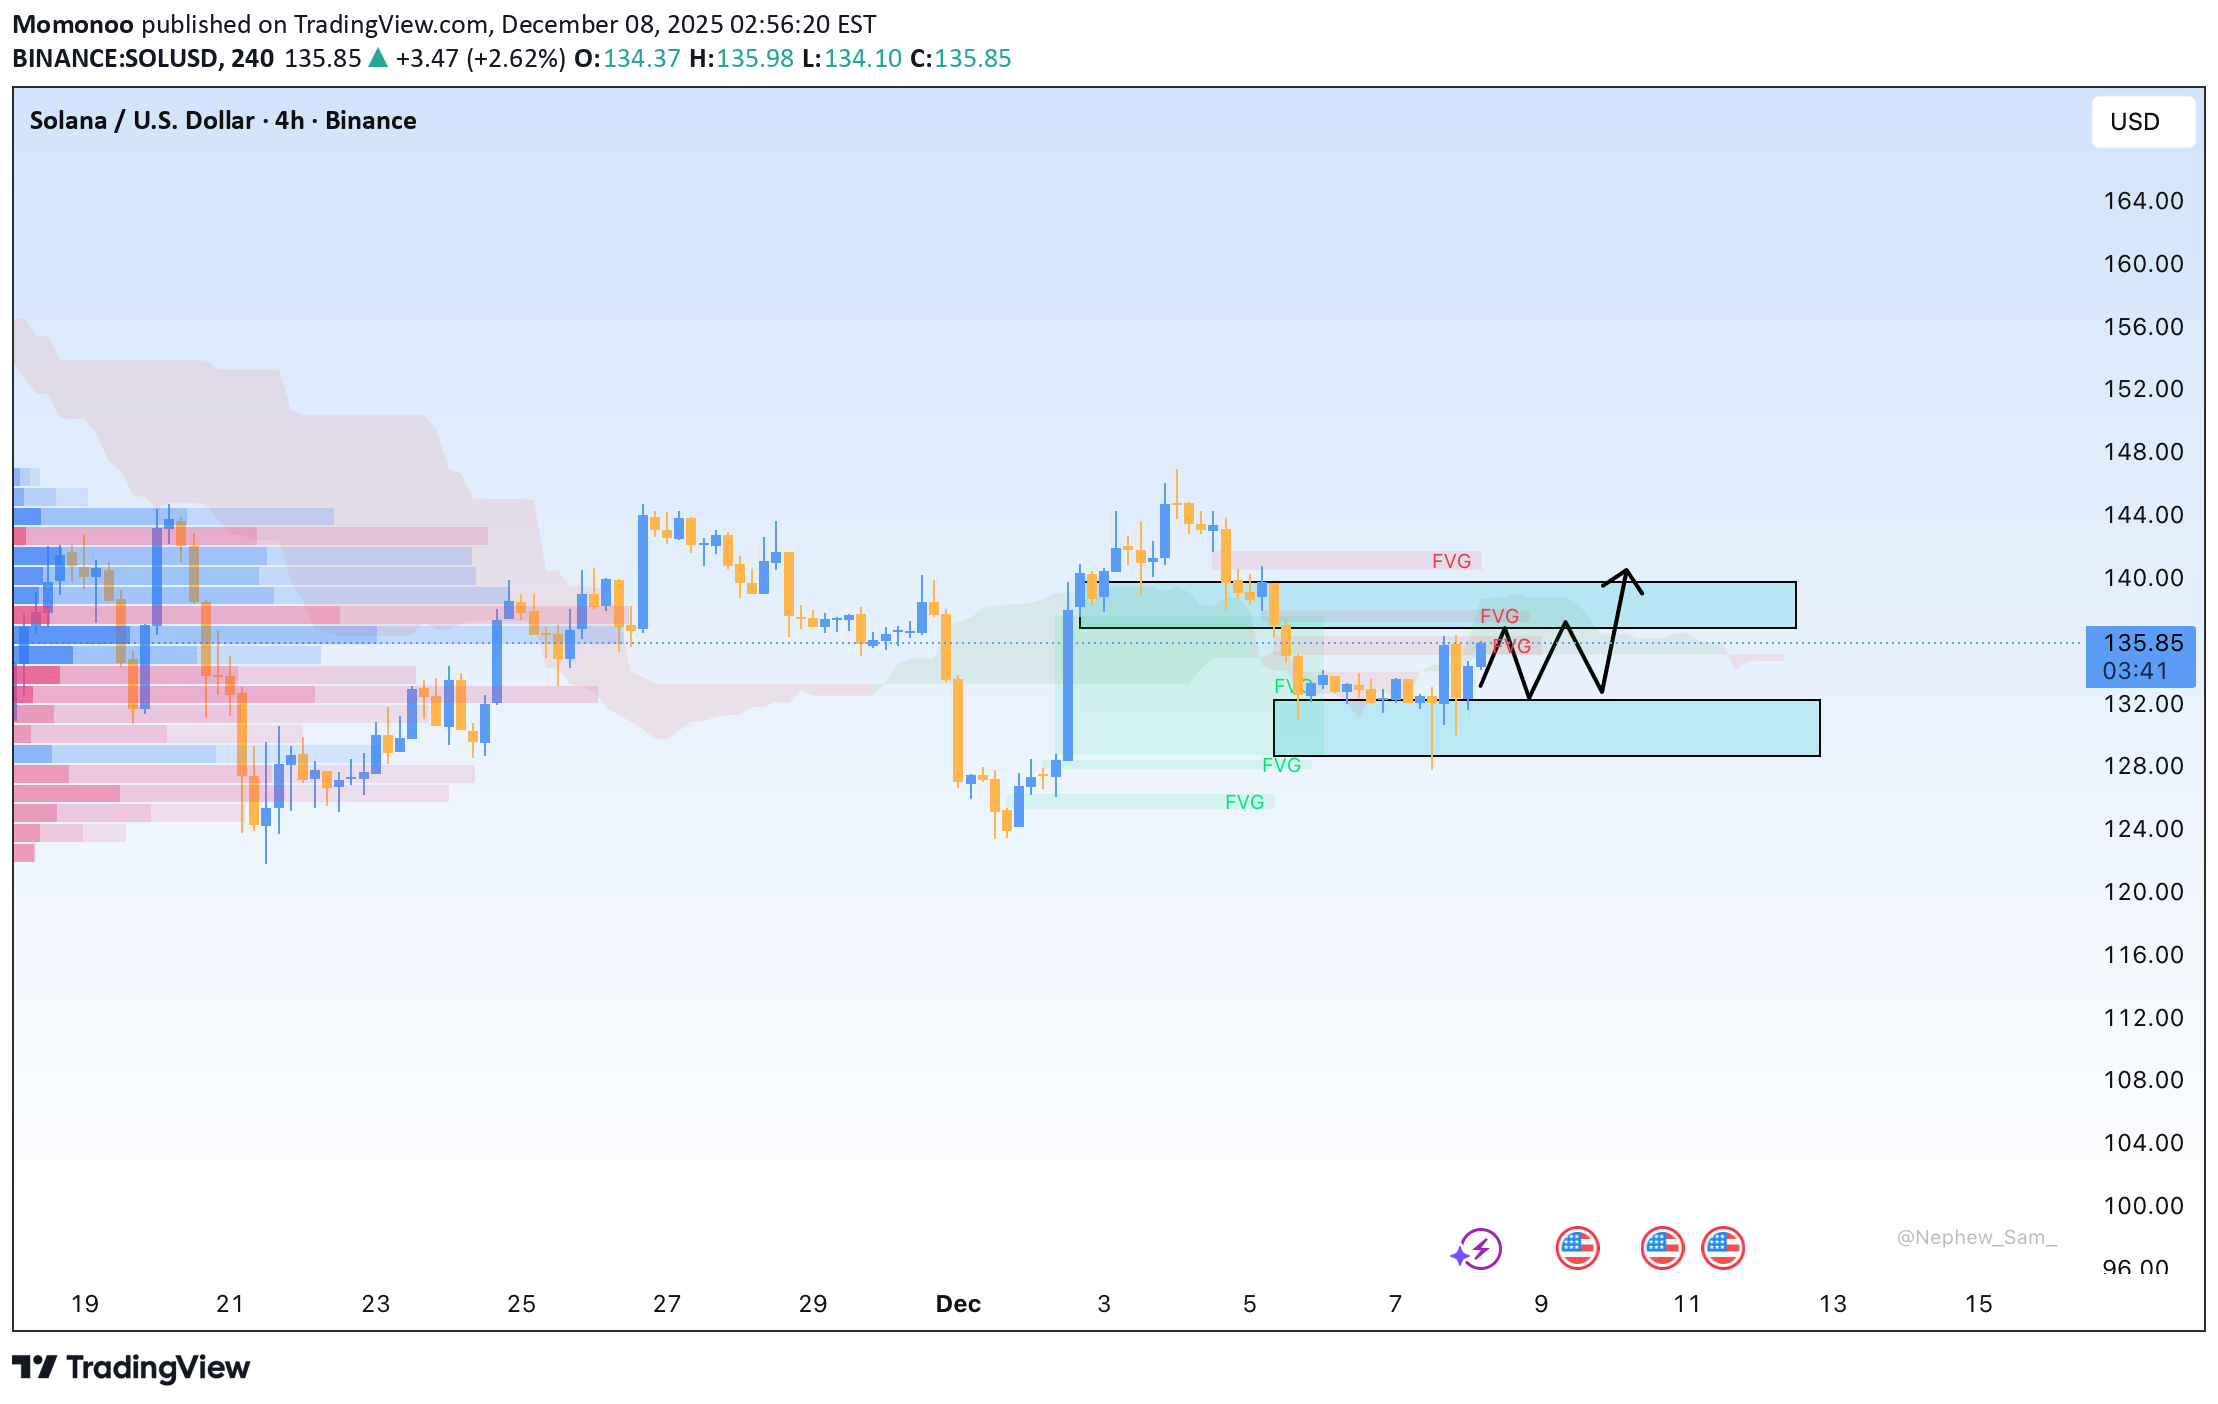
Solana on the 4H timeframe is only showing a mild pullback, as neither technicals nor news indicate fresh inflows strong enough to shift momentum. Price remains capped below the 138–142 FVG resistance cluster, and although small rebounds occur, their narrow range highlights the lack of aggressive buying. The Ichimoku cloud and multiple overhead FVGs form a thick supply layer, causing every upward attempt to be sold off — making a breakout relatively unlikely. Volume behaviour also supports the idea of a technical retracement: it picks up slightly at the lows but fades as price climbs, signalling reactive buying rather than committed inflows. If SOL fails to break above 142, a move back down to fill the lower FVG at 128–123 remains a reasonable scenario.
Disclaimer
Any content and materials included in Sahmeto's website and official communication channels are a compilation of personal opinions and analyses and are not binding. They do not constitute any recommendation for buying, selling, entering or exiting the stock market and cryptocurrency market. Also, all news and analyses included in the website and channels are merely republished information from official and unofficial domestic and foreign sources, and it is obvious that users of the said content are responsible for following up and ensuring the authenticity and accuracy of the materials. Therefore, while disclaiming responsibility, it is declared that the responsibility for any decision-making, action, and potential profit and loss in the capital market and cryptocurrency market lies with the trader.