
BNB
Binance Coin
| تریدر | نوع سیگنال | حد سود/ضرر | زمان انتشار | مشاهده پیام |
|---|---|---|---|---|
 Low_Leverage_MatthewRank: 213 | خرید | حد سود: تعیین نشده حد ضرر: تعیین نشده | 11/3/2025 | |
 isahebdadiRank: 826 | خرید | حد سود: تعیین نشده حد ضرر: تعیین نشده | 11/21/2025 | |
 TradeWithMkyRank: 1068 | خرید | حد سود: تعیین نشده حد ضرر: تعیین نشده | 11/21/2025 | |
 Hosein_meRank: 1906 | خرید | حد سود: تعیین نشده حد ضرر: تعیین نشده | 11 hour ago | |
 tomas_jntxRank: 3498 | خرید | حد سود: تعیین نشده حد ضرر: تعیین نشده | 11/16/2025 |
Price Chart of Binance Coin
سود 3 Months :
خلاصه سیگنالهای Binance Coin
سیگنالهای Binance Coin
Filter
Sort messages by
Trader Type
Time Frame

tradecitypro
تحلیل سرنوشت ساز BNB: خط روند نزولی شکسته میشود یا حمایت $808 سقوط میکند؟
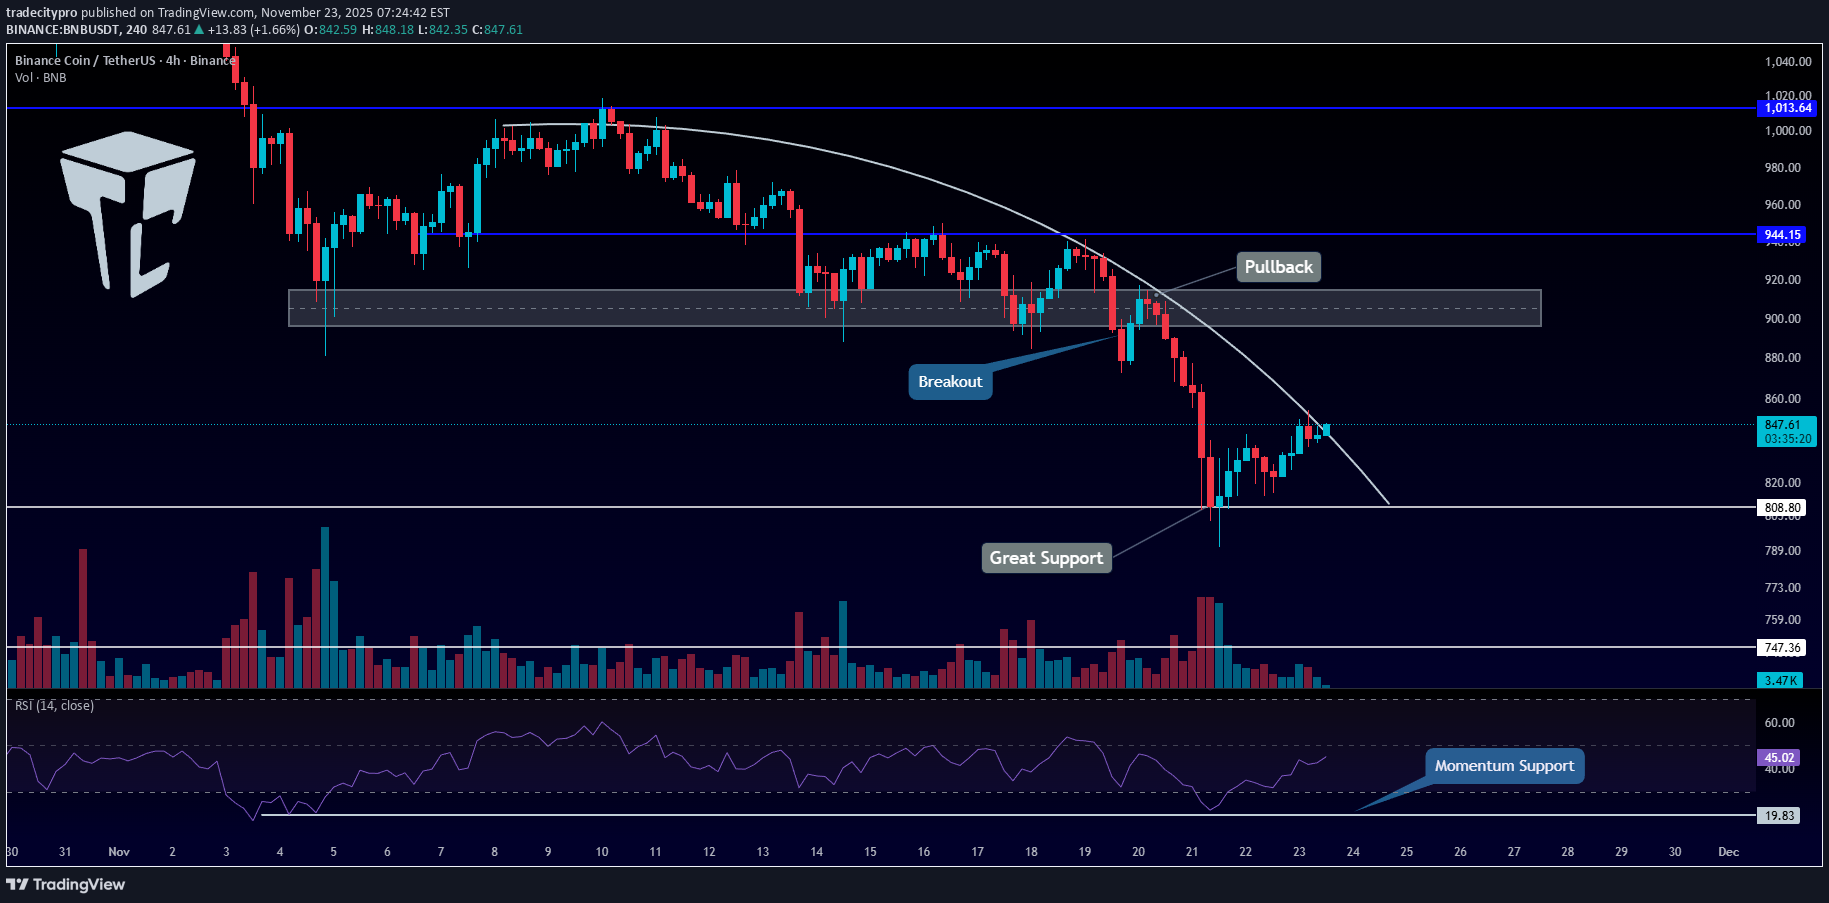
👋 Welcome to TradeCity Pro! In this analysis, I want to review the BNB coin for you, one of the most popular and well-known cryptocurrency exchanges, whose native token has a $115.97 billion market cap and is currently ranked 5th on CoinMarketCap. ⏳ 4-Hour Timeframe On the 4-hour timeframe, BNB is in a downtrend, and its latest bearish wave started after breaking below the $900 zone, continuing down to the $808 level. ✨ There is also a curved descending trendline on BNB’s chart, which has now become very steep, and the price has reached this trendline. ⭐ If this trendline breaks, the correction could deepen, allowing the price to move toward higher zones. But if BNB gets rejected from this trendline, the downward movement will continue. ✔️ The next short trigger we have is the break of the $808 level. This is a very important support zone, and if it breaks, the price could fall toward the $747 level. 📊 Buying volume has been very low during this corrective phase, which shows the strength of the sellers. Therefore, a rejection from the trendline or a break below $808 can confirm the start of a new bearish wave. 💥 From a momentum perspective, the RSI is also making a small upward correction similar to the price. The 19.83 level is the key RSI support. 📝 Final Thoughts Stay calm, trade wisely, and let's capture the market's best opportunities! This analysis reflects our opinions and is not financial advice. Share your thoughts in the comments, and don’t forget to share this analysis with your friends! ❤️
Hosein_me
تحلیل لحظهای BNB/USDT: آیا کف قیمتی ۷۳۰ دلار تله خریداران است؟
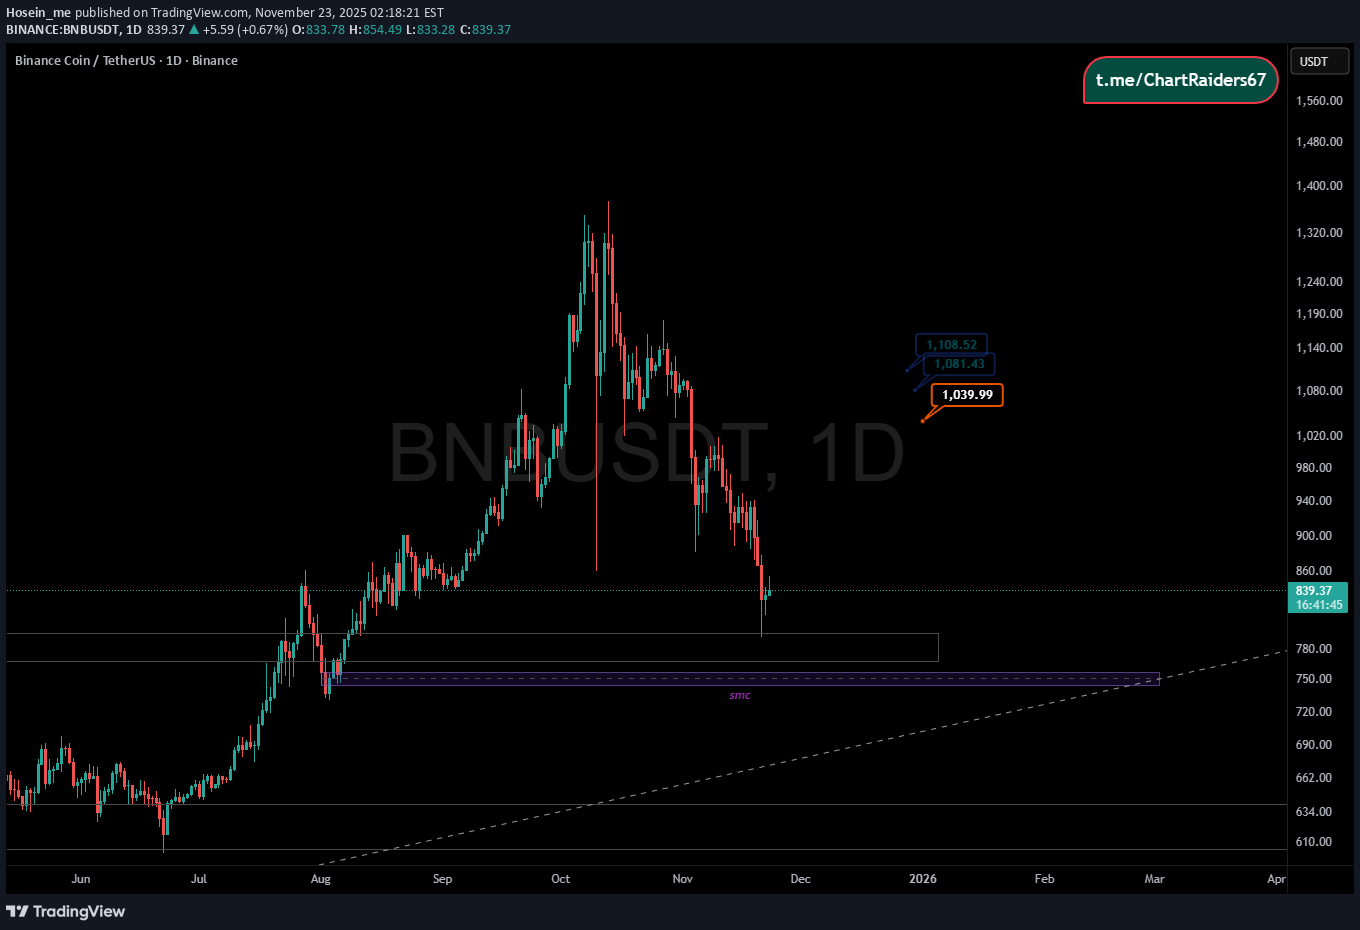
📉 BNB/USDT Daily Analysis: Demand Zone Retest The price of BNB/USDT is undergoing a significant correction, approaching a critical demand area after a strong rally. 🔍 Key Level: The primary support/demand zone (SMC) is identified between $730 and $790. This area is expected to hold strong and trigger a bounce. 🎯 Entry Plan: Look for long entries within the demand zone, specifically around $760 - $780. ⬆️ Take Profit (TP): The initial short-term targets are set at: $1,039.99 $1,081.43 $1,108.52 🛑 Invalidation: The trade setup is invalidated if the price decisively breaks and closes below the $730 demand zone, signaling a deeper bearish move. Strategy: Buy the dip in the highlighted demand zone for a potential rally back towards the $1,000+ resistance levels.

تحلیل روزانه BNB: آیا غول خفته بیدار میشود؟ سناریوهای صعود و نزول کلیدی!
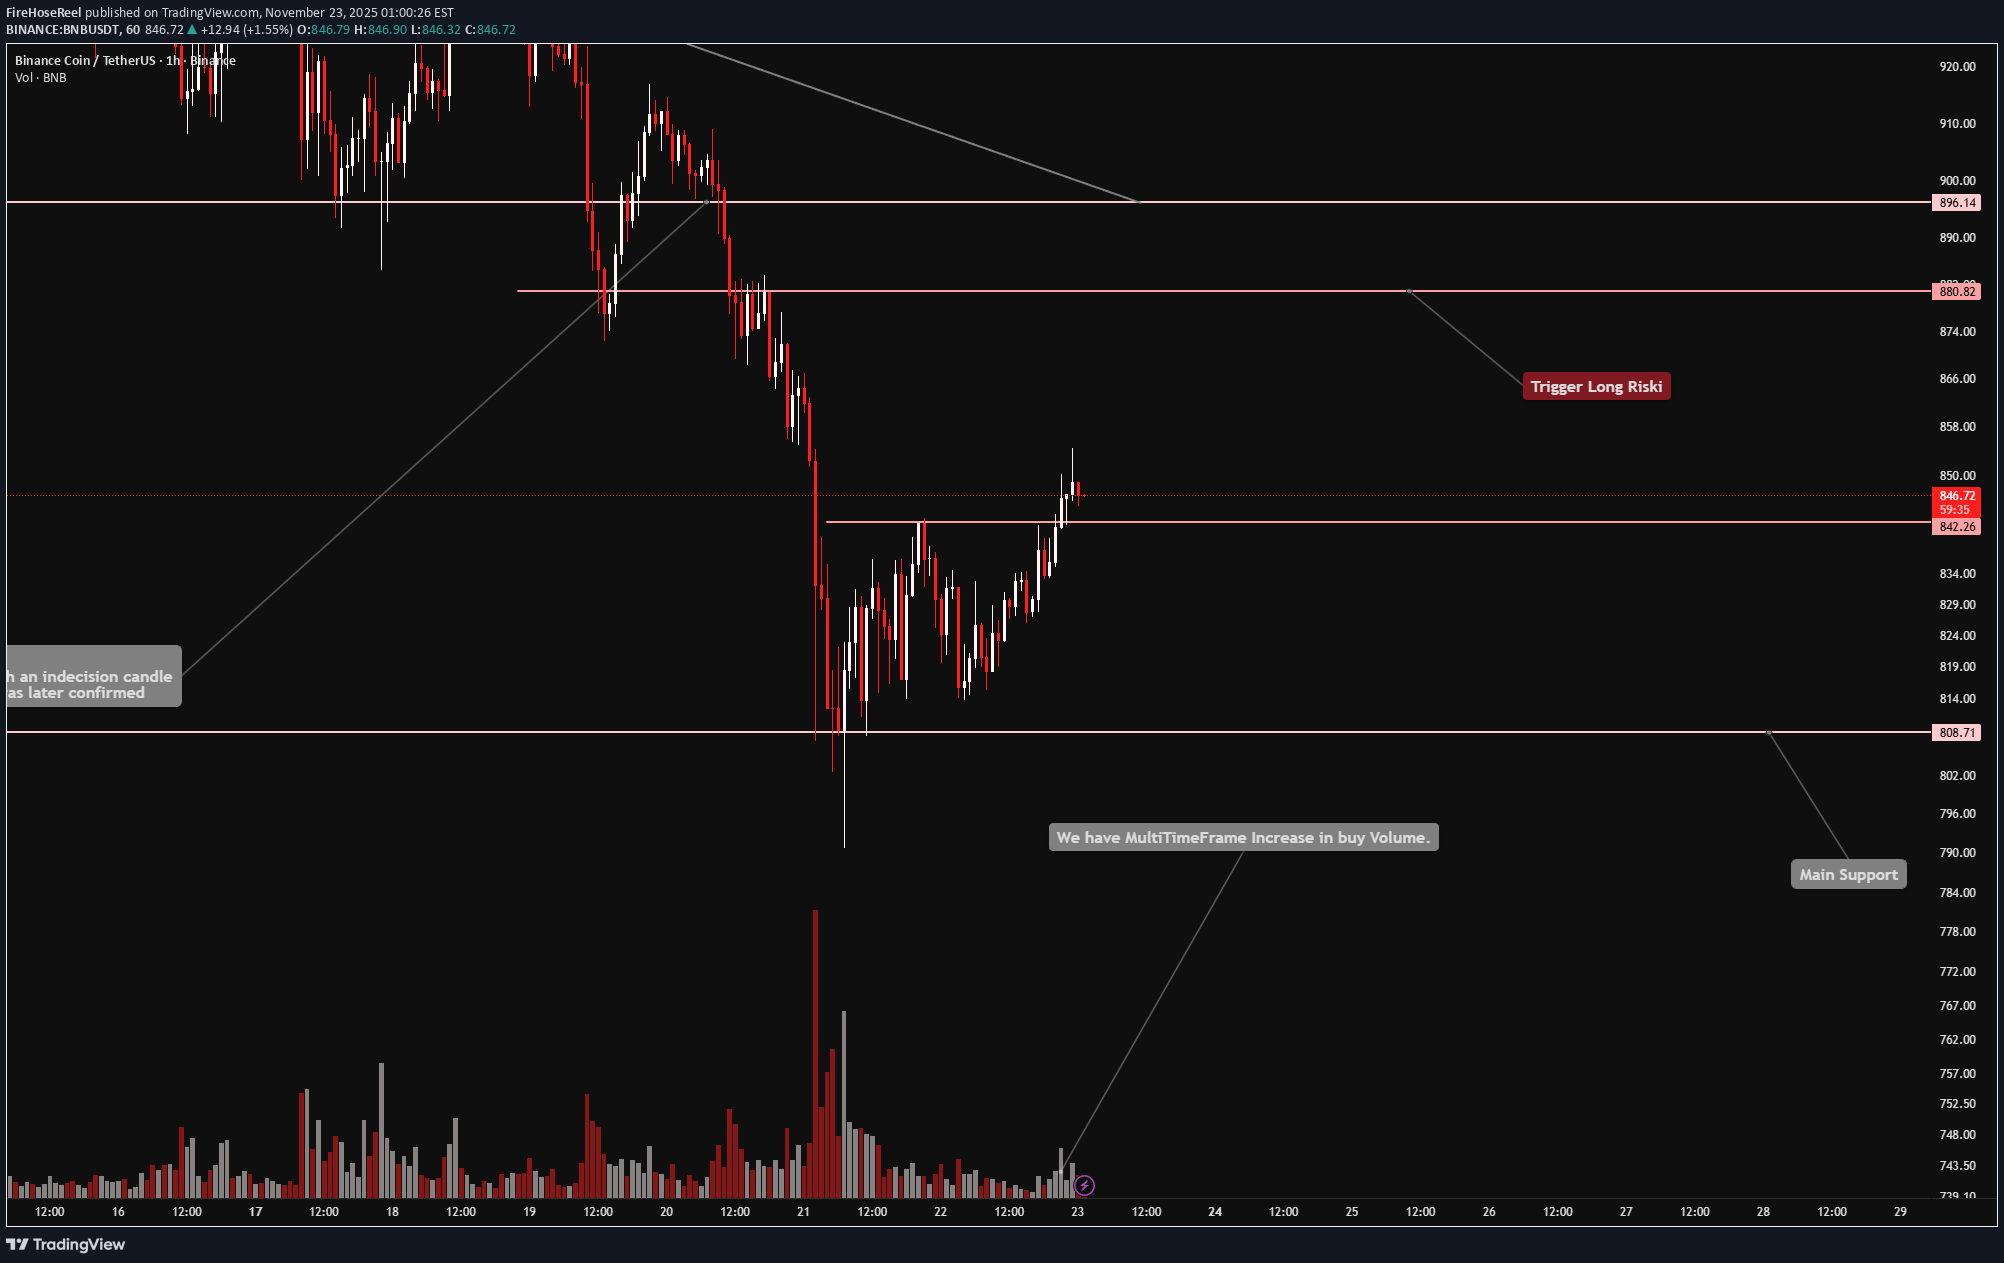
🔥 Welcome FireHoseReel ! Let’s dive into the analysis of BNB (Binance Coin). 👀 BNB – 1H Timeframe BNB is currently breaking through its multi-timeframe resistance around $842. If price forms a higher low above this zone, we can take it as a valid confirmation for bullish continuation. Keep in mind: the long trigger sits at $880, which makes this setup a bit risky. 📊 Volume Analysis The volume indicator is showing rising multi-timeframe buy volume, which is different from previous behavior on the left side of the chart. This suggests a healthy convergence of buying pressure, showing that sellers are weakening, market fear is fading, and investors are slowly stepping back in to accumulate at these levels. ✔️ BNB/BTC Pair Perspective To look at things differently, we also check the BNB/BTC pair, which helps us understand the structure more deeply. The pair is still in the same condition as yesterday, with one difference: The multi-timeframe resistance at 0.0991 could become a risky long trigger. A breakout above this zone may push momentum into the BNB/USDT pair as well. ✍️ Let’s break down the trading scenarios for BNB on the 1H timeframe. 🔼 Long Scenario: We need: • Strong buyer support and increased participation • Continued multi-timeframe volume convergence • Breakout of key resistance zones on both BNB/USDT and BNB/BTC If these conditions align, we can take a low-risk (0.5%) long entry on the breakout. If needed, we can also add to the position on higher resistance breakouts. 🔽 Short Scenario: A breakdown of the key support levels on the chart + clear selling pressure can give us a valid short or exit signal. This breakdown may also require a break of USDT dominance resistance, which would strengthen the bearish move. 🛞 Risk Management & Disclaimer Please remember to always use proper risk management and position sizing. Nothing in this analysis is financial advice. The market can change quickly, so always trade based on your own strategy, research, and risk tolerance. You are fully responsible for your own trades.
تحلیل روزانه BNB: حمایت ۸۰۸ دلار کجاست؟ سناریوهای صعود و نزول
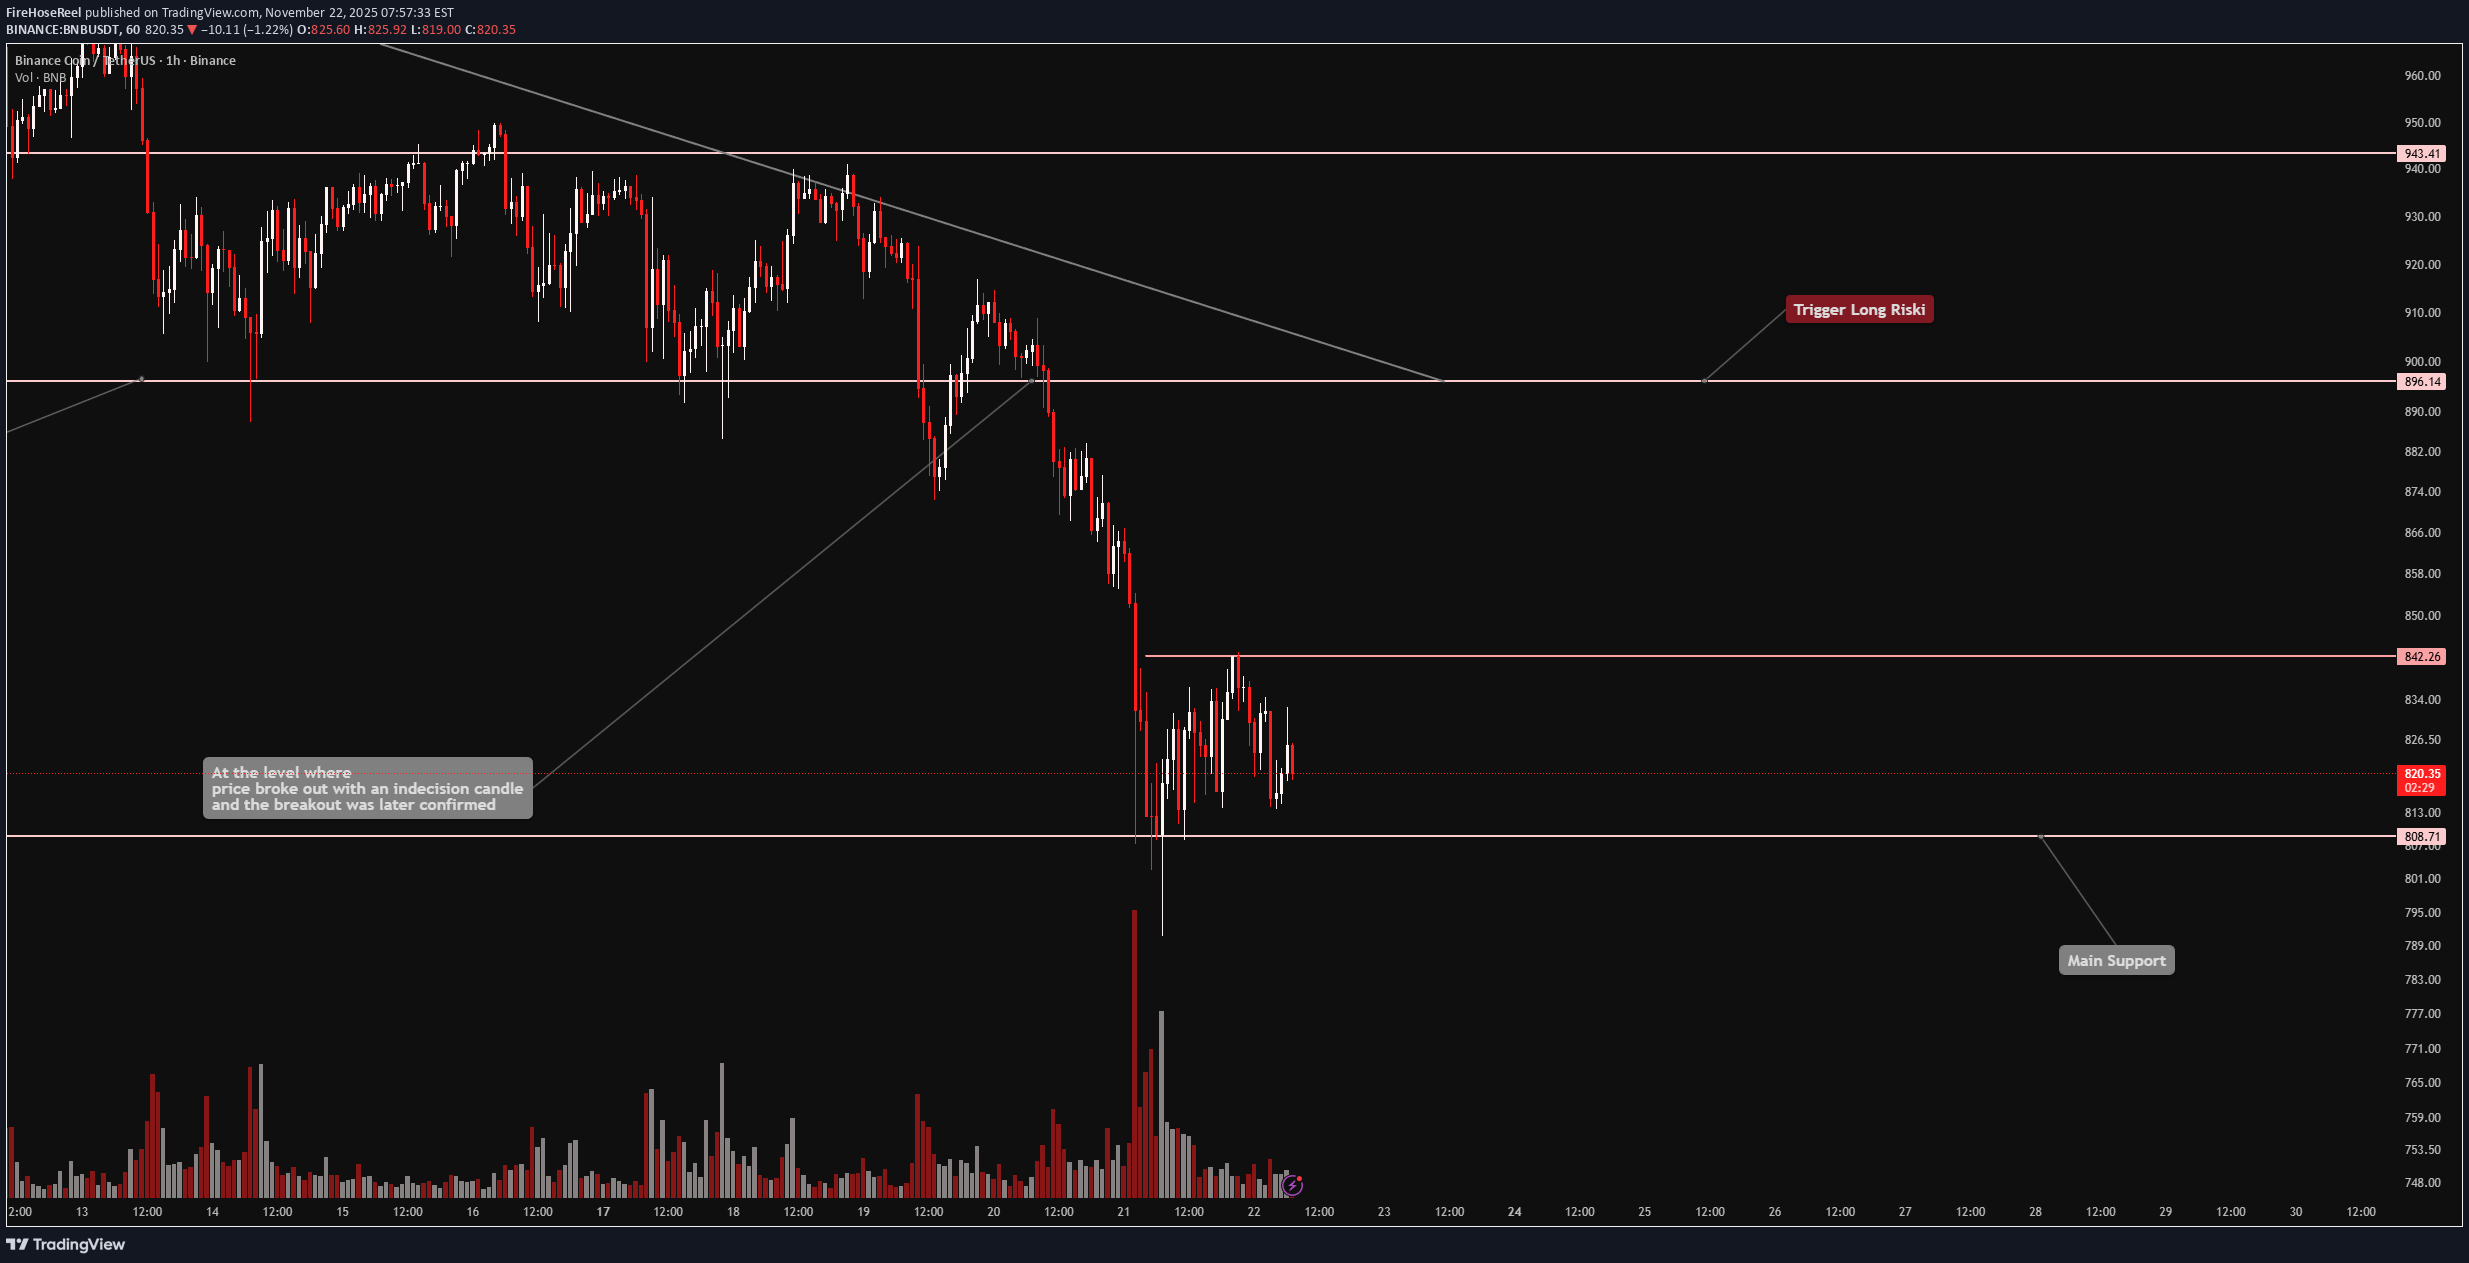
🔥 Welcome FireHoseReel ! Let’s dive into the analysis of BNB (Binance Coin). 👀 BNB – 1H Timeframe On the 1-hour chart, BNB has formed a solid support around $808.17, right after the drop we mentioned in previous analyses. Price also has a local resistance at $842.26, and a breakout on either side can give us confirmation for the next move. However, going long from this zone is not ideal. A long setup would be more reasonable at higher levels during a pullback of this bearish leg — and for that, we need USDT dominance to reject downward. 📊 Volume Analysis Looking at volume, one key detail stands out: The multi-timeframe correction of this bearish move has come with decreasing buy volume. If price moves back down and breaks the support again, we can look for a fresh short position. ✔️ BNB/BTC Pair Analysis Since we analyze things differently, let’s also check the BNB/BTC pair. This pair is currently sitting on its own support and moving slightly upward. But what matters is this: BNB/BTC seems to be forming a potential bearish pattern on this timeframe. If the structure completes, I’ll include it in the next analysis update for you. ✍️ Now let’s check the trading scenarios for BNB on the 1H timeframe. 🔽 Short Scenario A short setup becomes valid if: • BNB/BTC breaks below 0.009691, • Confluence with BNB price breaking below $808.71, • Increased sell volume, • A clean candle close under the defined support zones. This combination gives us a strong short trigger. 🔼 Long Scenario A long setup requires: • Breakout above $896, • A few retests (rejections) into this zone, • Followed by a confirmed breakout with increased buy volume. This long scenario is still far from current price, and once BNB reaches that zone, I’ll post the best updated scenario for you. 🛞 Risk Management & Disclaimer Please remember to always use proper risk management and position sizing. Nothing in this analysis is financial advice. The market can change quickly, so always trade based on your own strategy, research, and risk tolerance. You are fully responsible for your own trades.

nowewithoutuandi
آیا واقعاً باید منتظر بازگشت BNB بمانید؟ (رازهای سرمایهگذاری ارز دیجیتال)
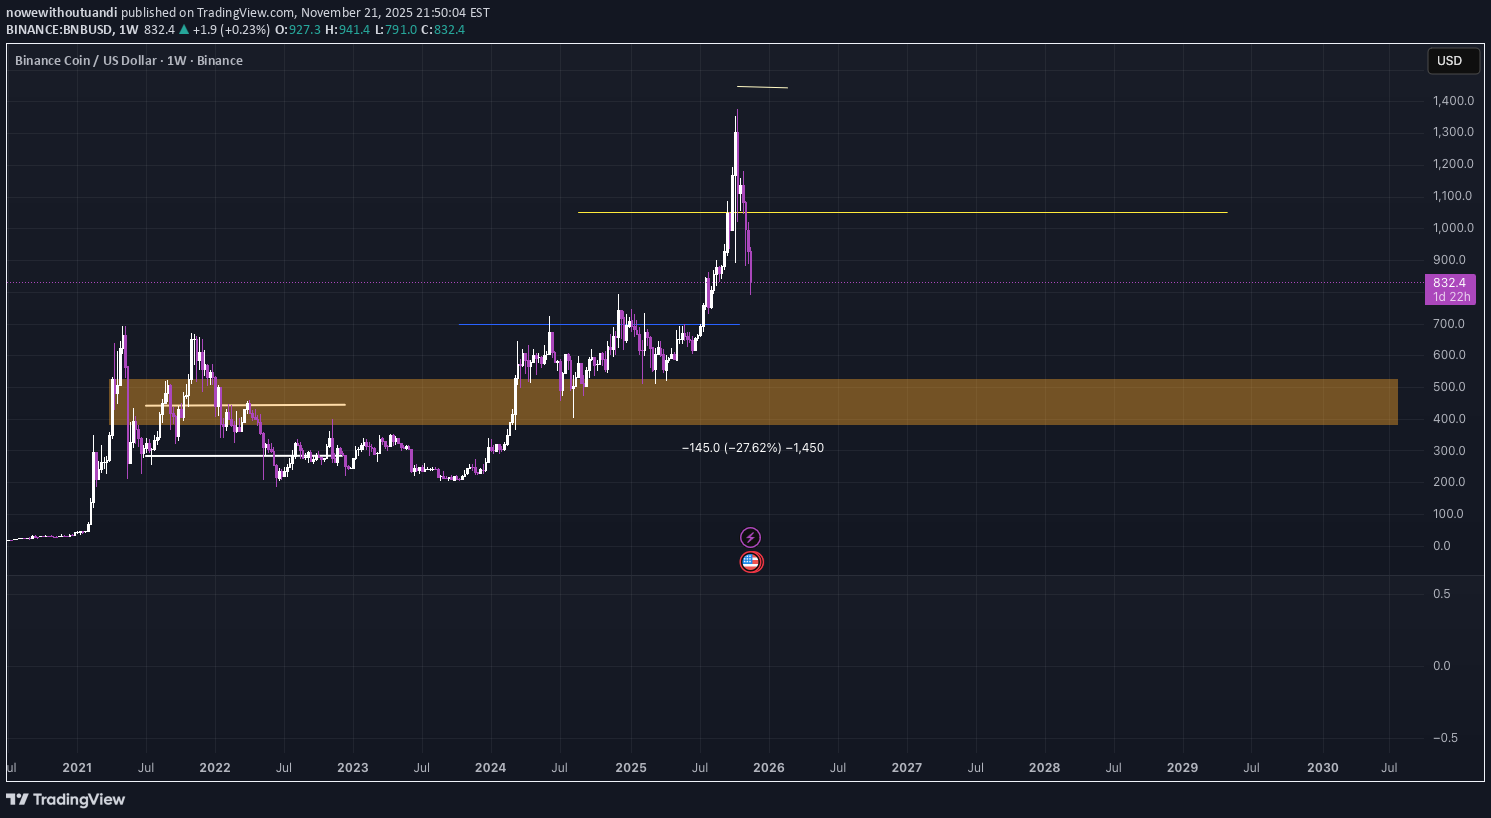
Waiting and patient but do you really want BNB in your port?

Kiu_Coin
تخفیف ۴۰ درصدی BNB: آیا این آخرین فرصت قبل از پامپ بعدی است؟
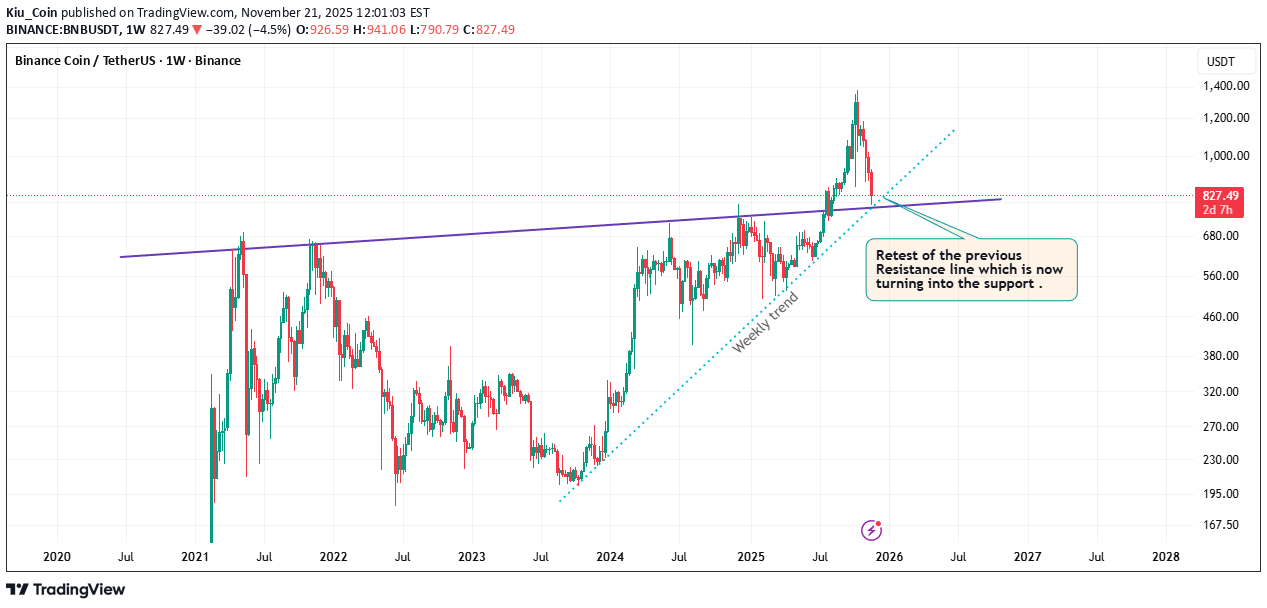
🐺 Hello Traders 🐺 Most of you probably felt the shock when BNB went straight up parabolic — and many regretted not buying when it was sitting right at that critical zone before the massive 80% pump. But here’s the good news: right now we’ve got another chance. BNB is trading at about a 40% discount compared to 42 days ago — and in my opinion, this could be a solid opportunity. Let me break down why 👇 1️⃣ BTC.D Situation BTC Dominance is still in a downtrend, and we’re sitting at a very critical support level. In my view, this support is about to break sooner rather than later. (You can check my last idea here for more details: If BTC.D loses this level, altcoins could finally get their moment to shine. 2️⃣ BTC Structure BTC itself looks bearish, but it’s very close to the next support zone. That could give altcoins some breathing room — a short retrace, maybe even a small pump across the altcoin sector. 3️⃣ BNB vs BTC BNB/BTC looks strong. Whenever a coin shows strength against BTC, it usually means it’s ready to outperform while BTC is bleeding or consolidating around support. That’s exactly what BNB is signaling right now. 4️⃣ Technical Analysis (TA) The chart itself looks solid: - Price is holding above the purple monthly resistance line, which has now flipped into support. - It’s still above the weekly trend line. - In my opinion, this recent drop was just a retest of the previous resistance zone — shaking out weak hands and testing the bulls’ conviction. 🐺 Conclusion BNB already proved it can go parabolic. Now, with BTC.D at critical support, BTC near its own support, and BNB/BTC showing strength, the setup looks promising. This doesn’t mean “guaranteed profits” — but it does mean we’re looking at a high-probability zone where discipline and patience could pay off. So make sure to remember our golden rule : Discipline is rarely enjoyable, but almost always profitable . 🐺 KIU_COIN 🐺

BNB سقوط کرد! هدف ۸۵۰ دلار محقق شد؛ چه اتفاقی افتاد؟
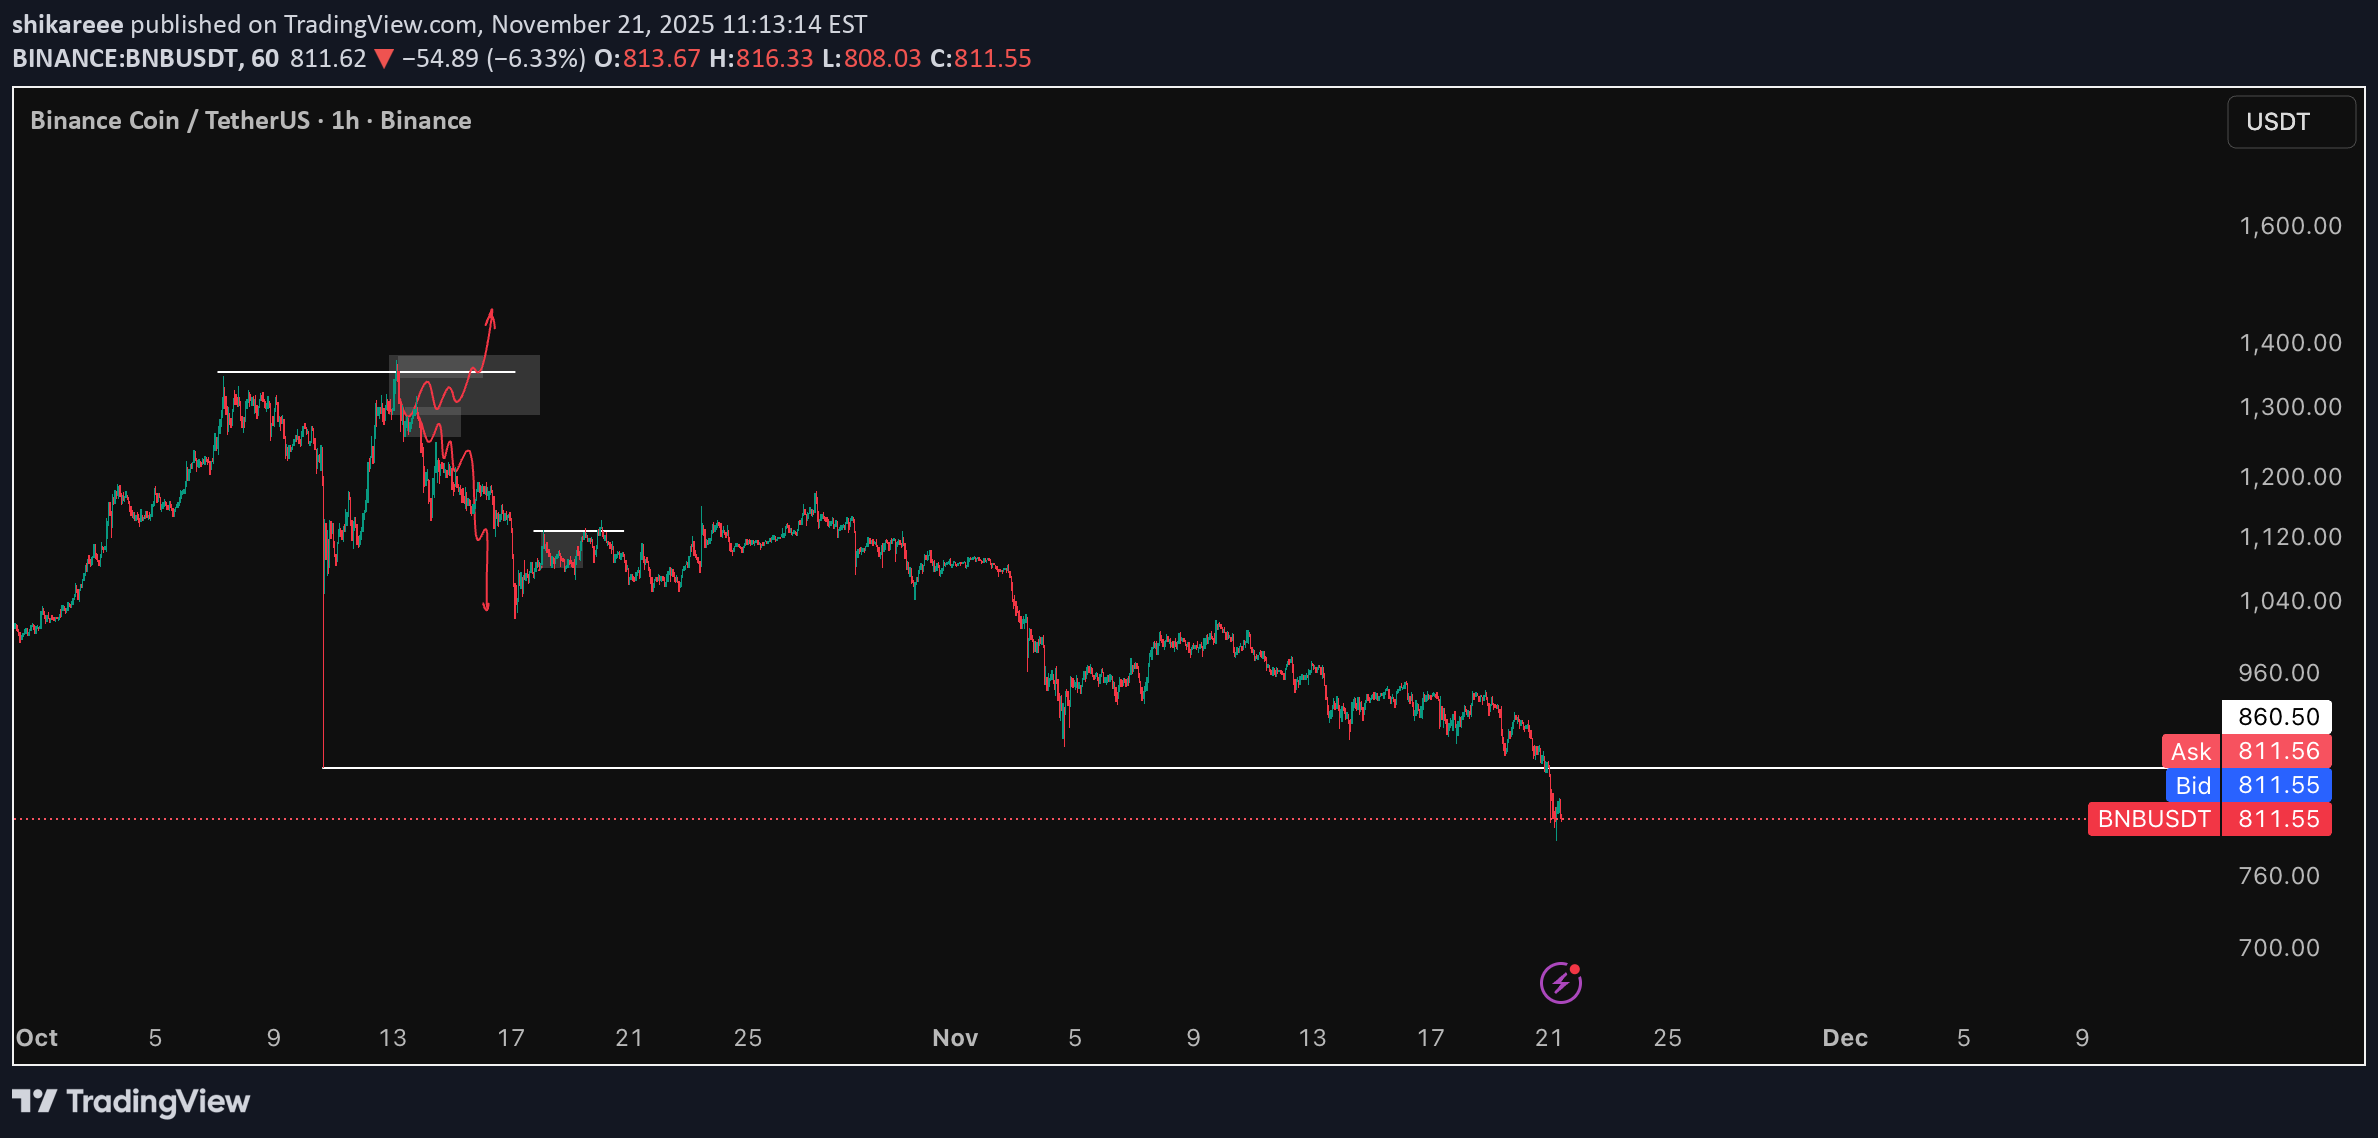
This is a follow up post for my call a month ago. After seeing the highs get taken I knew that BNB was going to be bearish if the 1200 level doesnt hold. Here we are..
تحلیل روزانه بیتکوین کش (BNB): منتظر سیگنال جدید بمانید!
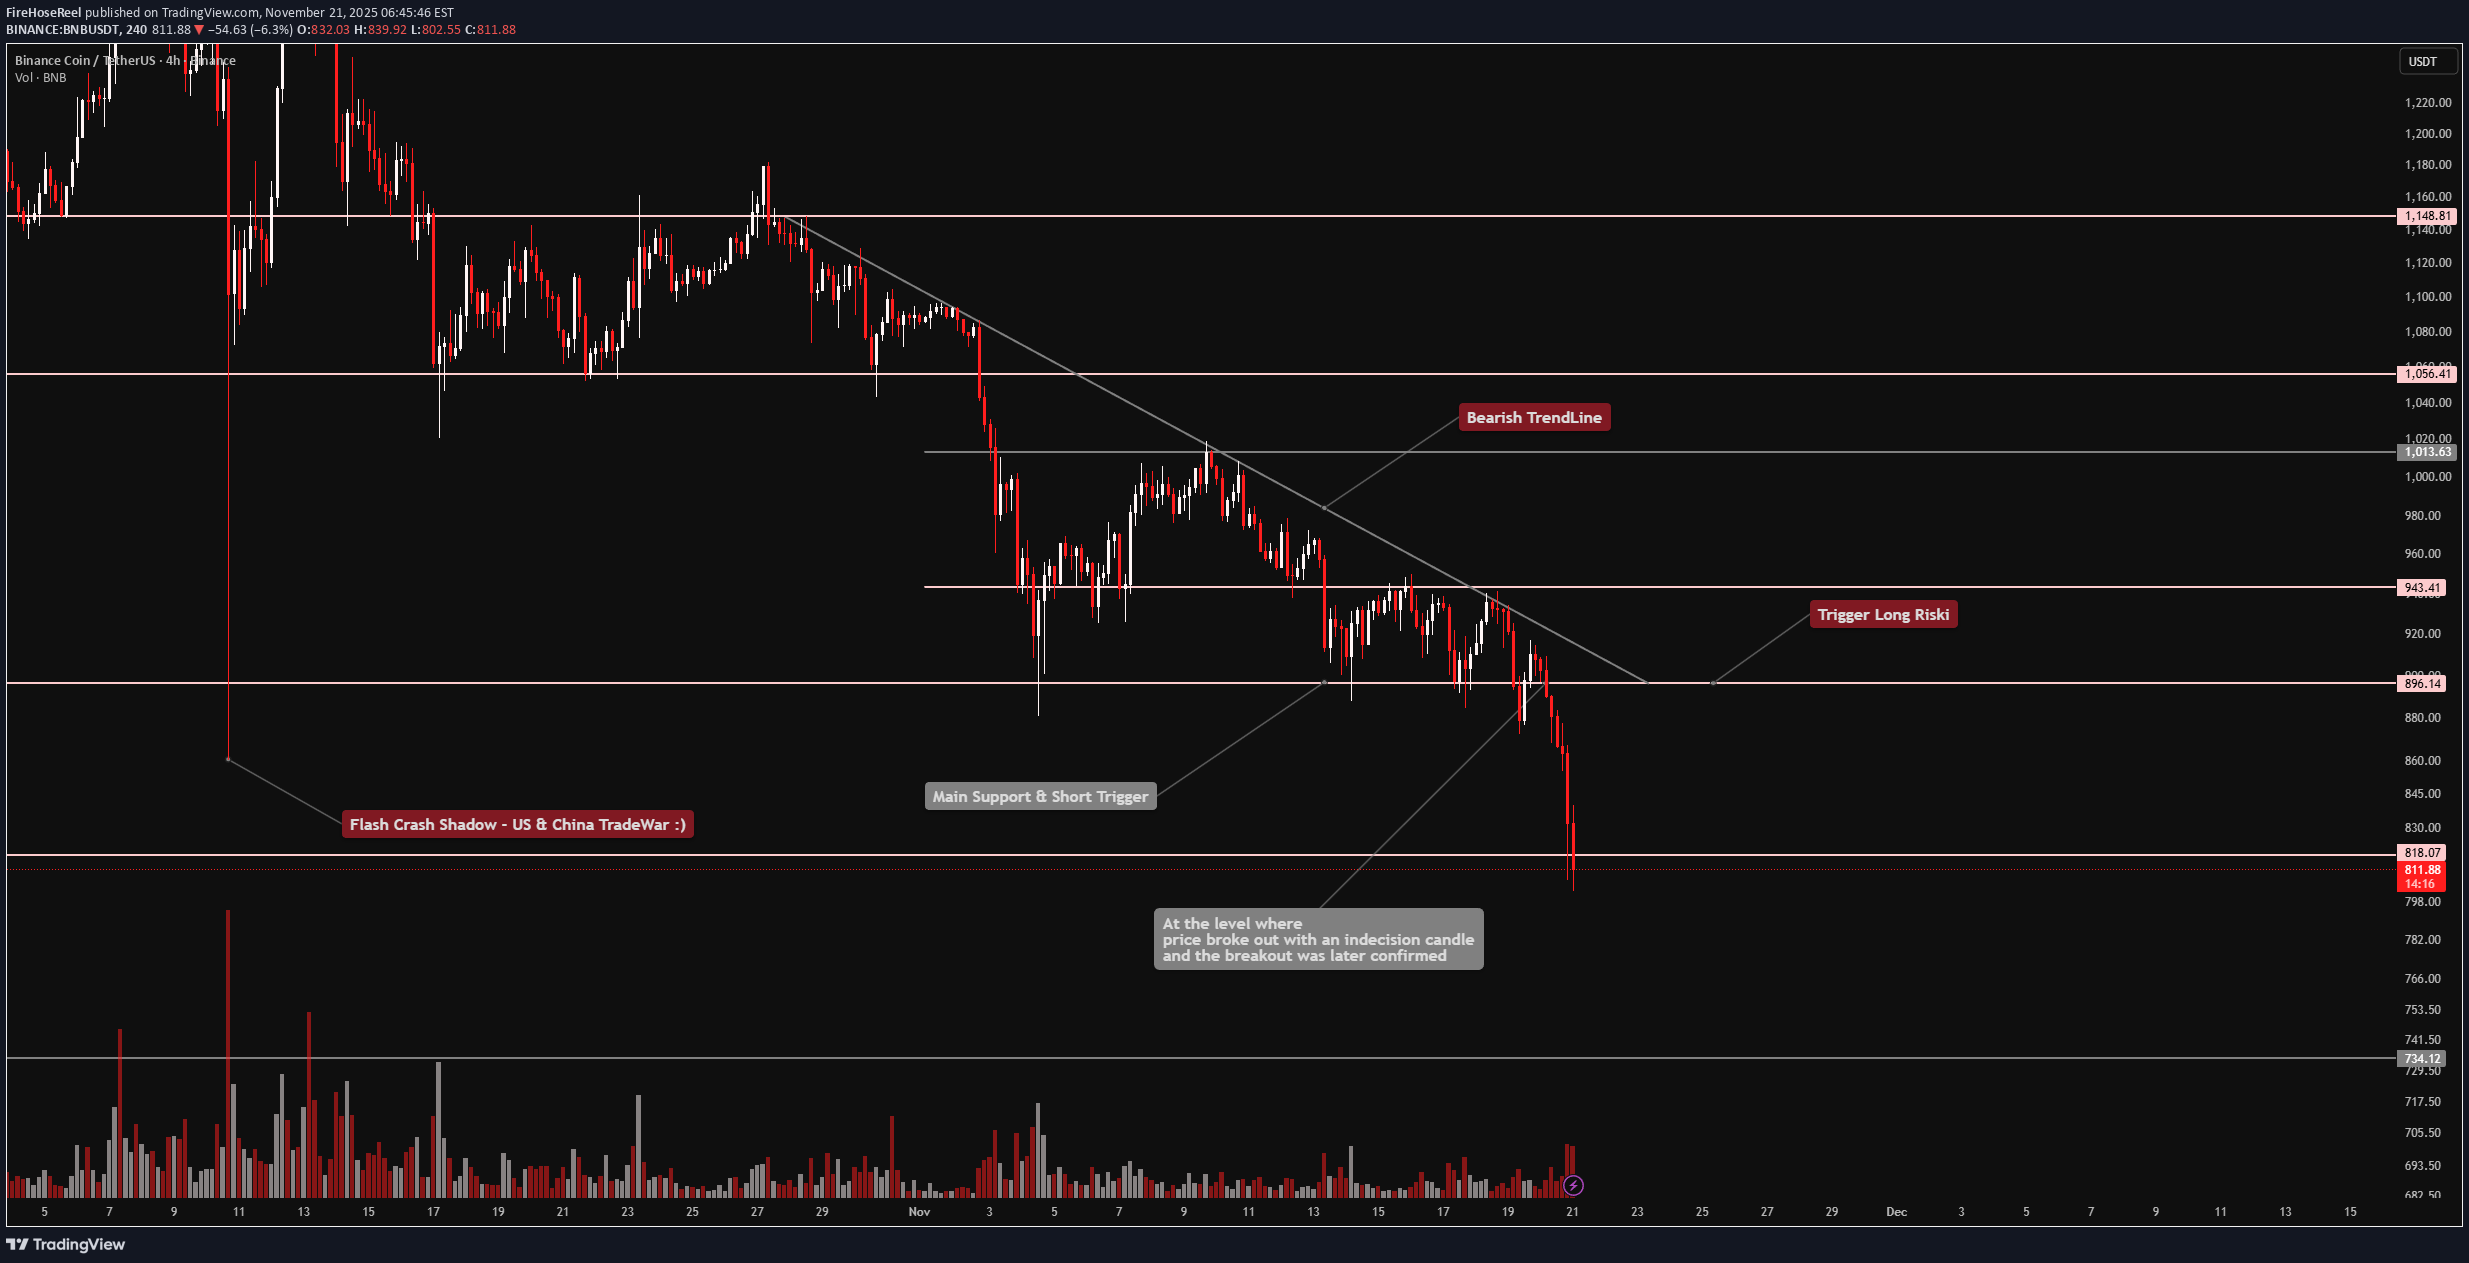
😄 Hey! How’s everything? Hope you’re doing great! 🍾 Welcome to FireHoseReel — make sure to follow and enjoy the analysis along the way. If you ever want a custom chart breakdown, just leave a comment and I’ve got you. 😎 Now let’s jump into the analysis of my favorite coin: BNB . 👀 BNB – 4H Timeframe BNB recently gave us a short trigger on the 4-hour chart after breaking its key support at $896. Price dropped right toward our first target at $818, hit it cleanly, and is now stuck in a “mid-zone” with no clear direction. Even on a multi-timeframe view, we currently don’t have any valid entry trigger, so we need to wait for new structure formation before planning the next move. 📊 Volume Analysis Our volume indicator played a major role here: Once the support broke and the short trigger activated — exactly as mentioned in yesterday’s analysis — sell pressure increased sharply. Whales also started selling their BNB as soon as the support failed, and many traders used this opportunity to enter short positions. Volume is still showing bearish pressure, and the last two 4H candles had a strong increase in selling activity, turning into clear downward momentum. ✔️ Now let’s analyze something different — BNB/BTC pair On the 4H timeframe, this pair is still moving inside its trading range and has managed to maintain its relative strength against BTC. However: • A breakout above the range high at 0.010162 could trigger a strong bullish move • A breakdown below the range low at 0.009800 could lead to a deeper correction in the BNB/USDT pair and accelerate the bearish momentum there For now, the pair holds a bullish bias, but we need confirmation through an actual breakout. ✍️ Current Scenarios We don’t have a new setup today, as yesterday’s short position already played out and is still valid. For a new entry — long or short — we need BNB to build a fresh market structure and give us a clean trigger. Until then, patience is the best strategy. 🛞 Risk Management & Disclaimer Please remember to always use proper risk management and position sizing. Nothing in this analysis is financial advice. The market can change quickly, so always trade based on your own strategy, research, and risk tolerance. You are fully responsible for your own trades.

آیا ریزش بیت کوین (BNB) ادامه دارد؟ تحلیل فنی حرکت نزولی

The RSI divergence, even after several failed breaks, eventually played out nicely, and we got a solid move down from the peak levels. I’m starting to gradually close my short position (in profit). Since the trade has been open for quite a while, the accumulated funding is a nice bonus as well. As price approaches the lower trendline, I’ll close 50% of the position and move my stop to breakeven (entry price). A small bounce from here is possible. The trendline on the weekly chart aligns with a strong Fibonacci level (0.618) on the 4H timeframe, so if we consolidate below this level, the move down can easily continue.
isahebdadi
سرنوشت قیمت BNB: آیا این برگشت است یا آغاز یک اصلاح عمیق؟
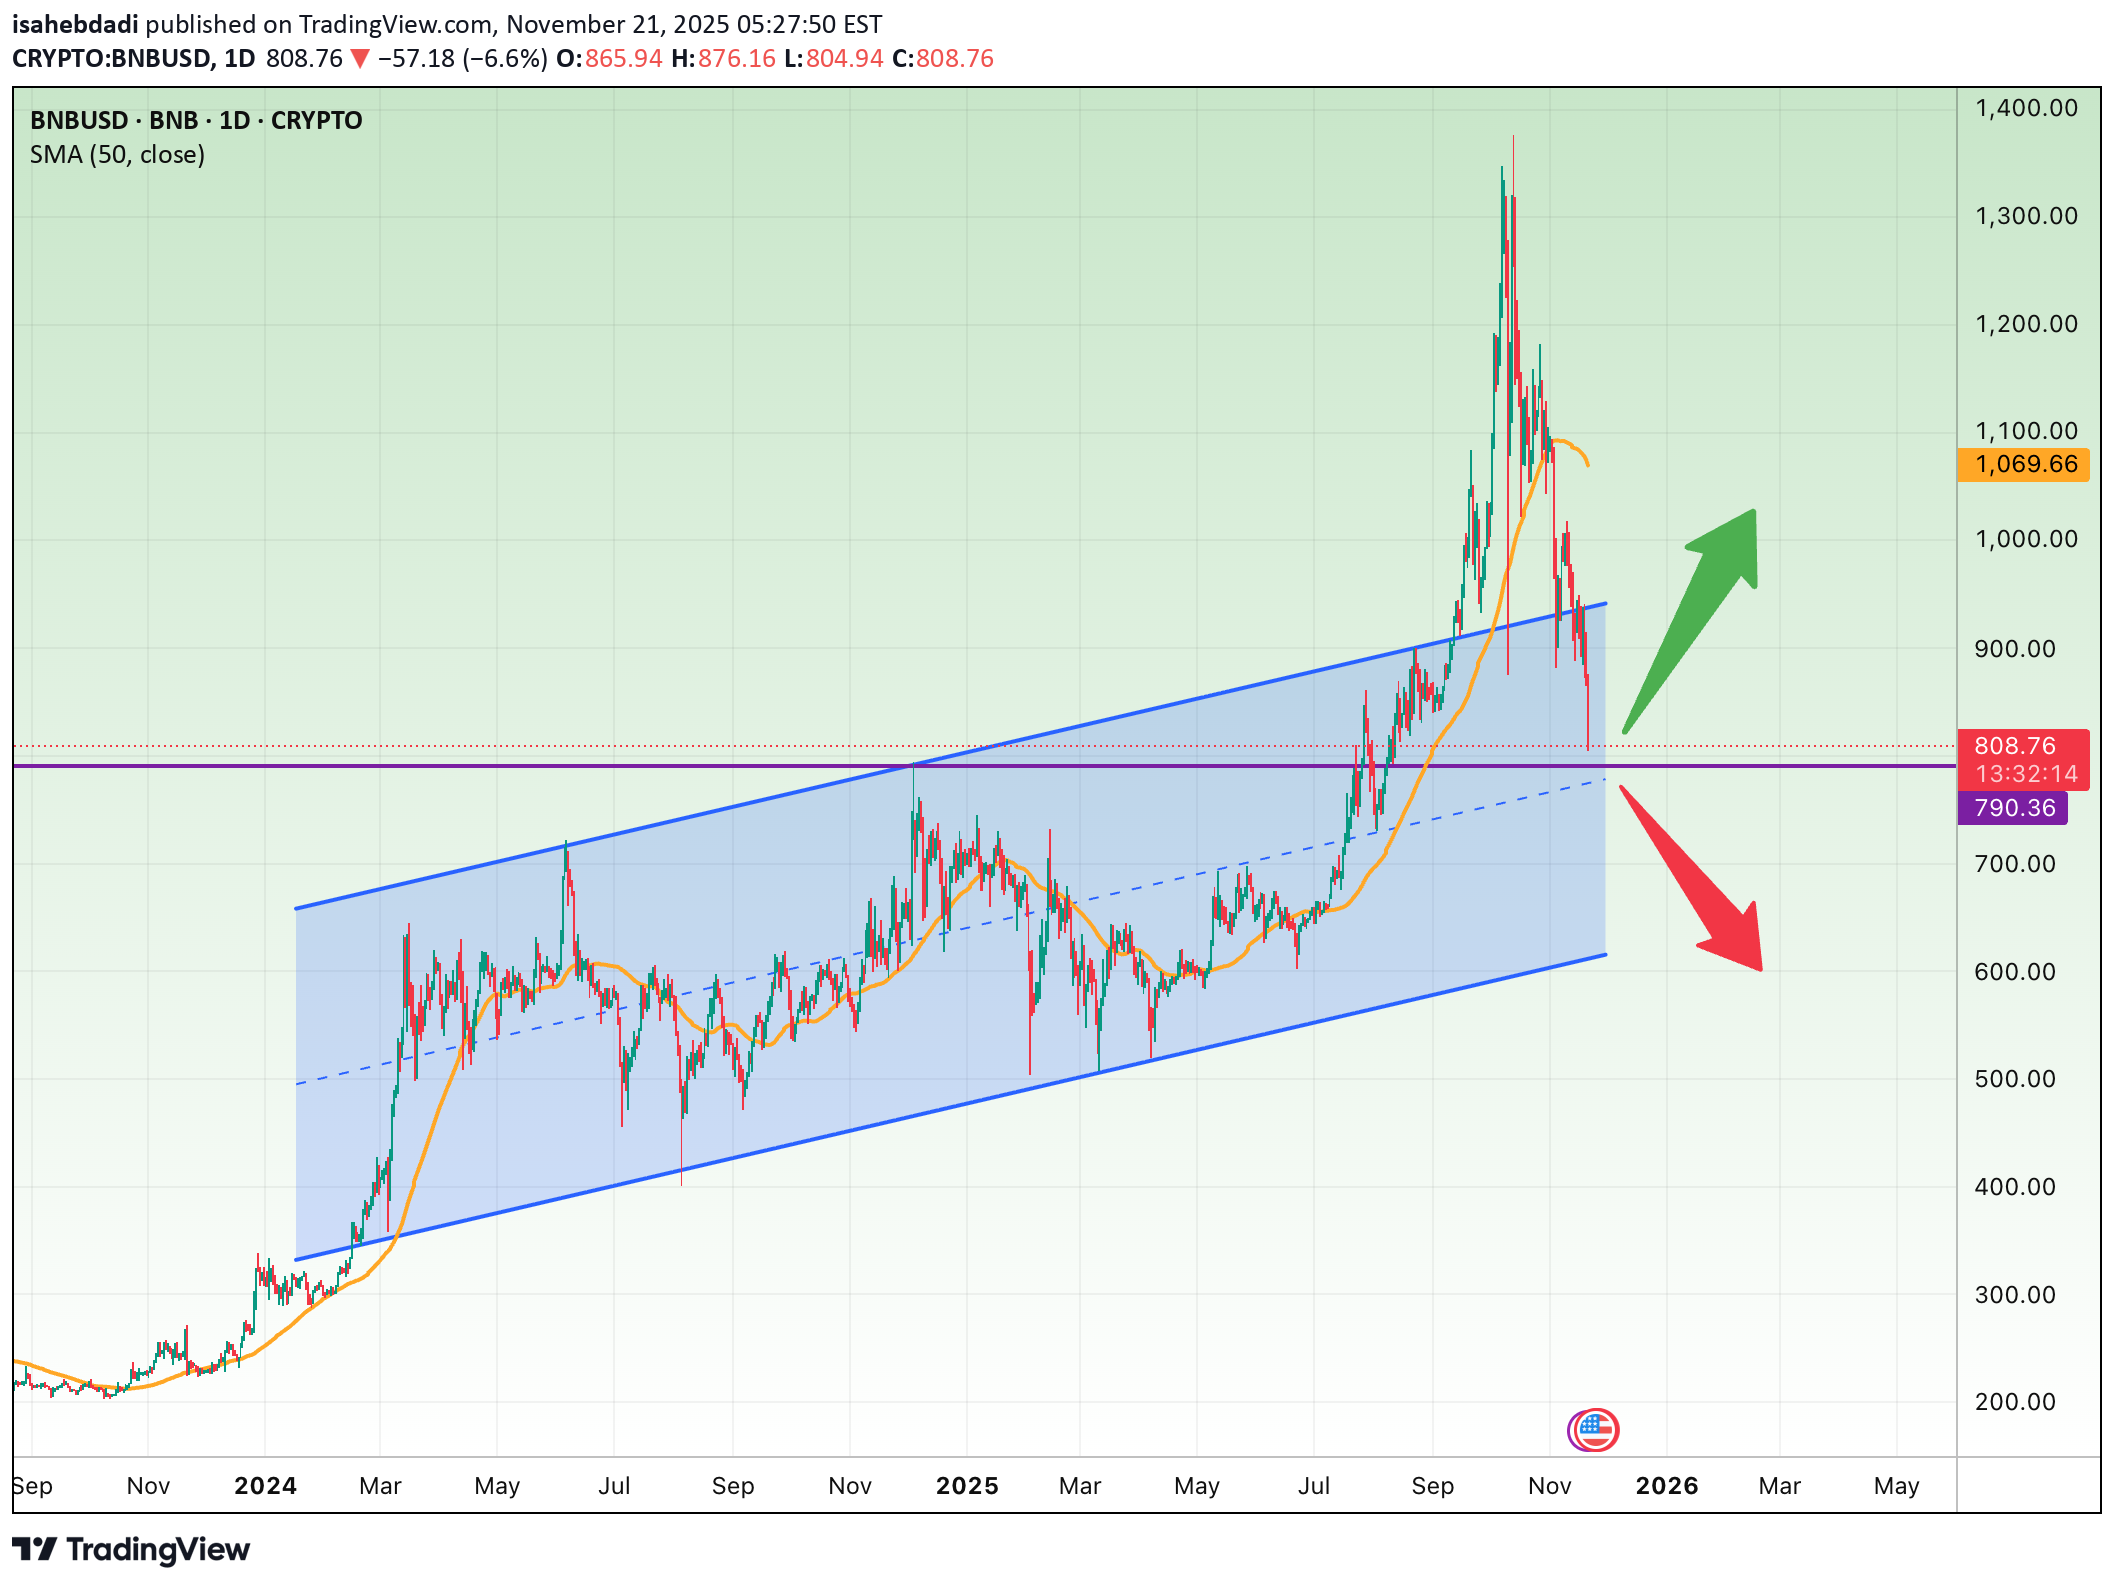
BNB has pulled back sharply from its parabolic run above $1,300, and price is now sitting exactly on the bottom boundary of the rising channel that has guided the trend since late 2023. This area is extremely important because: •It is the channel support •It aligns with a previous consolidation zone •It’s very close to the 50-day SMA retest zone (which BNB often respects) If this support holds, BNB could stage a recovery rally. But if it breaks down, the chart opens the door to a much deeper correction. Bullish Scenario (If channel support holds) Entry Zone: $780–$820 (BNB is currently inside this zone) Target 1: $987 – This is the next major resistance and midpoint of the previous structure. Target 2: $1,070–$1,100 – Retest of the recent breakdown area and 50-day SMA region. Target 3 (extended): $1,250+ – Only if momentum continues and BTC supports the market. Bearish Scenario (If price loses the channel) A breakdown from the channel plus a daily close below $790 would confirm weakness. Downside Targets: •$700 — First Fibonacci + structural support •$620 — Major support zone from 2024 •$500–$520 — Full channel breakdown target Stop-Loss Suggestion •Stop-loss (swing trade): $760 – A daily close below this level means the channel is broken. •Tighter stop-loss (short-term): $780 Summary BNB is sitting on a critical support level. Hold → strong bounce potential. Break → deep correction likely.
Disclaimer
Any content and materials included in Sahmeto's website and official communication channels are a compilation of personal opinions and analyses and are not binding. They do not constitute any recommendation for buying, selling, entering or exiting the stock market and cryptocurrency market. Also, all news and analyses included in the website and channels are merely republished information from official and unofficial domestic and foreign sources, and it is obvious that users of the said content are responsible for following up and ensuring the authenticity and accuracy of the materials. Therefore, while disclaiming responsibility, it is declared that the responsibility for any decision-making, action, and potential profit and loss in the capital market and cryptocurrency market lies with the trader.