
tomas_jntx
@t_tomas_jntx

What symbols does the trader recommend buying?
Purchase History
پیام های تریدر
Filter
tomas_jntx
RSI Is Not a Signal

RSI is one of the most widely used tools in trading, yet it is also one of the most misunderstood. Many traders approach it as a switch. When the line reaches a certain level, they expect price to react. When it does not, frustration follows. The issue is not the indicator itself, but the expectations placed on it. RSI reflects how aggressively price has been moving over a recent period. It gives insight into pressure, participation, and pacing. What it does not do is decide when price should reverse or continue. Markets can remain stretched far longer than most traders anticipate, especially during strong trends. When that happens, RSI staying elevated or depressed is a sign of persistence rather than exhaustion. Context changes everything. In a clearly trending market, RSI often settles into a higher or lower band and fluctuates within it. Pullbacks that look extreme on the oscillator are often normal pauses in price rather than warnings of a reversal. Traders who react to those readings without considering structure often find themselves trading against the dominant flow. Range-bound conditions tell a different story. When price rotates between defined highs and lows, momentum naturally fades near the edges. In those environments, RSI extremes tend to align more closely with short-term turning points. The same indicator behaves differently because the market itself is behaving differently. Another source of confusion comes from fixed thresholds. Levels such as 30 and 70 are treated as universal rules, even though they were never meant to apply across all instruments and conditions. Some markets trend with RSI rarely dropping below 40. Others rotate for weeks without ever reaching classical extremes. Blindly applying static levels removes nuance from decision-making. RSI becomes useful when it is read as part of a broader process. Structure, liquidity, and location should come first. Momentum then helps assess whether price behavior supports the idea or raises caution. When used this way, RSI adds clarity instead of pressure. Traders who struggle with RSI are often searching for certainty. RSI does not provide certainty. It provides information. Those who learn to interpret that information within market context stop forcing trades and start aligning with what price is actually doing.
tomas_jntx
XRP Reclaims MSB – Demand Reactivation in Progress

Trend Check: Recent MSB flip bullish. Price bouncing off demand zone, pushing back into the midrange. Indicators: RSI: 57.3 (bullish bias) MACD: Bullish momentum building Structure: Higher low at demand with strong bounce. Key level at $1.90–$1.95 now in sight. Position: Long bias Entry Idea: Long above $1.88 Stop: Below $1.84 Targets: $1.95 → $2.05 Reasoning: Bullish reversal showing strength. Needs confirmation breakout above $1.88–$1.90 to expand higher.
tomas_jntx
NEAR Eyes Breakout After MSB Recovery

Trend Check: Recovered from multiple bearish MSBs with a recent bullish flip. Back at resistance near $1.55–$1.60. Indicators: RSI: 50.0 (neutral) MACD: Bullish crossover with increasing momentum Structure: Clean higher low formed, attempting to break past previous supply. Eyes on reclaim of $1.55 zone. Position: Long bias Entry Idea: Long above $1.56 Stop: Below $1.52 Targets: $1.62 → $1.70 Reasoning: Structure improving with positive indicators. Breakout could accelerate momentum.
tomas_jntx
ENA Holds MSB – Can Bulls Reclaim $0.215?

Trend Check: After flipping MSB bullish, price pulled back sharply but is holding support above $0.20. Consolidating under supply. Indicators: RSI: 45.8 (neutral) MACD: Flat after a recent bearish cross Structure: Bullish MSB held, now ranging. Resistance remains at $0.215–$0.218, support near $0.20. Position: Long bias (if reclaimed) Entry Idea: Long above $0.211 Stop: Below $0.202 Targets: $0.218 → $0.225 Reasoning: Clean reaction at prior demand, but breakout needed for continuation. Watching structure reclaim.
tomas_jntx
ICP Rejected From Supply – Weak Structure Returns

Trend Check: MSBs flipped both ways, but bearish OB rejection capped the rally. Price now rolling over under $3. Indicators: RSI: 33.2 (weak) MACD: Bearish cross with momentum rising Structure: Lower highs and rejection from OB zone ($3.1–$3.3). No major demand until closer to $2.8. Position: Short bias Entry Idea: Short under $2.95 Stop: Above $3.05 Targets: $2.82 → $2.70 Reasoning: Bearish structure and clear rejection zone. Could continue to bleed without reclaim of $3.05.
tomas_jntx
DOGE Holds Key Demand Zone – Is a Rebound in Play?

Trend Check: DOGE retraced into a higher-timeframe demand zone and started to base above $0.121. Early signs of local recovery. Indicators: RSI: 51.9 (neutral recovery) MACD: Flat but curling bullish Structure: Price is holding demand after a clean tap into the green zone. Still needs MSB flip to confirm strength. Position: Long bias (speculative) Entry Idea: Long above $0.1245 Stop: Below $0.121 Targets: $0.1275 → $0.1300 Reasoning: Demand respected and momentum indicators are turning. Looking for confirmation via structure flip.
tomas_jntx
Mastering MACD
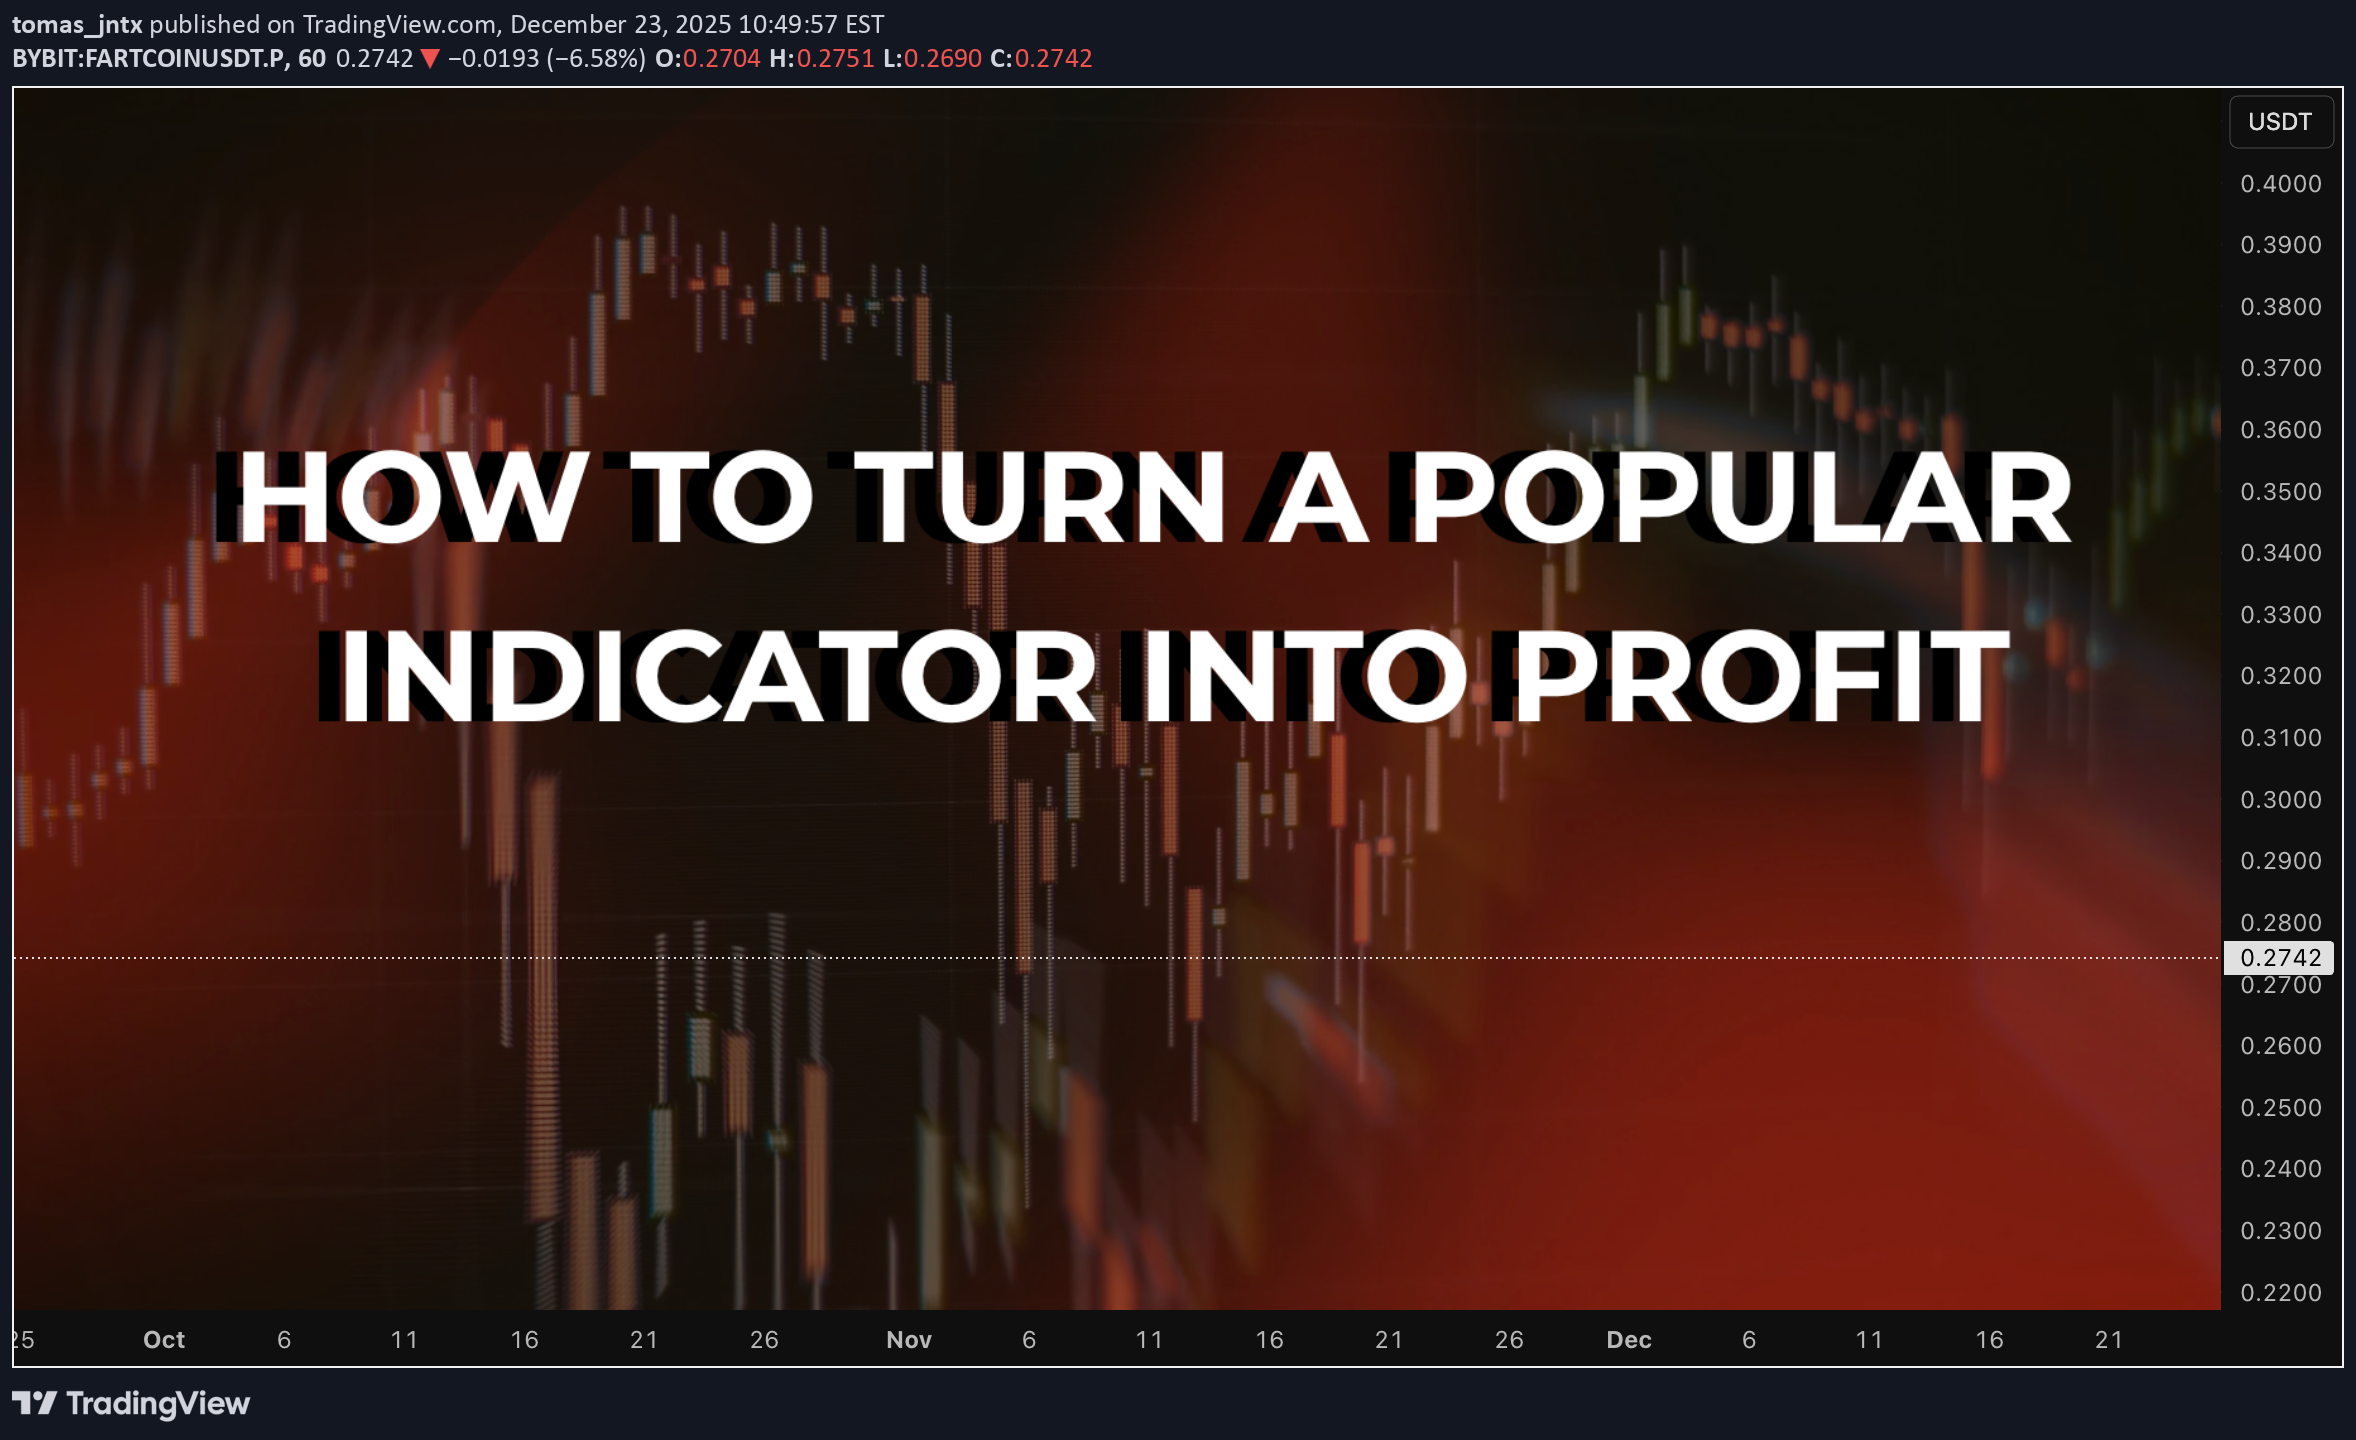
Turning a Popular Indicator Into a Structured Decision Tool Many traders use MACD as a simple signal generator. They see a crossover, enter a trade, and later realise the result does not match the expectation. MACD becomes useful only when it is applied inside a clear framework built on trend, momentum, and timing. Its real value lies in reading shifts in participation rather than delivering standalone entry signals. Understanding what the indicator represents is the first step. MACD measures the relationship between two moving averages and reveals how fast price is accelerating or slowing down. The histogram shows the rate of change. When used with intent, MACD helps you read the strength behind a move instead of trying to predict direction. Momentum confirms structure and brings clarity to the decision process. Define the market environment before looking at MACD. Trending markets and ranging markets produce different behaviours. In a trend, a rising histogram often supports continuation and helps you judge whether a pullback is healthy or the start of a deeper rotation. In a range, the histogram moves around the zero line and highlights areas where momentum is fading. Without this context, MACD signals tend to mislead more than they help. The next step is aligning MACD with the locations your system already relies on. Use it as part of the confluence, not as a trigger. When price reaches a higher-timeframe level, a liquidity area, or a clear structural pivot, the histogram can show whether momentum is shifting in your favour. You are not asking MACD to discover the trade. You are using it to confirm the logic you have prepared. With structure and location in place, create specific decision rules for MACD behaviour. Examples include shrinking momentum when price approaches a level, expansion that supports a breakout, crossovers that match the higher-timeframe direction, or divergences that signal exhaustion at important zones. Every rule needs to serve a practical purpose. Reacting to every crossover removes discipline and weakens the system. Well-defined conditions make MACD a reliable filter. Risk management remains outside the indicator. MACD does not define stops, invalidation, or how much to risk. Those rules come from structure. Stops should respect swing highs or lows, well-defined invalidation areas, or volatility-based distances. Combining this approach with MACD’s momentum read protects you from chasing trades that lack strength and reduces over-engagement during slow conditions. Validation closes the loop. Backtest the exact behaviours you rely on, not the indicator as a whole. Study how histogram shifts behave at your chosen levels. Compare momentum against structure. Track how timing improves when MACD is used to refine execution instead of generate entries. When the data confirms the rules across different market conditions, the system gains stability. MACD becomes a valuable asset when integrated into a disciplined process. On its own, it produces too much noise. Inside a structured system, it sharpens momentum reading, filters out weak trades, and builds cleaner execution. Traders who use MACD to support their framework instead of driving it achieve far greater consistency over time.
tomas_jntx
TRX Flips Bullish MSB and Pumps – Eyes on Retest of $0.280
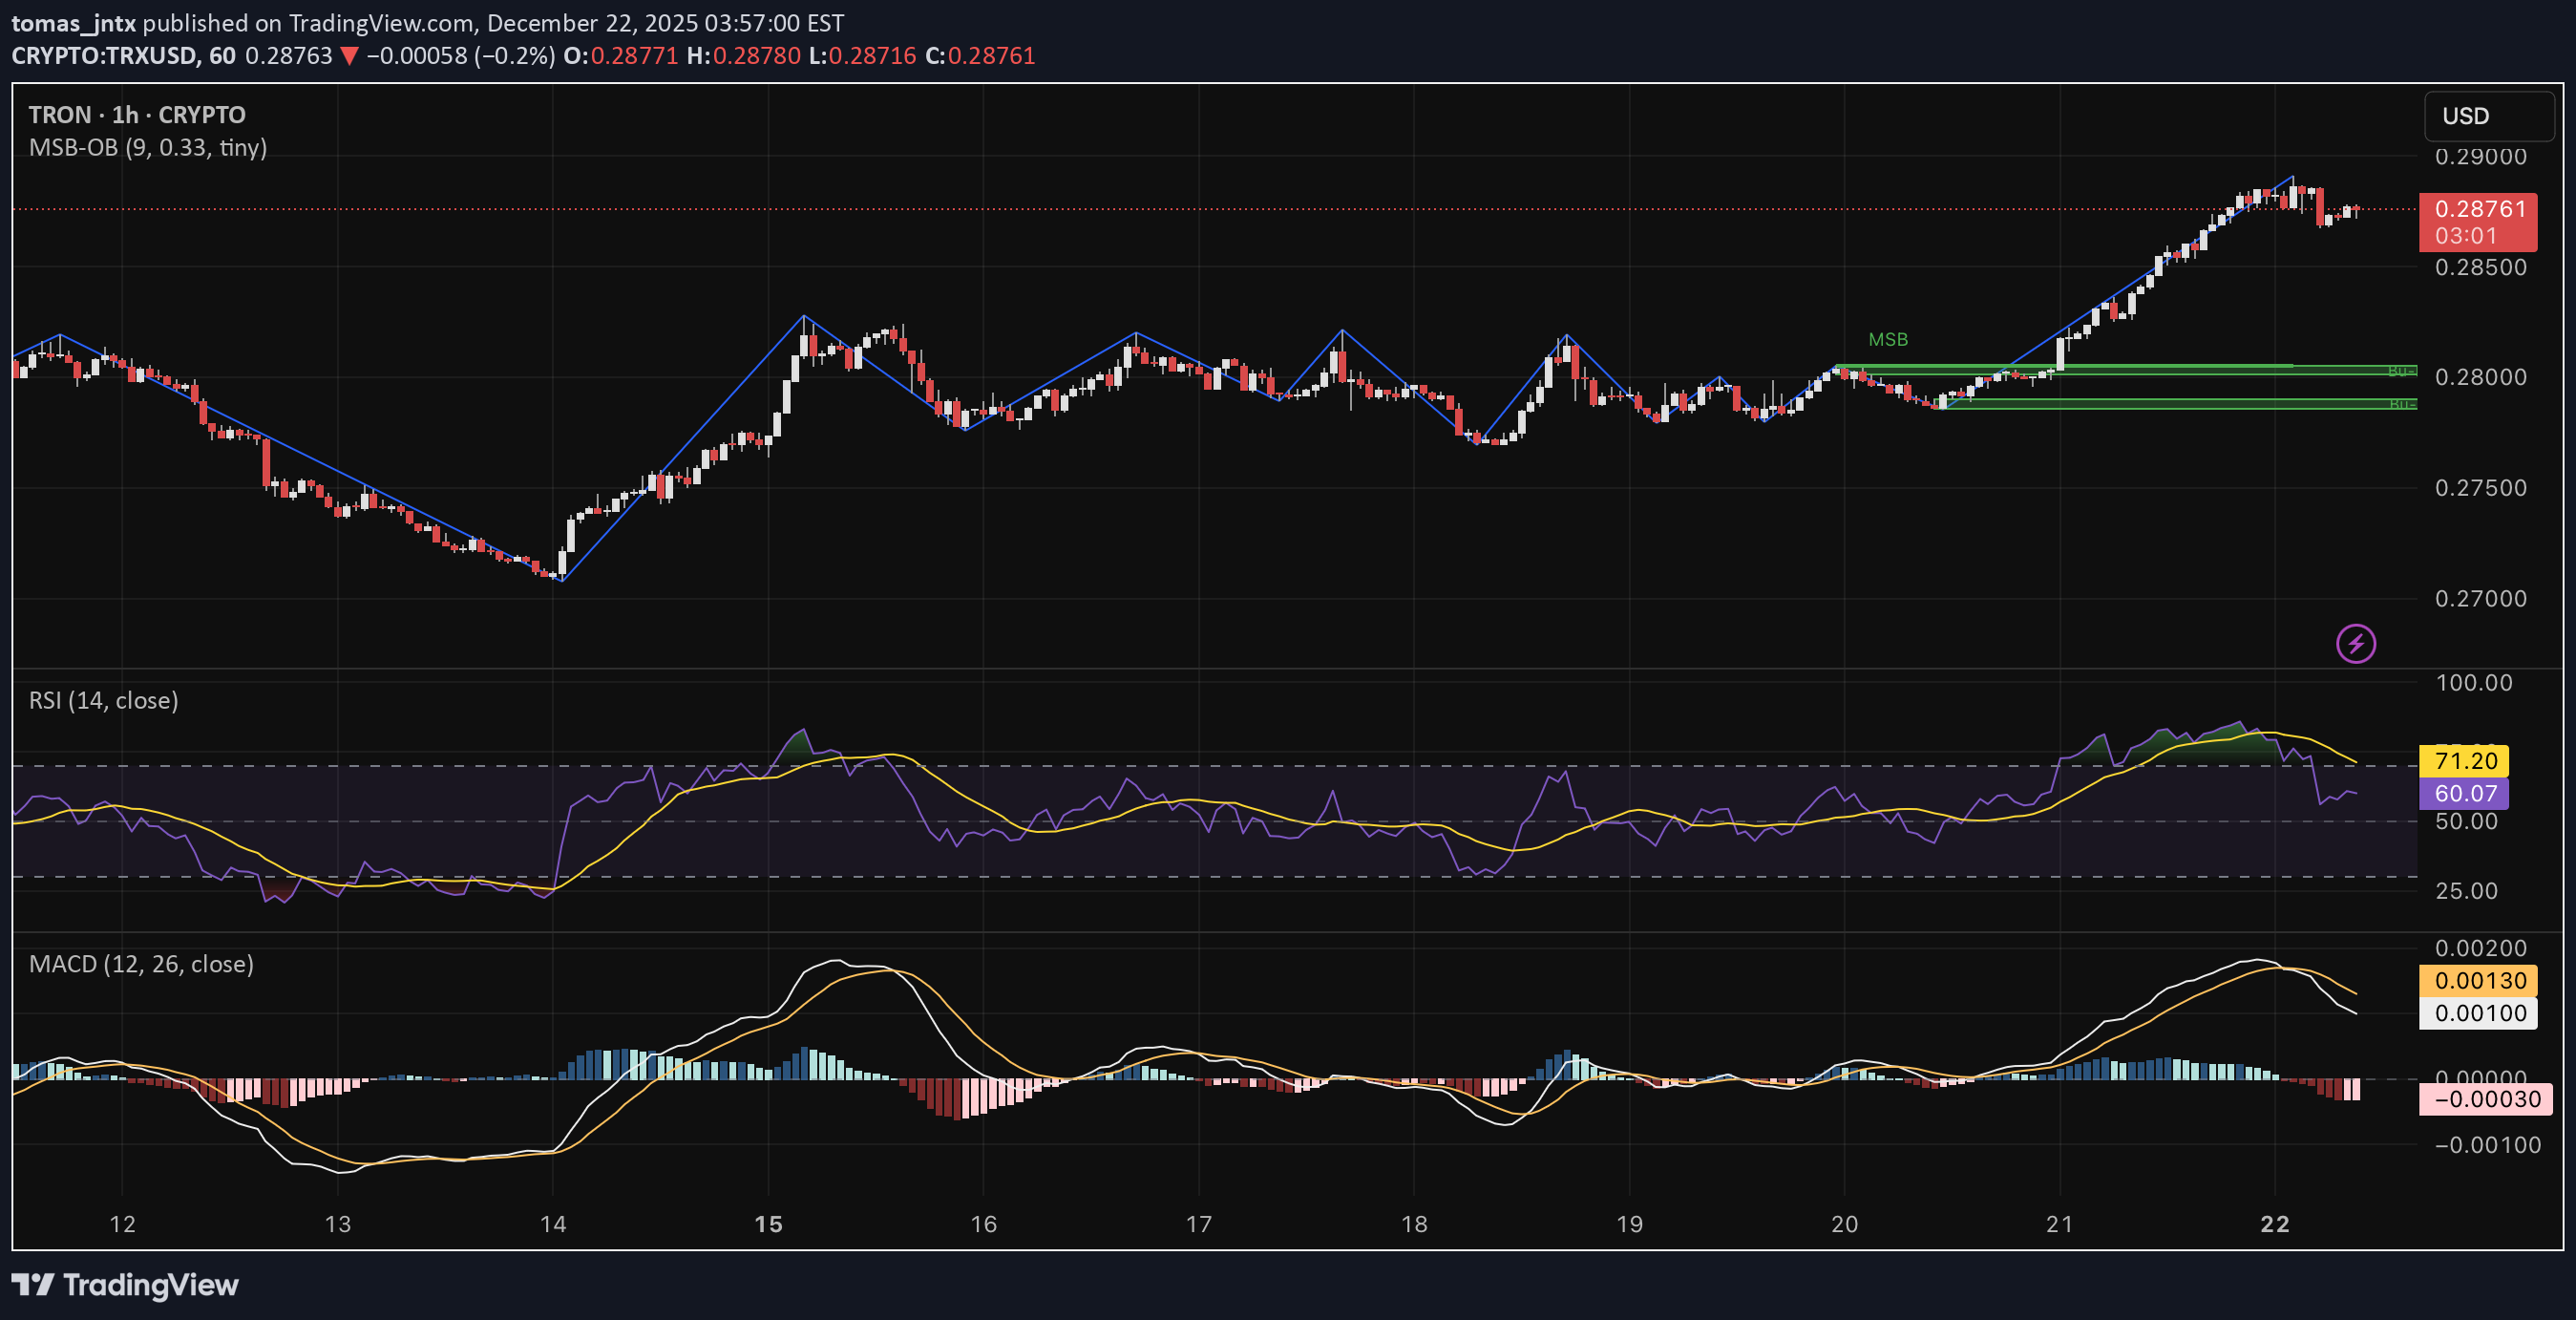
Trend Check: MSB flipped bullish and price broke aggressively above $0.280. Now entering potential cooldown/retest zone. Indicators: RSI: 71 (overbought) MACD: Topping out, slight divergence Structure: Clean impulse from demand zone, but current levels overextended. Ideal setup would be a retest of $0.279–$0.280. Position: Long bias Entry Idea: Long on retrace to $0.280 Stop: Below $0.276 Targets: $0.286 → $0.290 Reasoning: MSB + demand confluence triggered bullish push. Wait for a clean retest before jumping in.
tomas_jntx
SOL Trading Into Supply – Breakout or Fade From $128?
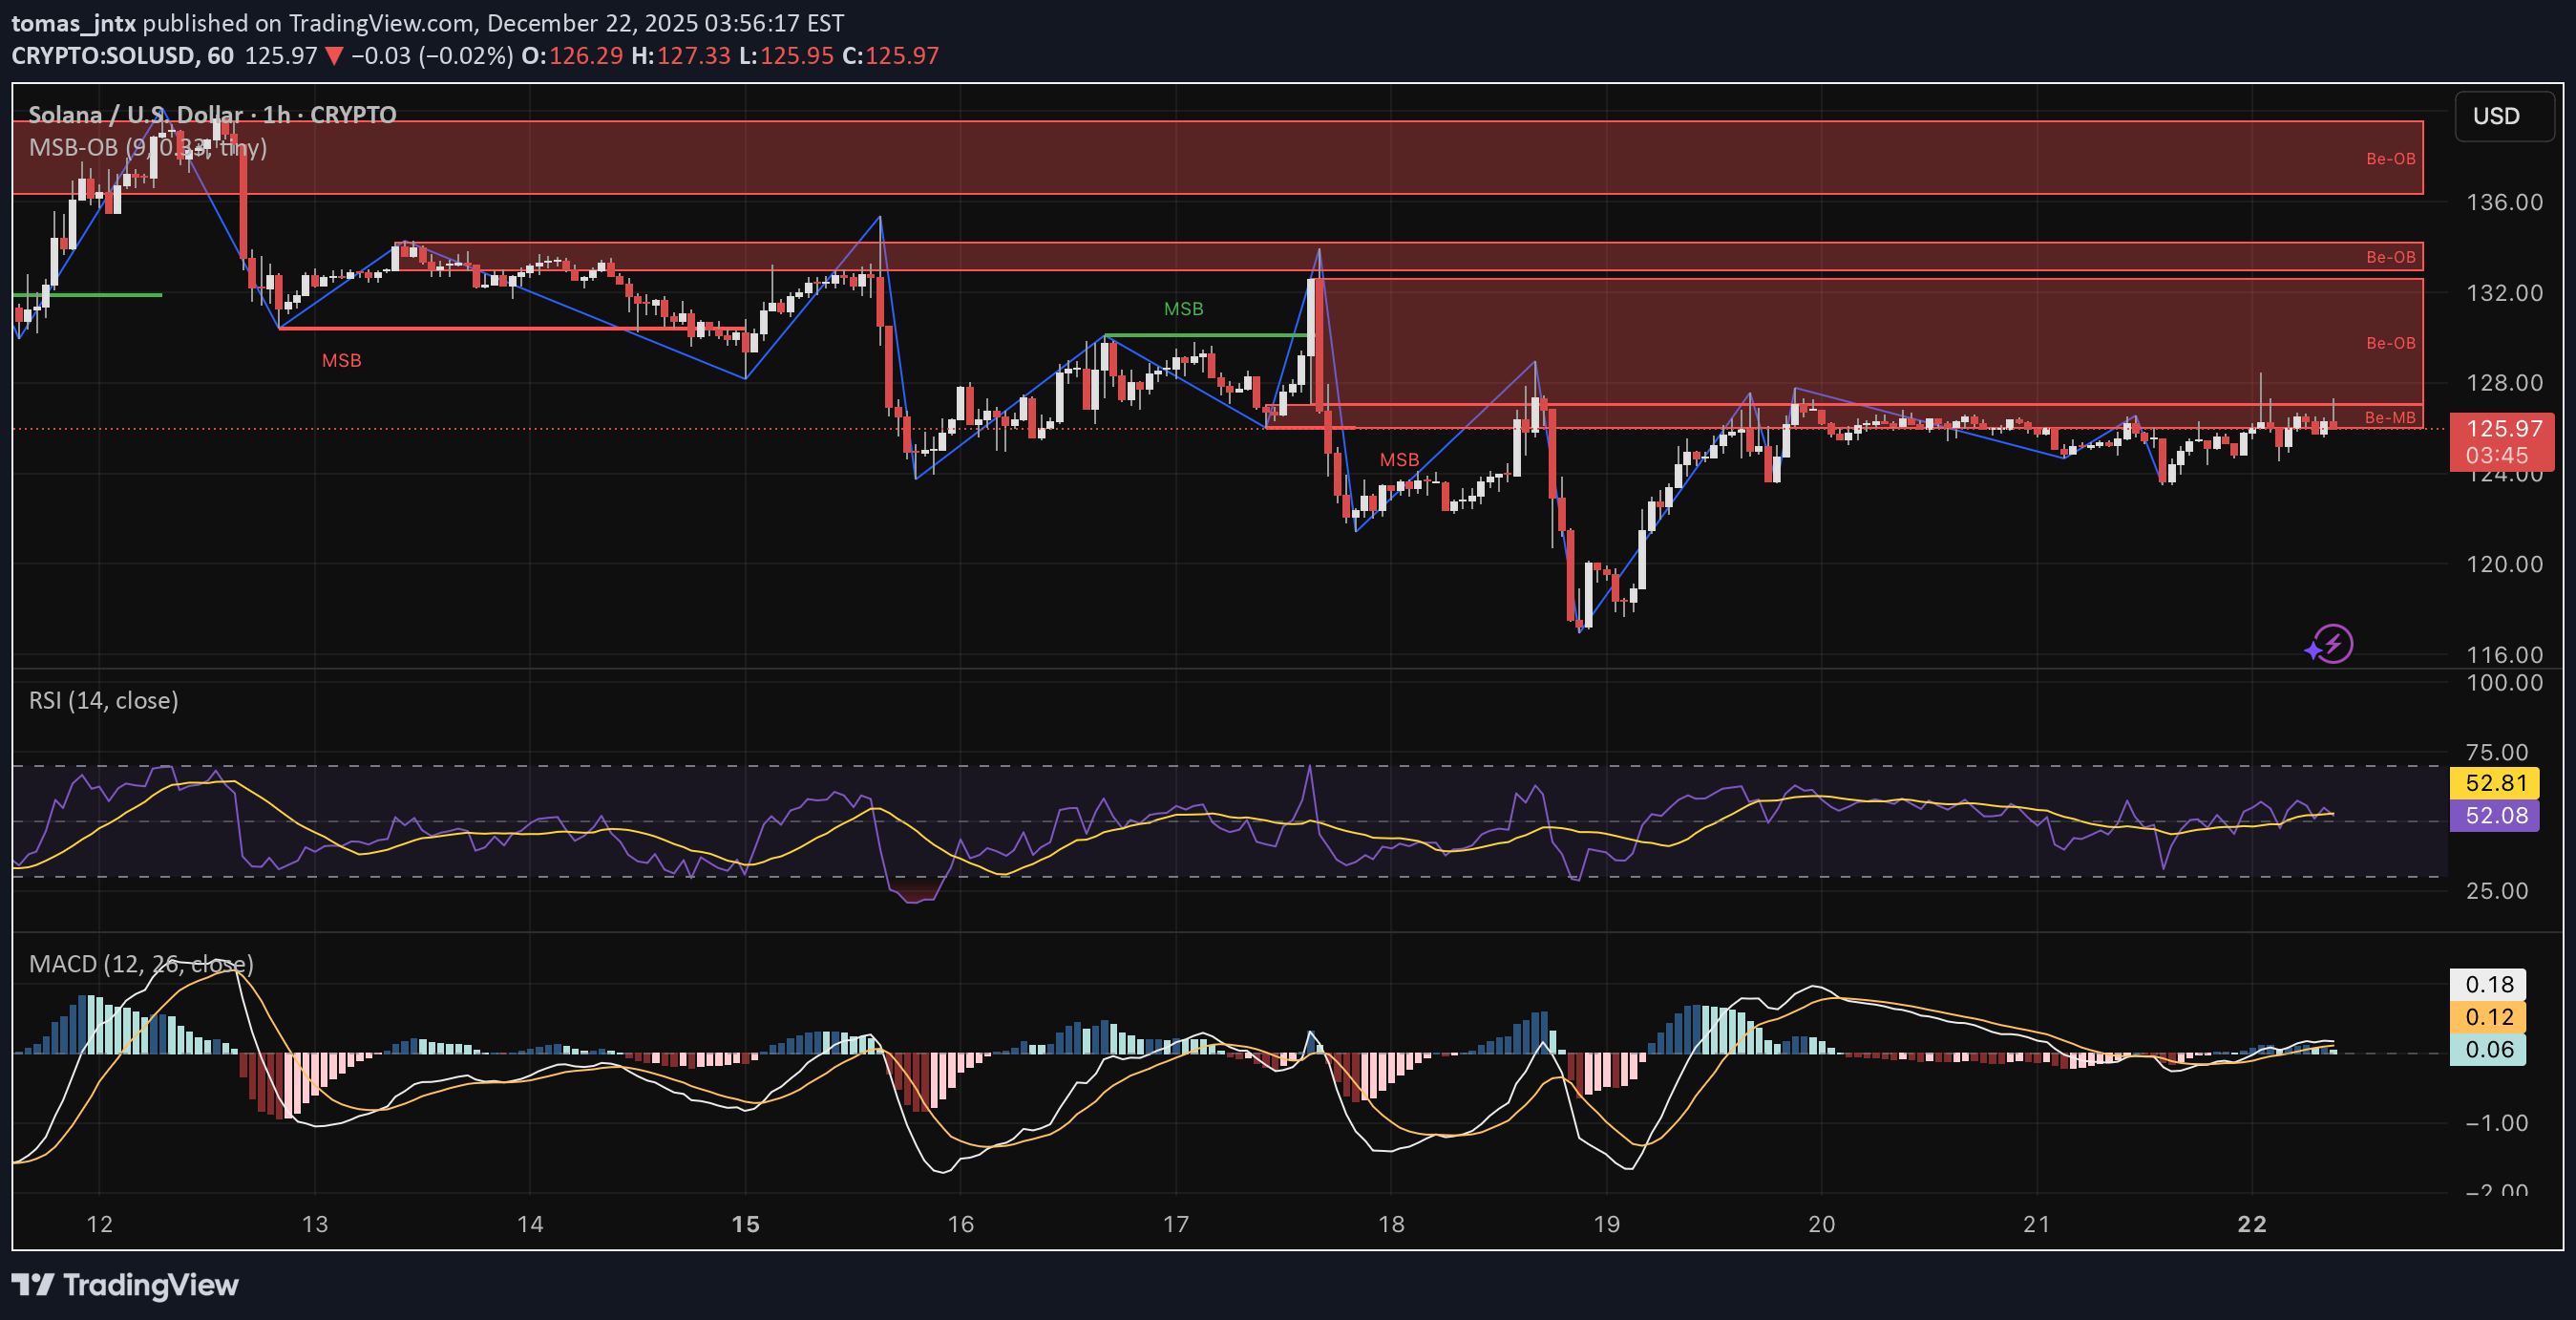
Trend Check: SOL printed a bullish MSB but is now running into a heavy supply zone between $128–$132. Indicators: RSI: 56 (neutral to bullish) MACD: Bullish but weakening Structure: Short-term structure flipped bullish, but long-term lower highs remain intact. Needs to clear $128 cleanly for any serious upside. Position: Short bias (until supply breaks) Entry Idea: Short between $127.5–$128.5 Stop: Above $130 Targets: $123.5 → $120 Reasoning: Supply overhead still respected. Until breakout is confirmed, short plays have cleaner RR.
tomas_jntx
BNB Breaks Out from Demand – Next Stop $880?
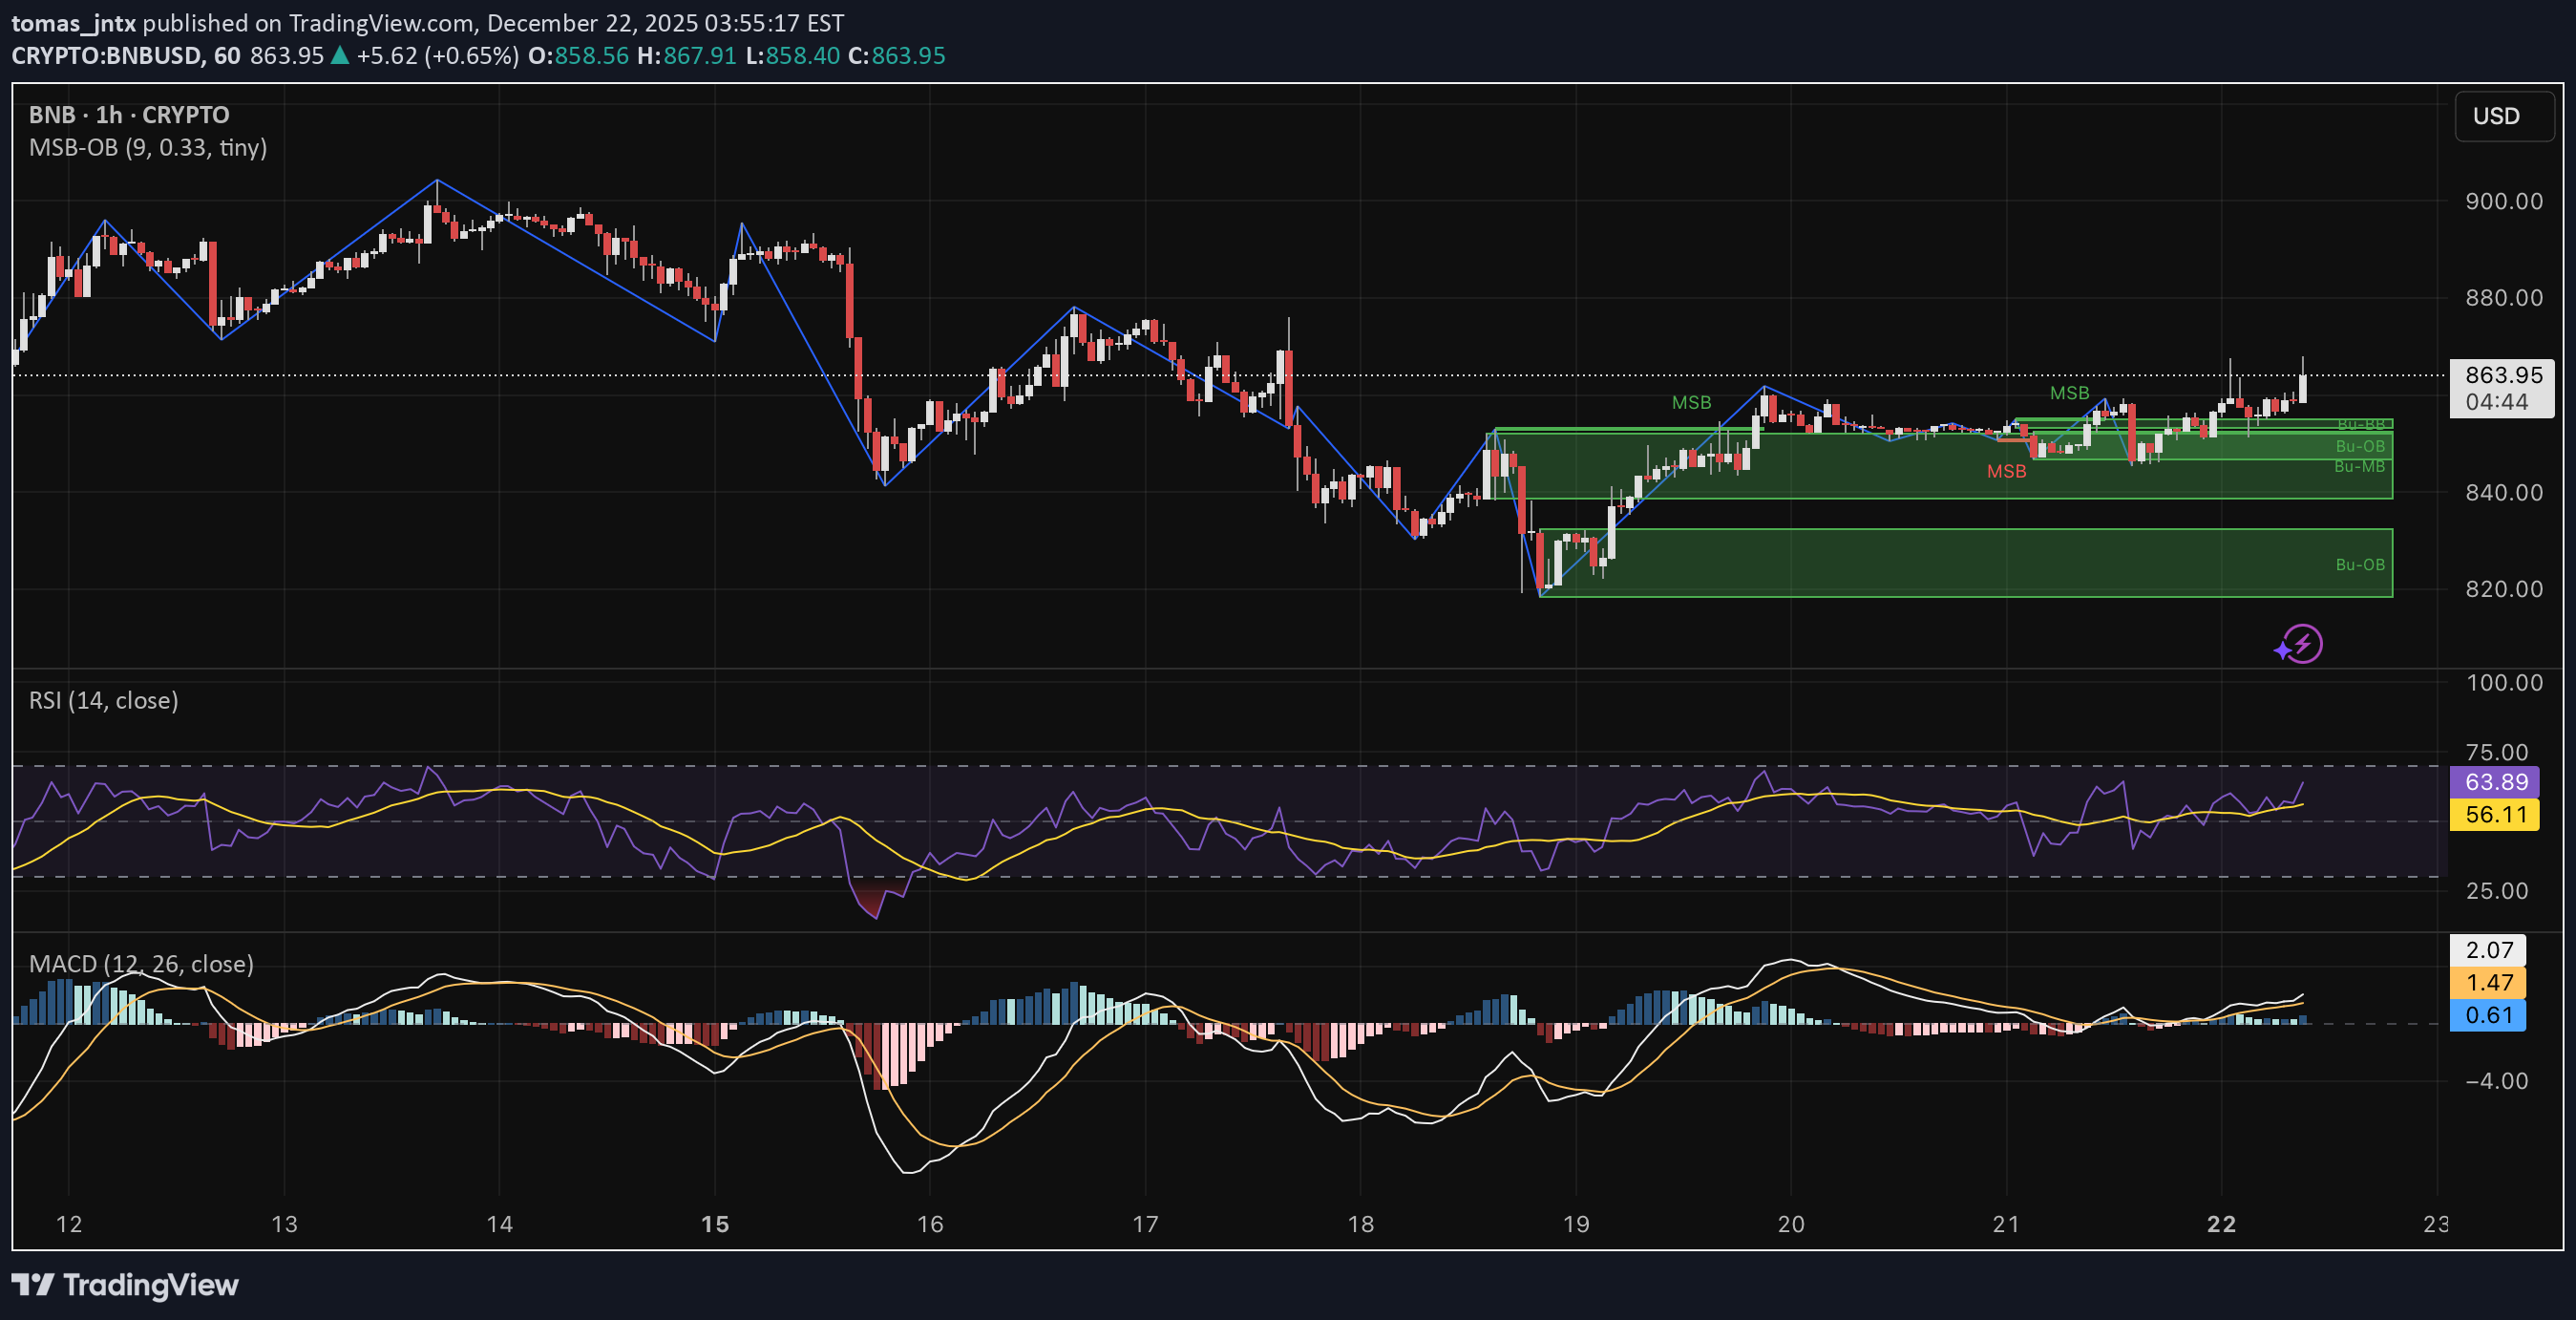
Trend Check: BNB printed a clean bullish MSB and held the OB at $830–$845. Breakout above local structure is now in play. Indicators: RSI: 63 (bullish) MACD: Bullish cross, rising histogram Structure: Price respected higher lows and reclaimed structure after MSB. Looks ready to test previous highs near $880. Position: Long bias Entry Idea: Long on breakout above $865 Stop: Below $850 Targets: $880 → $900 Reasoning: BNB broke key structure and bounced from strong demand. Bullish momentum supports upside continuation.
Disclaimer
Any content and materials included in Sahmeto's website and official communication channels are a compilation of personal opinions and analyses and are not binding. They do not constitute any recommendation for buying, selling, entering or exiting the stock market and cryptocurrency market. Also, all news and analyses included in the website and channels are merely republished information from official and unofficial domestic and foreign sources, and it is obvious that users of the said content are responsible for following up and ensuring the authenticity and accuracy of the materials. Therefore, while disclaiming responsibility, it is declared that the responsibility for any decision-making, action, and potential profit and loss in the capital market and cryptocurrency market lies with the trader.