
Kiu_Coin
@t_Kiu_Coin

What symbols does the trader recommend buying?
Purchase History
پیام های تریدر
Filter
Kiu_Coin
تخفیف ۴۰ درصدی BNB: آیا این آخرین فرصت قبل از پامپ بعدی است؟
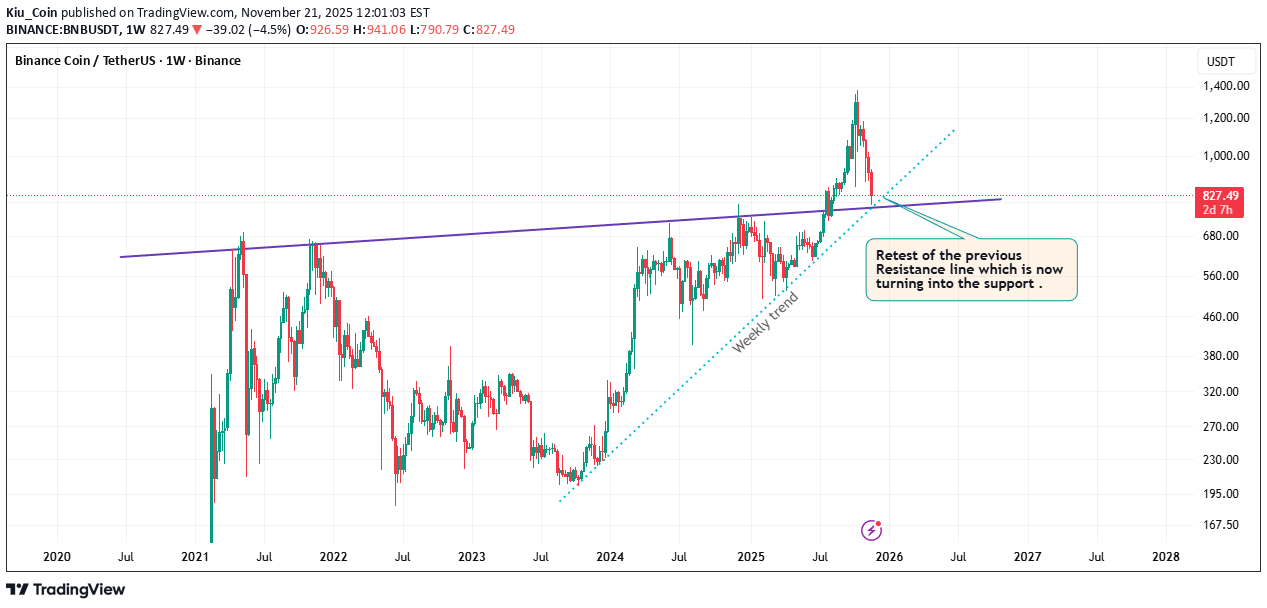
🐺 Hello Traders 🐺 Most of you probably felt the shock when BNB went straight up parabolic — and many regretted not buying when it was sitting right at that critical zone before the massive 80% pump. But here’s the good news: right now we’ve got another chance. BNB is trading at about a 40% discount compared to 42 days ago — and in my opinion, this could be a solid opportunity. Let me break down why 👇 1️⃣ BTC.D Situation BTC Dominance is still in a downtrend, and we’re sitting at a very critical support level. In my view, this support is about to break sooner rather than later. (You can check my last idea here for more details: If BTC.D loses this level, altcoins could finally get their moment to shine. 2️⃣ BTC Structure BTC itself looks bearish, but it’s very close to the next support zone. That could give altcoins some breathing room — a short retrace, maybe even a small pump across the altcoin sector. 3️⃣ BNB vs BTC BNB/BTC looks strong. Whenever a coin shows strength against BTC, it usually means it’s ready to outperform while BTC is bleeding or consolidating around support. That’s exactly what BNB is signaling right now. 4️⃣ Technical Analysis (TA) The chart itself looks solid: - Price is holding above the purple monthly resistance line, which has now flipped into support. - It’s still above the weekly trend line. - In my opinion, this recent drop was just a retest of the previous resistance zone — shaking out weak hands and testing the bulls’ conviction. 🐺 Conclusion BNB already proved it can go parabolic. Now, with BTC.D at critical support, BTC near its own support, and BNB/BTC showing strength, the setup looks promising. This doesn’t mean “guaranteed profits” — but it does mean we’re looking at a high-probability zone where discipline and patience could pay off. So make sure to remember our golden rule : Discipline is rarely enjoyable, but almost always profitable . 🐺 KIU_COIN 🐺
Kiu_Coin
تکرار تاریخ در بازار: نقشه راه ماهانه بیت کوین برای فرار از ترس و طمع!
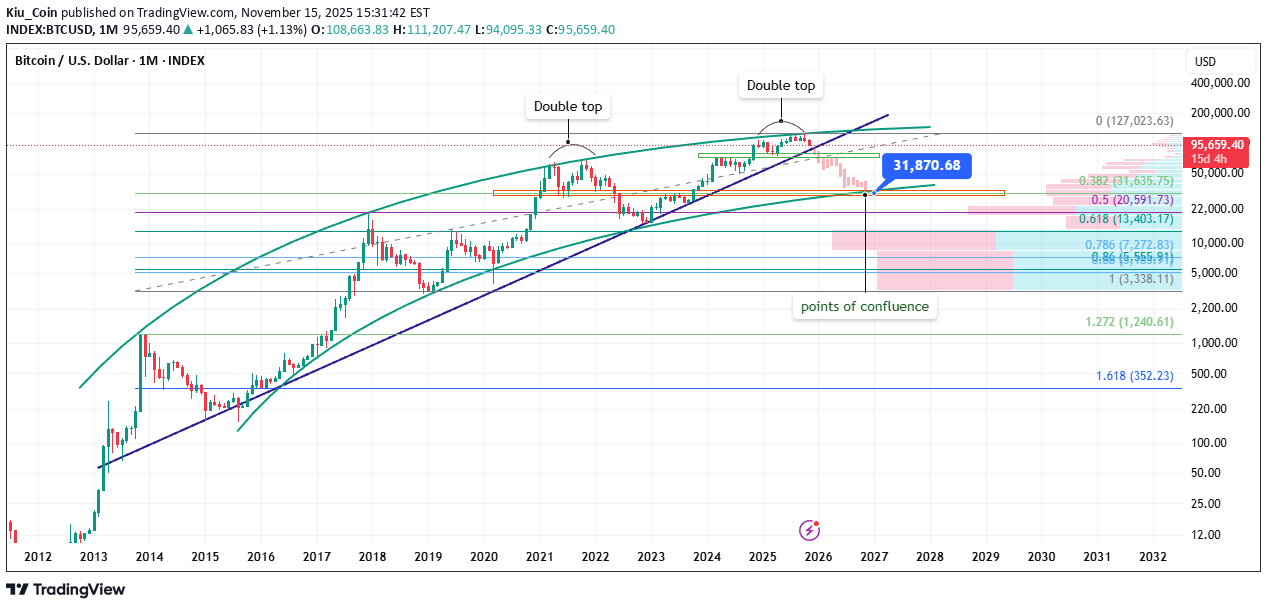
Hello Traders 🐺 Welcome back to another idea. I think maybe you said to yourself that this idea could be a total madness :-) But here is the truth — and we have to be honest with ourselves. I know it sounds a little bit crazy to see a Skyfall from 96K all the way down to 34K , something around 60% ! But we’ve had similar situations so many times before. Let me break it down for you, my friends 👇 As you can see on the Monthly timeframe , BTC is playing between two curves for almost its whole life. Yes — looks interesting, and I think we can use it as a very clear map to avoid greed and fear , and control our emotions during the time, especially if you are not a day trader. I think these two support and resistance curves are very valid because they formed on a high timeframe such as the monthly. So what else can we see here? If you pay closer attention to the chart, you’ll find that every time price hits the resistance line (the upper line of our curvy channel), that was the top of the bull market. But the interesting point here is: I am seeing a fractal pattern. Let me show you 🔍 If you go back to 21 November 2021 , you can see that price formed a double-top pattern, and the bear market officially started when price broke below the neckline of that double top. Now here is the same twist: We are very close to 21 November again :-) And price is currently trying to hold above the support line of the double top pattern. I think if we break below the neckline — which is around 75K — with a high degree of certainty, BTC would fall straight to the next most important support level, which is 32K. But why this level? As you can see, at this level we have 3 points of confluence: On the right-hand side of the chart, the Anchored VPVR shows a huge demand zone This zone aligns exactly with the 0.382 Fibonacci retracement level And the most interesting part: both areas perfectly match the support level of the curvy channel 📉 I think we must be honest in trading and always pay close attention to the warning signs. This time is no different. History will always repeat — and this is exactly what trading is about. I hope you enjoy this idea 🙌 Please drop your comments below so we can share our thoughts together. And as always remember: 🐺 Discipline is rarely enjoyable, but almost always profitable. 🐺 🐺 KIU_COIN 🐺
Kiu_Coin
ترس، طمع و هیجان در ترید: راهنمای جامع کنترل احساسات برای موفقیت

**Emotional Control 101: Hello Traders 🐺 How to Stop Fear, Greed, and Impulse from Destroying Your Trades** Welcome back to another post. In this article, we will dive deep into one of the most overlooked yet defining skills in trading: Emotional Control. This is not just a topic — it is the psychological foundation that decides whether you rise as a trader or fall like the rest. Let’s break it down step-by-step. 1) What is Emotional Control in Trading? Emotional Control is the ability to stay balanced, objective, and disciplined regardless of what the market is doing. It is the skill of thinking clearly when everything inside you wants to react impulsively. Every trader brings emotions into the chart: fear, greed, impatience, overconfidence, revenge, hope. These emotions influence your decision-making process more than any indicator or strategy ever could. Your emotional state determines: when you enter, when you exit, how you manage losses, how you react to wins, and how consistent you can remain during uncertainty. A controlled mind protects you. An uncontrolled mind destroys you. Both are fully in your hands. 2) The Hidden Enemies: Fear, Greed, Impulse Let’s break down the 3 psychological forces that ruin most traders: Fear Fear makes you exit early, skip valid setups, hesitate, doubt your edge, and anticipate danger even when your analysis is correct. Greed Greed makes you chase price, hold too long, ignore your plan, and believe that every pump will continue forever. Impulse Impulse is the silent killer. It pushes you into trades without confirmation, without analysis, without structure — simply because your brain demands a dopamine hit. These emotional forces show up fast, and if you do not control them, they will take over. 3) Why Emotional Control Matters More Than Strategy You can have the best strategy in the world, but if you cannot control your reactions? You will fail. Without emotional structure, trading becomes gambling. You become reactive, not strategic. You chase, you force, you hope — instead of plan, execute, and review. A trader with average strategy but strong emotional control will always outperform a trader with a perfect system but no discipline. Emotional mastery is the filter that protects your capital and aligns you with high-quality setups ONLY. 4) How to Build Emotional Control (Step by Step) Just because it is difficult does not mean it is impossible. Here is the practical framework: Step 1 — Build Discipline Through Consistency Create a clear trading plan. Define your edge. Commit to following it whether the market is pumping, dumping, or consolidating. Consistency creates internal strength. Strength creates emotional stability. Step 2 — Develop Emotional Awareness Become conscious of how you react during trades. Ask yourself: When do I feel fear? When do I feel FOMO? When do I feel reckless confidence? Which emotions pull me away from my edge? Awareness is the first step to control. Step 3 — Journal Everything You cannot control what you cannot see. Log: every loss, every win, every emotional trigger, every setup you forced, and every setup you skipped. Be brutally honest. Your journal is your mirror, not your trophy case. Patterns will appear. Identify them. Correct them. Step 4 — Build Trust in Your System You must trust two things: your strategy, yourself. Backtest. Forward test. Refine your criteria. The more proof you collect, the less emotions will dominate your decisions. Confidence must come from data, not hope. Step 5 — Master Patience The most important psychological skill. Only take A++ setups. The ones with multiple confluences lining up — not the setups that “feel right,” but the ones that are right. Patience protects you from impulsive trades. Patience separates traders from gamblers. 5) How Your Daily Life Affects Your Emotional Control in Trading Your psychology outside the chart becomes your psychology inside the chart. If your life is chaotic, emotional, stressed, or unstable — your trading will mirror it. A breakup, an argument, a bad day at work, fatigue, stress… All of these push the mind to seek dopamine. And where does it run for that dopamine? The charts. But emotional trading is destructive. It leads to revenge trades, overleveraging, forcing setups, and chasing losses. If you cannot regulate your emotions in daily life, you cannot expect to regulate them in a high-stress environment like the market. Control your life → control your trades. KEY POINTS 1) What is Emotional Control: Your ability to remain balanced under pressure. Master the mind → master the trade. 2) Hidden Enemies: Fear, greed, and impulse destroy discipline and clarity. 3) Why It Matters: Without emotional control, trading becomes gambling. With it, you gain structure, patience, and objectivity. 4) How to Build It: Consistency, emotional awareness, journaling, trust in your system, and patience. 5) Daily Life Impact: Your external emotions directly influence your performance in the market. Strengthen your mind outside → strengthen your mindset inside. Thank you all for reading — I hope this post brings clarity and value to your trading journey. Emotional control is only one of the 3 psychological pillars that lead to trading success. If you would like a deep dive into the remaining two keys, let me know — I’d be glad to share more with the community.
Kiu_Coin
تحلیل کوتاهمدت و میانمدت اتریوم (ETH): هدف بعدی کجاست؟

Hello Traders 🐺 In this idea, I want to talk about the next target for ETH and explore its potential mid- and short-term movements, so make sure to stay with me until the very end. Let’s start with the weekly chart, then move down to the daily for a more detailed analysis: As you can see on the weekly, with the current close above the blue resistance line, we can still have some hopium for ETH — meaning we’re still bullish for now, and everything looks fine so far. But what am I expecting from ETH right now? Let me be honest with you guys — if the price can recover from the current dip and break above the orange resistance line (which is also the daily supply zone), I expect at least another leg up toward $5,900, where price will face the 0.5 Fibonacci retracement level. But what about the immediate short term? As you can see on the daily chart, as long as ETH can hold above the purple support trendline, we can expect higher price targets ahead. I think this is a crucial level for ETH to watch closely — we need to stay above it to keep the bullish structure alive. I hope you enjoyed this idea, and as always remember: 🐺 Discipline is rarely enjoyable, but almost always profitable. 🐺 🐺 KIU_COIN 🐺
Kiu_Coin
علت سقوطهای بزرگ طلا در تاریخ چه بود؟ (از دهه 70 تا امروز)
Hello Traders 🐺 Throughout history, every major bear market in gold has been deeply connected to macro factors, monetary policy, and investor psychology. Here I’ve summarized the key factors behind gold’s biggest crashes since the 1970s 👇 🧩 Key Factors Behind Historical Gold Crashes 1️⃣ Rising Real Interest Rates (↑) The biggest historical enemy of gold. Since gold has no yield, when real interest rates (nominal rates – inflation) turn positive, investors prefer bonds or the U.S. dollar. Example: In the 1980s, Fed Chair Paul Volcker raised rates above 15% to fight inflation. Result: gold dropped from $850 (1980) to around $300 by the mid-80s — a 65% crash, marking the longest bear market in gold’s history (1980–1999). 2️⃣ A Stronger Dollar (DXY ↑) Gold usually moves inversely to the dollar index. When the dollar strengthens (especially vs EUR and JPY), gold comes under pressure. Example: Between 2011–2015, DXY rose from 73 → 100, while gold fell from $1920 → $1050 (≈45% decline). 3️⃣ End of Crises or Return of Market Confidence When fear fades and confidence returns (e.g., after financial crises or geopolitical tensions ease), investors move away from safe-haven assets like gold. Example: After the 2008 crisis, once markets stabilized, gold entered a prolonged bear market (2012–2015). 4️⃣ Central Banks Stopping Gold Purchases When central banks reduce or halt their gold accumulation, supply pressure builds. Example: In the late 1990s, European central banks sold large portions of their reserves (known as the Central Bank Gold Agreement 1999), which accelerated gold’s decline. 5️⃣ Strong Stock Market Returns When equities deliver strong real returns, capital often rotates out of gold. Example: From 1995–2000, the S&P 500 rallied massively, while gold suffered one of its weakest decades. 6️⃣ Low Inflation & Economic Stability Gold thrives on uncertainty and high inflation. When inflation is low and stable, investors see little reason to hold gold. Example: Between 1985–2000, inflation in the U.S. stayed low — and gold traded sideways between $250–$400 for nearly 20 years. 7️⃣ Technical & Sentiment Breakdown When key supports break and sentiment turns bearish, fear-driven selling usually accelerates the downtrend. Example: In 2013, gold broke below the $1550 support, triggering a rapid 20% selloff within months. My final thought: Every time gold enters a euphoric phase, history reminds us that the higher it climbs, the harder it falls. So what do you think right know ? is GOLD about to fall ? let me know in the comment section down below this idea 😉🤔 So stay disciplined, watch the macro shifts carefully — and as always remember: 🐺 Discipline is rarely enjoyable, but almost always profitable. 🐺 🐺 KIU_COIN 🐺
Kiu_Coin
واگرایی بیت کوین: طوفان پیش رو یا آرامش قبل از سقوط؟ (تحلیل تکنیکال هفتگی)

Hello Traders 🐺 In this idea, I want to talk about both the immediate short-term and long-term effects of the current divergence on the RSI and the formation of an M pattern on the weekly chart. First, let’s talk about the short-term targets: As you can see, price is currently sitting above the orange trendline — however, I believe this support is about to be lost very soon. There’s a massive divergence on the weekly timeframe, and price is already testing this support. Still, as long as we stay above the previous low, the structure remains technically bullish. The key support, in my opinion, is the purple line — the monthly support zone — which has always acted as a strong demand area for BTC. But this time, the angle of the line looks too sharp for the current momentum, and I personally expect a deeper correction — possibly toward the $37K red box area. Yeah, it might sound unlikely, but remember the last cycle: When BTC was at $70K, no one expected to see it below $40K again — and yet, it went all the way down to $15K. This time isn’t any different. The bear market might be closer than most people think. I hope you enjoy this idea, and as always remember: 🐺 Discipline is rarely enjoyable, but almost always profitable. 🐺 🐺 KIU_COIN 🐺
Kiu_Coin
هشدار فوری: بازار خرسی بیت کوین زودتر از تصور شما از راه میرسد! (هدف ۴۰ هزار دلار؟)
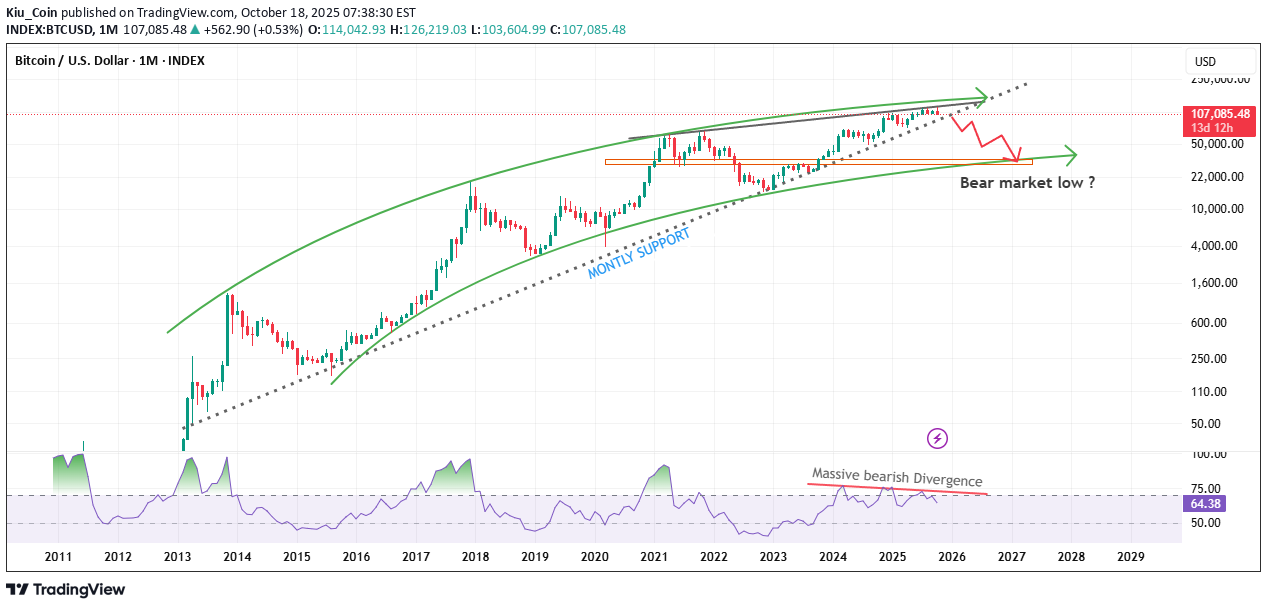
Hello Traders 🐺 I know most of you don’t want to hear anything about a bear market, but the fact is — it’s much closer than we even imagined! Let’s talk about it 👇 As you can see on the monthly timeframe, the price is moving between two green curved lines that I drew for you. Notice how precisely the price reacts to them — each time it touches the upper line, we get a new All-Time High (ATH) for BTC. Currently, the price is very close to that upper resistance line. If you zoom in a little, you can clearly see that price is tightening between the dotted black line (monthly support) and another descending black resistance with multiple touch points from both previous ATHs and the current highs. On the other hand, there’s a massive RSI divergence, which in my personal opinion could be signaling the start of a bear market for BTC — sooner rather than later. But what about Altcoins? 👀 Are they also about to collapse and enter a bear market? I’ll talk about that in my next idea. For now, let’s focus on the bear market price target for BTC: It might shock you, but I believe somewhere between $40K and $35K could be the next long-term target — which makes sense since we have a green monthly support line aligning with a strong demand area. I hope you enjoyed this idea, and as always remember: 🐺 Discipline is rarely enjoyable, but almost always profitable. 🐺 🐺 KIU_COIN 🐺
Kiu_Coin
طلا در اوج؛ آیا تاریخ تکرار میشود و منتظر سقوط بزرگ هستیم؟
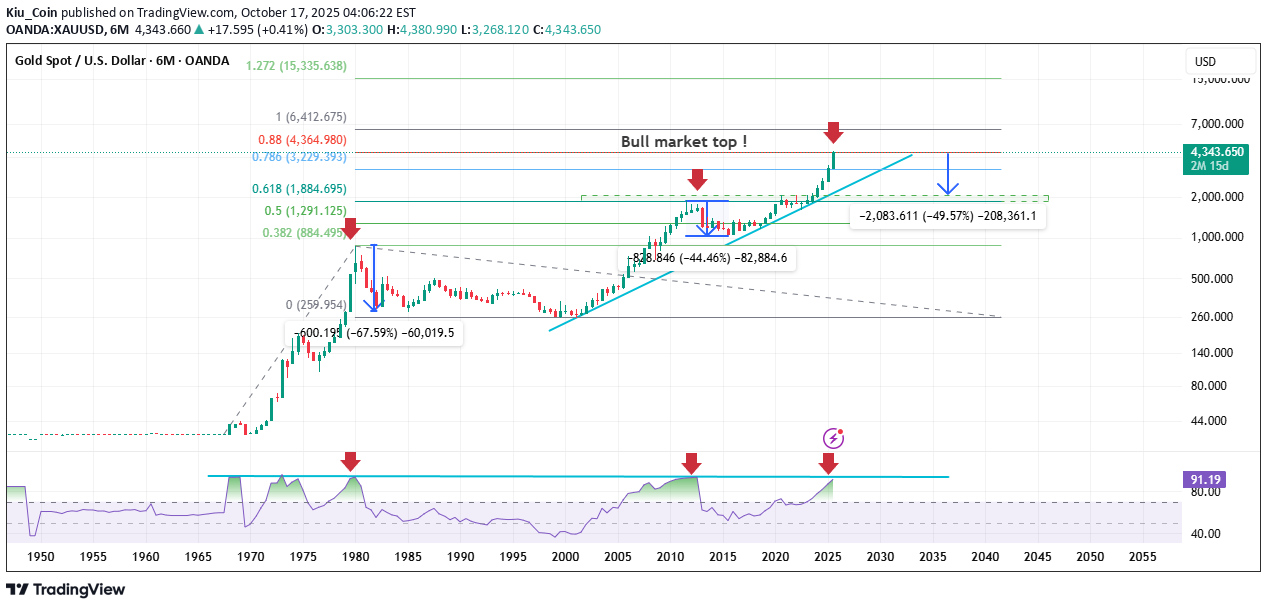
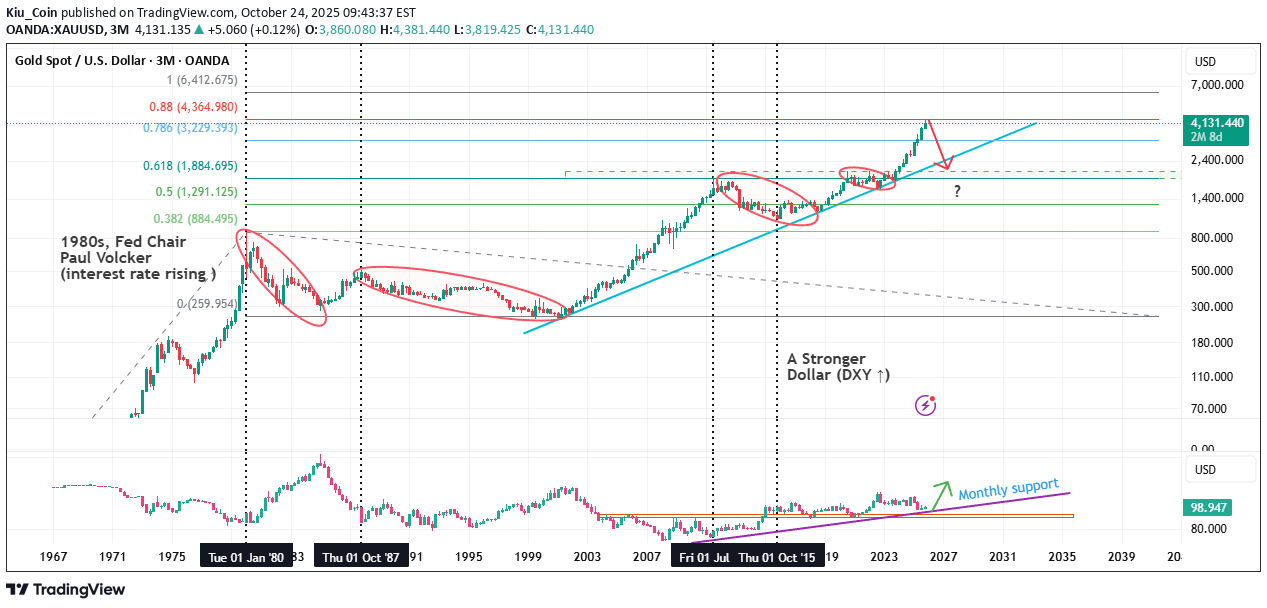
Hello Traders 🐺 As I expected, gold is now creating new all-time highs — but the real question is: how far can this rally actually go? Let’s take a closer look, because this chart might reveal a lot more than you think! Let’s go back in time — all the way to when gold was still in the early stages of its first major rally and reached the top around $890 in 1980. If you zoom in a little bit, you can clearly see that once the RSI reached around 90 (showing an extreme overbought condition), gold entered a massive bear market, dropping nearly 60% — something almost nobody expected back then. Now, of course, we can’t rely only on the RSI overbought signal to predict the current situation, but when we use the Fibonacci Trend-Based Tool and measure the rally from its beginning to the bottom of its correction — that’s when things get really interesting! Look closely: the 0.618 Fibonacci level — also known as the golden ratio — actually predicted the next major top years before it even happened. When price reached $1880 in 2011, the RSI again entered the overbought zone, and we saw another strong 45% correction right after that! But what about now? The RSI is again approaching the same zone, and price is very close to the 0.88 Fibonacci level. So, what do you think? Is this the end of the bull run and the right time to start taking profits? Let’s talk about it in the comments — because in my opinion, we might be about to see another correction, at least down to the 0.618 level, which perfectly aligns with the previous all-time high for gold!
Kiu_Coin
AVAX W-Pattern Alert: 50% Upside Potential !
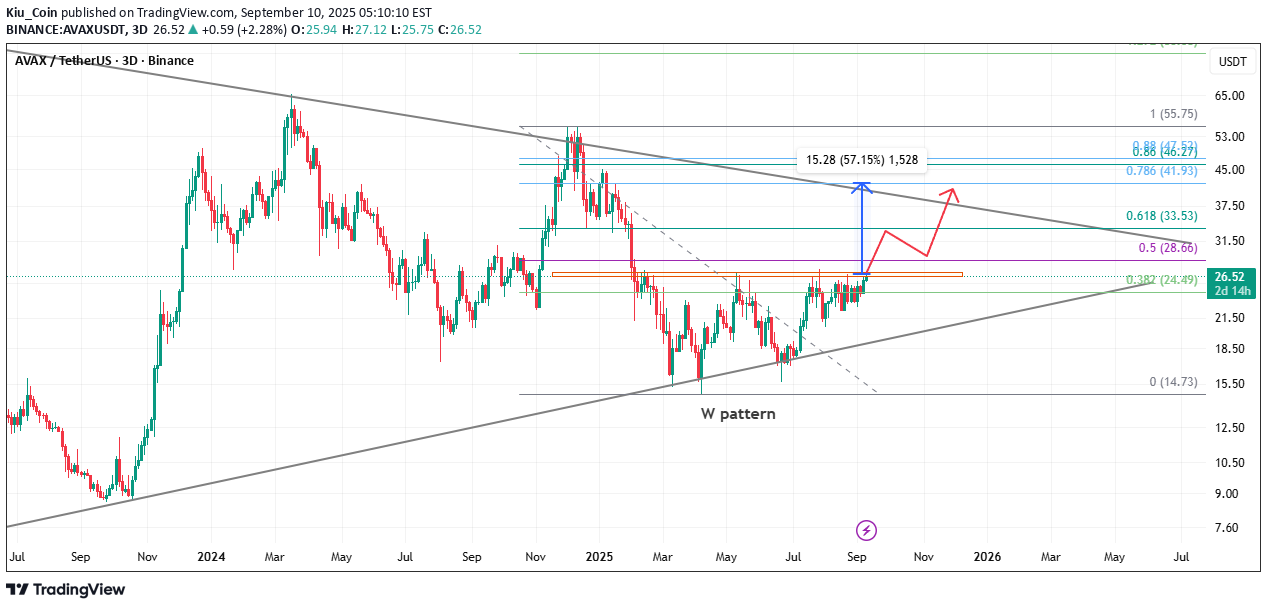
Hello Traders 🐺 In this idea, I want to give you a trade setup for AVAX, which in my opinion is one of the best coins out there. Also, this W pattern looks very healthy, so let’s dive into it: As I previously talked about the macro view of AVAX and the massive triangle where price is unfolding and accumulating energy for the breakout, today I want to give you a quick update about what is actually tradeable right now. As you might know, the W pattern is one of the most tradable patterns out there. When price breaks above the neckline and closes above it, by using Fibonacci tools we can measure the price target of the pattern. Most of the time, the 1.618 ratio gives us a target — in this case, around 50% gain! Make sure to act accordingly. 🐺 KIU_COIN 🐺
Kiu_Coin
TIA Chart Signals a Massive 100% Move — Altseason is Here !

Hello Traders 🐺 As you might already feel it, Altcoin season is about to begin — and one of my favorite picks for this cycle is TIA. Looking at the chart, we can clearly see a descending channel with price respecting its boundaries over time. Right now, TIA is getting very close to breaking above the orange resistance line — and if that happens, we could see a massive rally of nearly 100%, pushing price all the way up to the upper resistance of the channel around $3.82. 📈 This is definitely a setup worth watching closely. Make sure to act accordingly! 🐺 KIU_COIN 🐺
Disclaimer
Any content and materials included in Sahmeto's website and official communication channels are a compilation of personal opinions and analyses and are not binding. They do not constitute any recommendation for buying, selling, entering or exiting the stock market and cryptocurrency market. Also, all news and analyses included in the website and channels are merely republished information from official and unofficial domestic and foreign sources, and it is obvious that users of the said content are responsible for following up and ensuring the authenticity and accuracy of the materials. Therefore, while disclaiming responsibility, it is declared that the responsibility for any decision-making, action, and potential profit and loss in the capital market and cryptocurrency market lies with the trader.