Technical analysis by Kiu_Coin about Symbol PAXG: Sell recommendation (10/17/2025)

Kiu_Coin
طلا در اوج؛ آیا تاریخ تکرار میشود و منتظر سقوط بزرگ هستیم؟
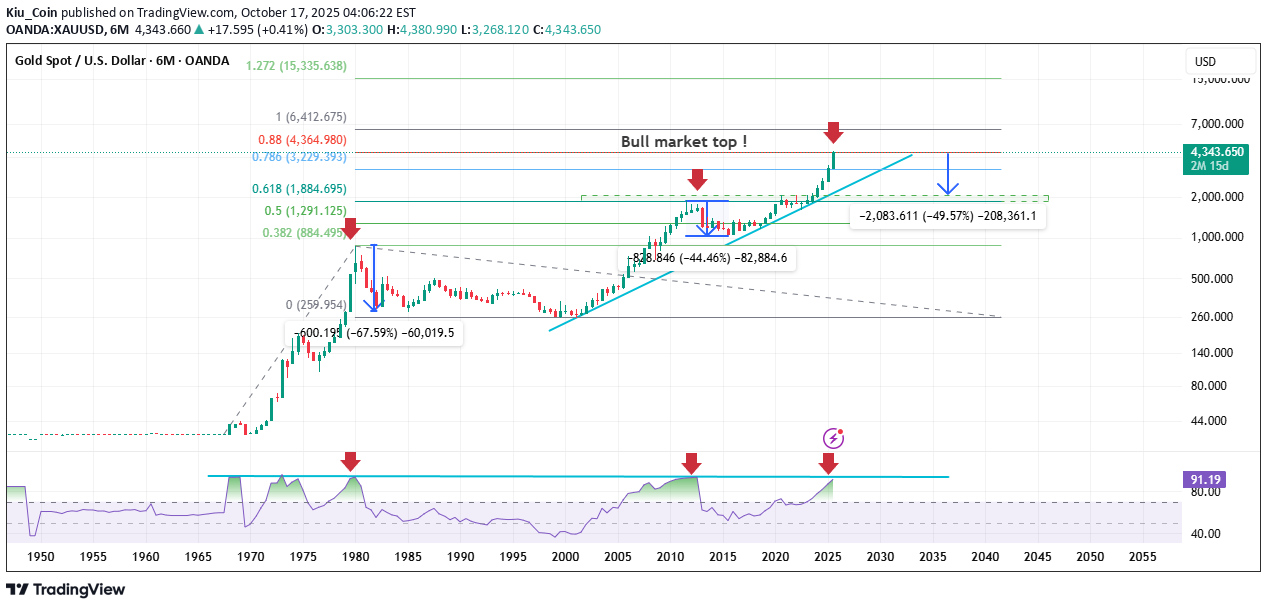
Hello Traders 🐺 As I expected, gold is now creating new all-time highs — but the real question is: how far can this rally actually go? Let’s take a closer look, because this chart might reveal a lot more than you think! Let’s go back in time — all the way to when gold was still in the early stages of its first major rally and reached the top around $890 in 1980. If you zoom in a little bit, you can clearly see that once the RSI reached around 90 (showing an extreme overbought condition), gold entered a massive bear market, dropping nearly 60% — something almost nobody expected back then. Now, of course, we can’t rely only on the RSI overbought signal to predict the current situation, but when we use the Fibonacci Trend-Based Tool and measure the rally from its beginning to the bottom of its correction — that’s when things get really interesting! Look closely: the 0.618 Fibonacci level — also known as the golden ratio — actually predicted the next major top years before it even happened. When price reached $1880 in 2011, the RSI again entered the overbought zone, and we saw another strong 45% correction right after that! But what about now? The RSI is again approaching the same zone, and price is very close to the 0.88 Fibonacci level. So, what do you think? Is this the end of the bull run and the right time to start taking profits? Let’s talk about it in the comments — because in my opinion, we might be about to see another correction, at least down to the 0.618 level, which perfectly aligns with the previous all-time high for gold!