
TradeWithMky
@t_TradeWithMky

What symbols does the trader recommend buying?
Purchase History
پیام های تریدر
Filter
TradeWithMky
The Fakeout Before the Fall? Watch These Key Channels !
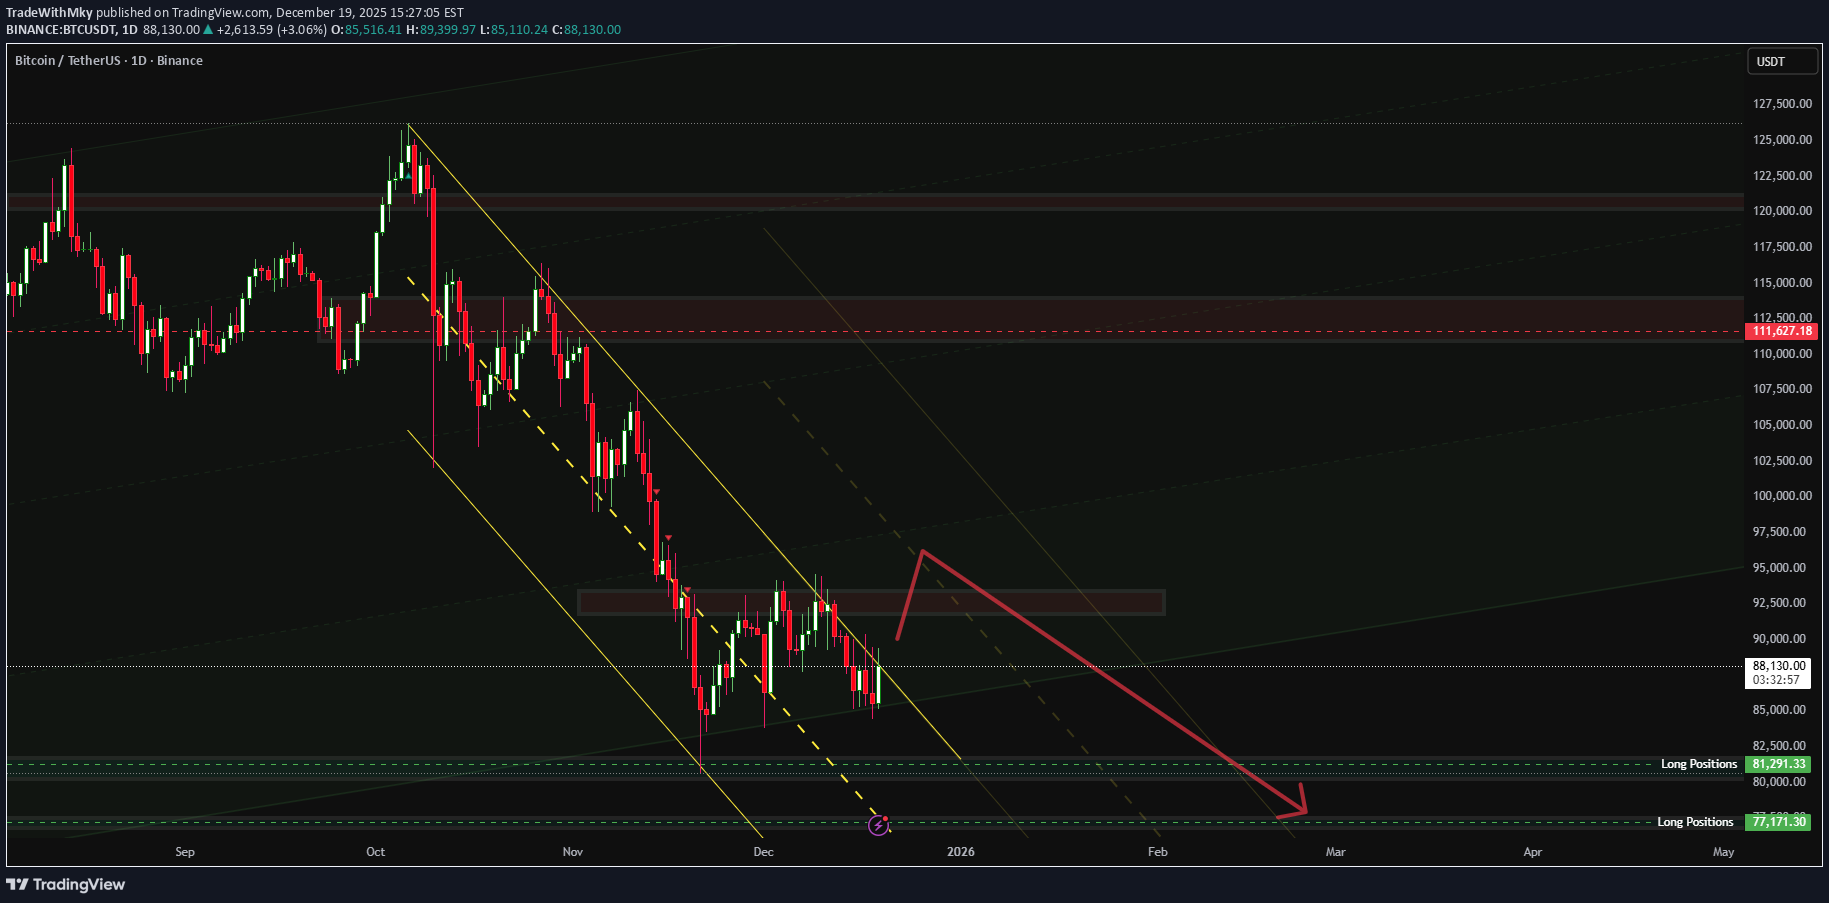
Bitcoin is showing classic weakness on the daily timeframe. Here’s what I see 👇 The price might fake out the red resistance zone around 110K–112K, fooling traders into thinking a breakout is coming — and then drop strongly from there. The real trend reversal will only happen if and only if BTC breaks above both yellow descending channels — the main and the secondary one. Until that happens, the bearish pressure stays alive. ⚡️Key Levels: Sell Zone (Possible Fakeout): 110,000 – 112,800 USDT Buy Zones: 80,000 – 82,200 USDT and 87,971 USDT Watch for breakout confirmation above the upper yellow channels! Remember this chart — when it unfolds, you’ll know who called it first 😉 👉 TradeWithMky #BTC #Bitcoin #Crypto #TradingView #TradeWithMky #CryptoAnalysis #FakeoutAlert
TradeWithMky
Bitcoin: The Battle Between Bulls and Bears
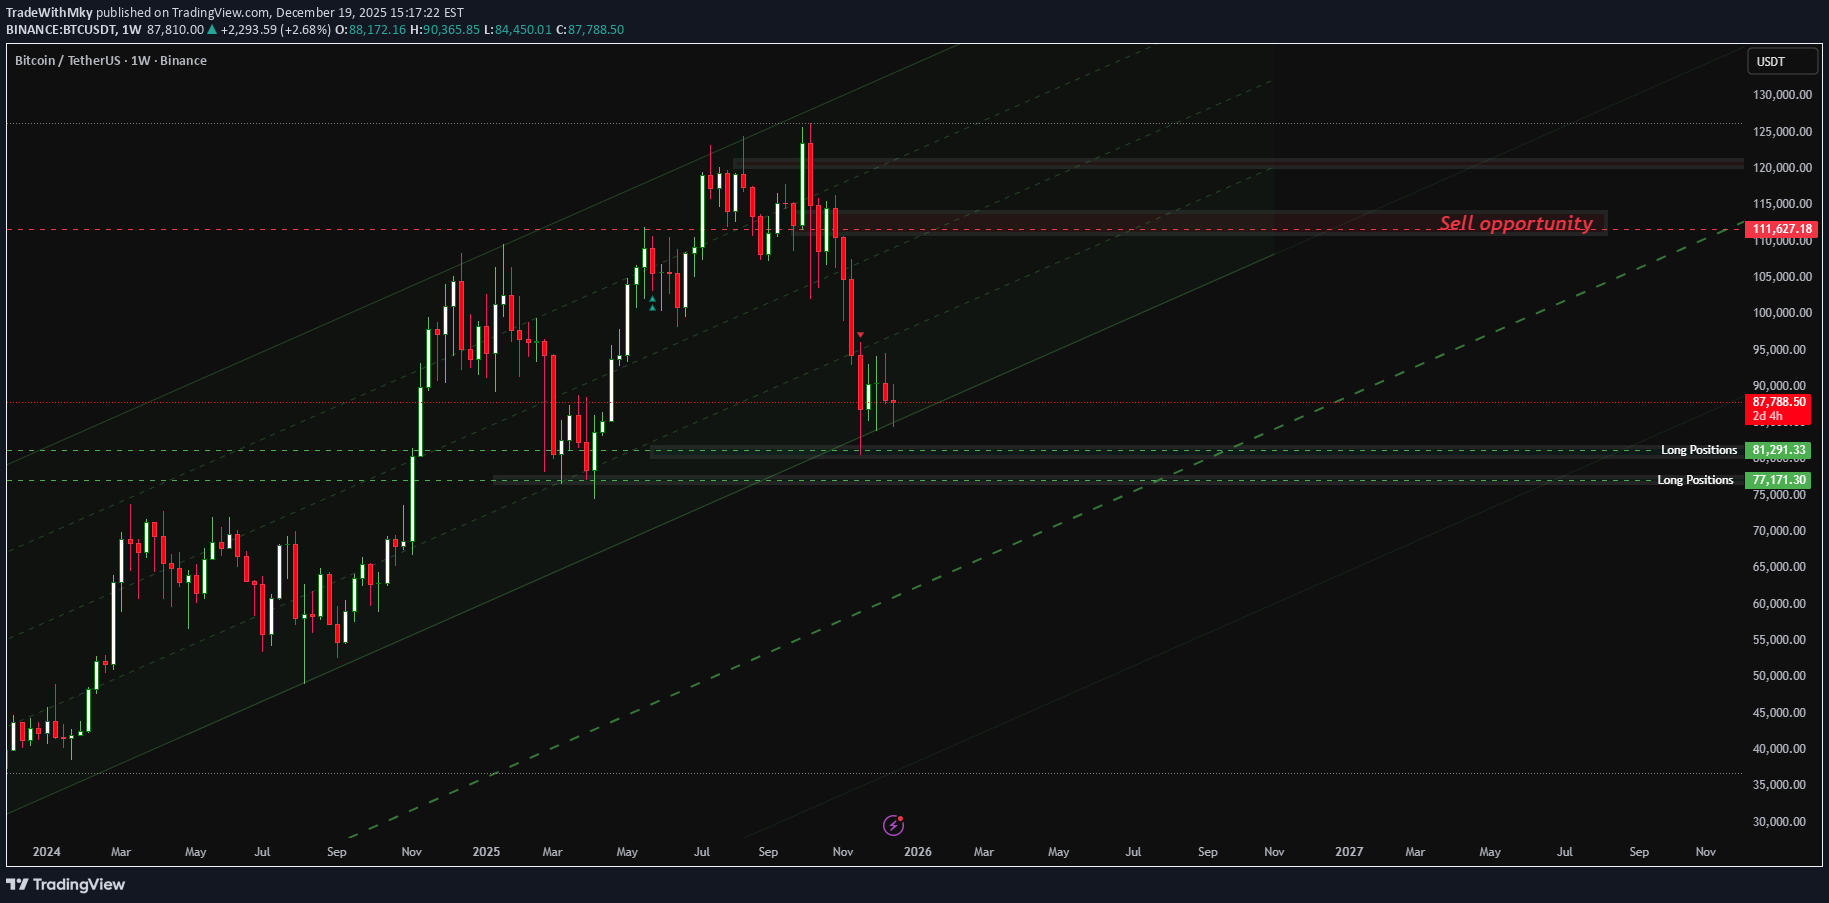
See the Future Before It Happens Bitcoin is now moving between my Buy Zone and Sell Opportunity Zone. Expect strong range trading between these levels unless major support breaks. If BTC loses the bottom of its main ascending channel, there’s a secondary channel next to it — where the 50% ratio line could act as temporary support. But if that level fails and confirms the breakdown… let’s say it clearly — Bitcoin might face one of its darkest phases in the next bearish cycle. 📊 Current setup: Buy orders: around 75,200 – 81,731 USDT Sell zone / opportunity: around 111,870 – 115,000 USDT See the future now. When it plays out, remember the name 👉 TradeWithMky Stay sharp, follow the trend, and always prepare for both sides of the market. 🚀 #Bitcoin #BTC #Crypto #TradingView #TradeWithMky
TradeWithMky
Professional Gold Market Analyst | Sharing Precise Trading Analy
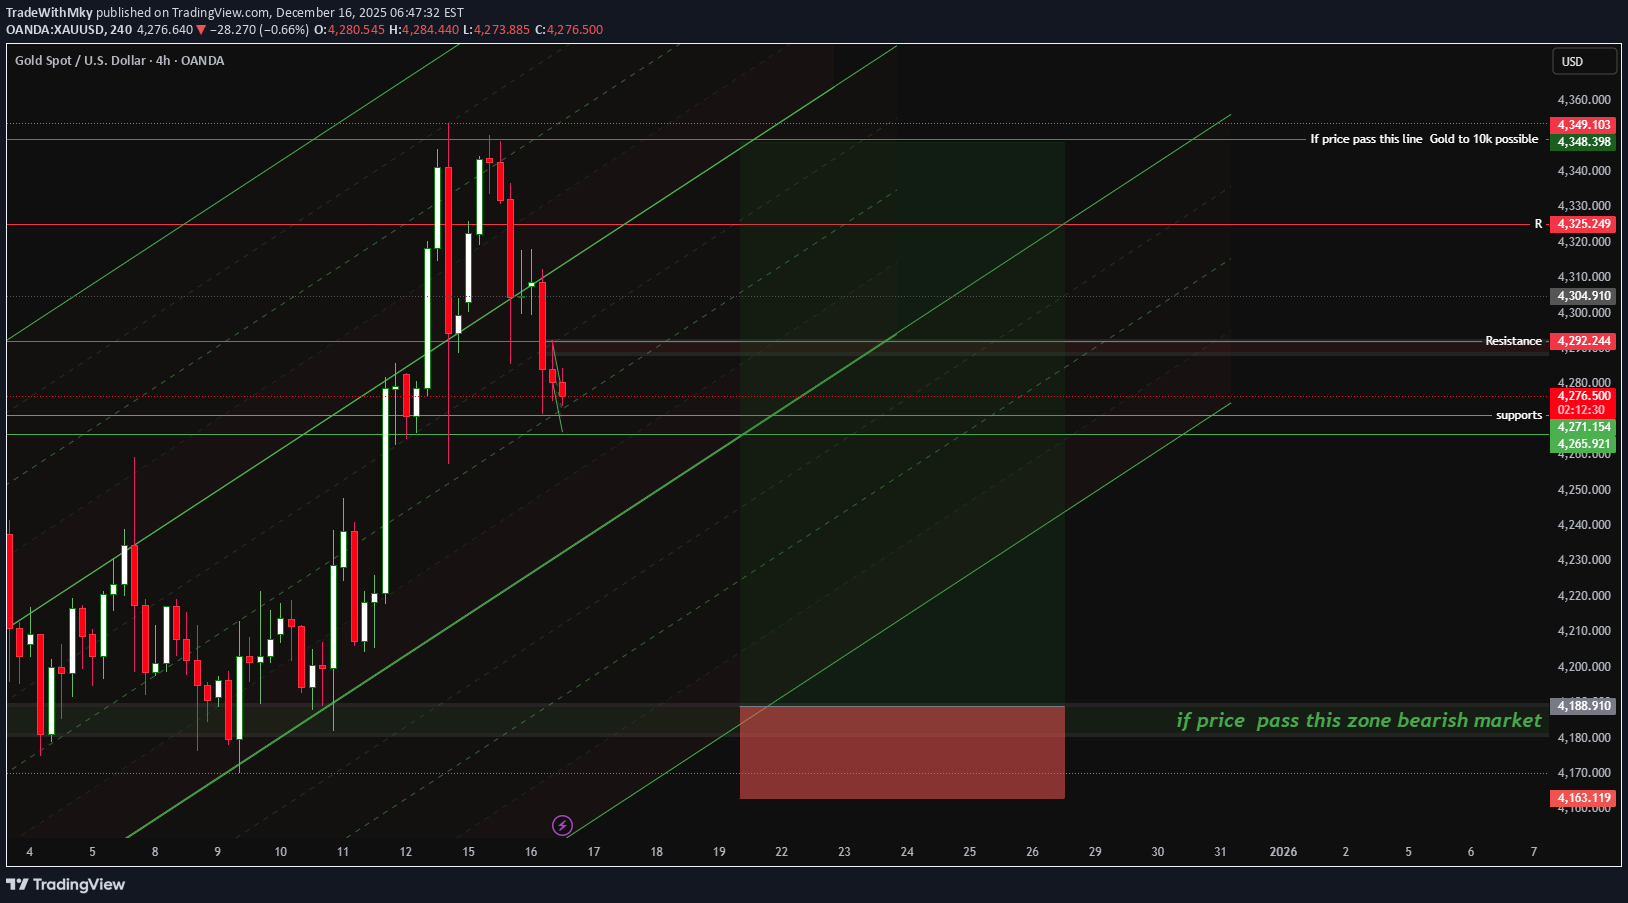
Professional Gold Market Analyst | Sharing Precise Trading Analyses and Strategies Greetings and best regards, I am a passionate financial market analyst specializing in the gold-to-US dollar pair (XAU/USD). My analyses focus on technical patterns like candlestick charts, support and resistance levels, and particularly trend channels to guide trading decisions. For instance, in recent charts, I've highlighted a descending channel (often visualized with dashed or "Chinese line" style indicators for clarity), where the upper channel line acts as dynamic resistance, currently hovering around the 2,050-2,100 USD price range, while the lower channel line serves as potential support near 1,950-2,000 USD. This setup suggests a bearish bias unless price breaks above the upper line, signaling a possible reversal. I share these precise setups, along with target profit zones and risk management tips, to help traders navigate volatile markets effectively. I always emphasize informed decision-making and invite your questions or feedback to foster a collaborative trading community. #ChannelTrading #XAUUSD #GoldTrading #TechnicalAnalysis #ForexInsights #TradeWithmky
TradeWithMky
پیشبینی صعودی بلندمدت اتریوم: نقشهراه ورود هوشمندانه به بالای 4700 دلار!
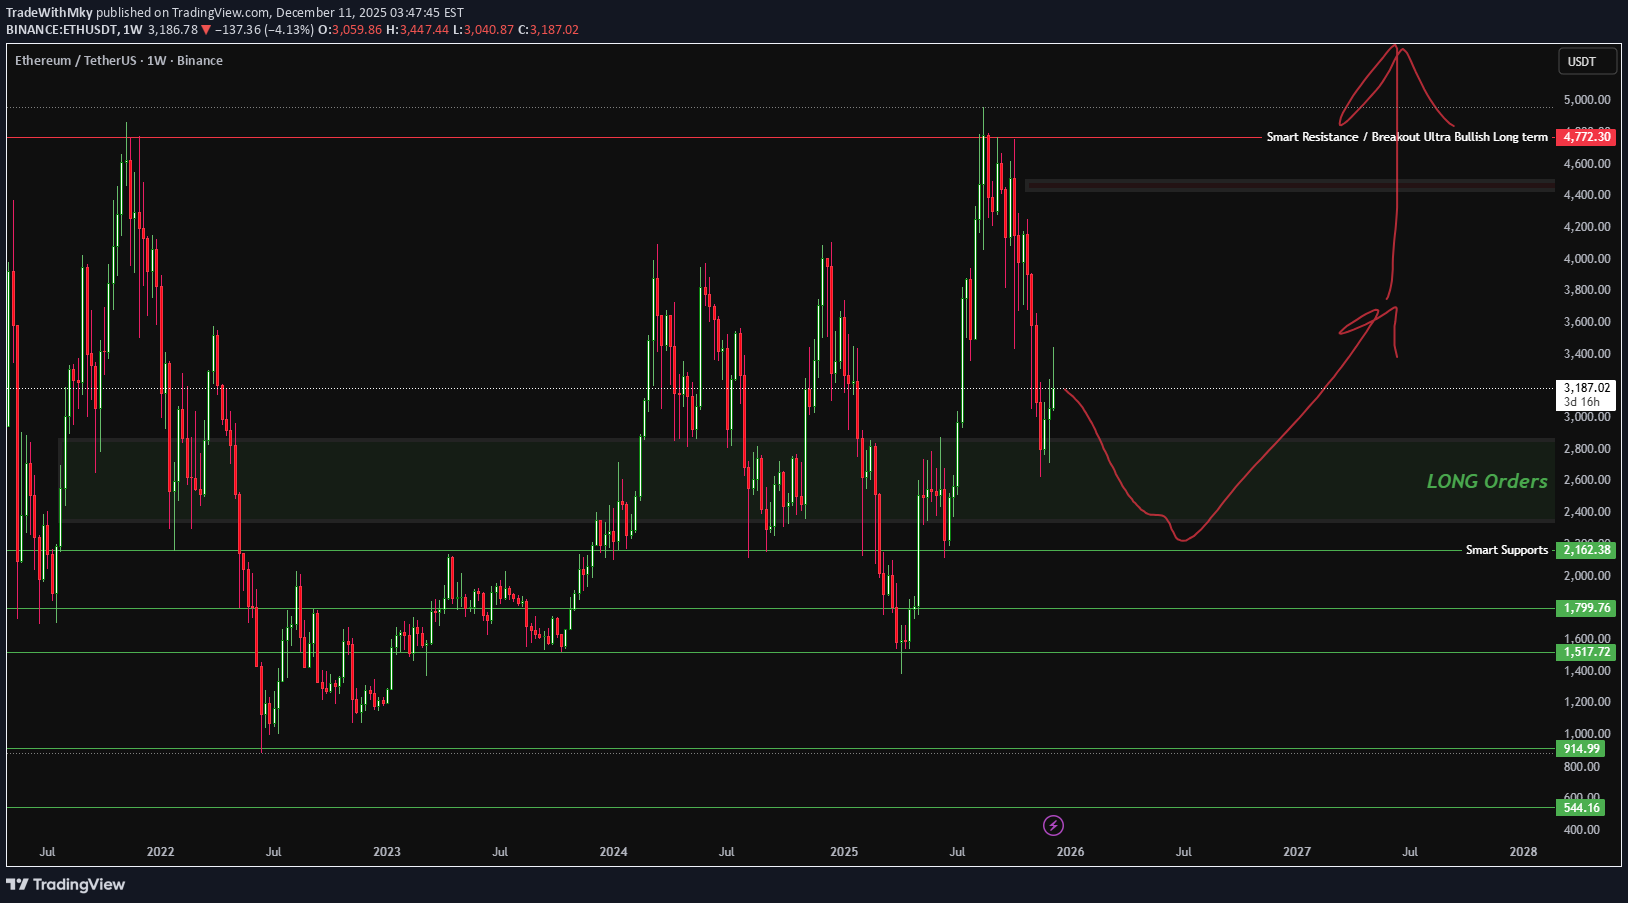
TradeWithMky Analysis — Weekly Timeframe Ethereum continues to respect major Smart Money levels, forming a broader accumulation structure inside a high-value demand zone. Price has tapped into the deeper support region where institutional long orders historically activate. As long as ETH holds above these Smart Supports, the long-term structure remains bullish. A liquidity sweep and deeper retracement toward the $2.4k–$2.1k Smart Support zone could create the perfect Miracle Shot entry, aligning with my strategy’s rule of waiting for exhaustion + re-accumulation before the impulsive leg. If price respects this zone, the next major target sits at the Smart Resistance around $4,700, which also aligns with a potential long-term breakout and continuation into an ultra-bullish expansion phase. Key Zones: Smart Supports: $2,162 – $1,799 – $1,517 Long Accumulation Zone: $2,400 – $2,700 Major Breakout Target: $4,772 This chart outlines a clean roadmap for a future bullish rally, with high-probability long opportunities if price retraces into the smart-money demand zones. Stay patient. Wait for the setup. The Miracle Shot always comes to those who wait.
TradeWithMky
Gold (XAU/USD) – Smart Money & Fibonacci Key Levels Analysis

This chart highlights potential short and sell opportunities on Gold (XAU/USD) using Smart Money concepts and Fibonacci retracement/extension levels. Key levels are marked for: Short entries: 4,252.44 Sell opportunity: 4,239.85 Smart Money Footprint: 4,225.57 Stop Loss: 4,271.57 Target levels are based on Fibonacci expansions (127%, 150%, 161%, 200%, 250%, 261%, 361%, 414%), showing areas where price might react or reverse. This setup combines price action reversal signals with structural levels to identify high-probability trades and manage risk efficiently.6755 pip 1 Side 📈100 pip first touch 📉⌛800 pip in first touch 📉600 pip second touch⌛Trend changed Bullish wait for long opportunities
TradeWithMky
تاییدیه حیاتی امروز برای صعود انفجاری BNB: شکست یا ریزش بیشتر؟
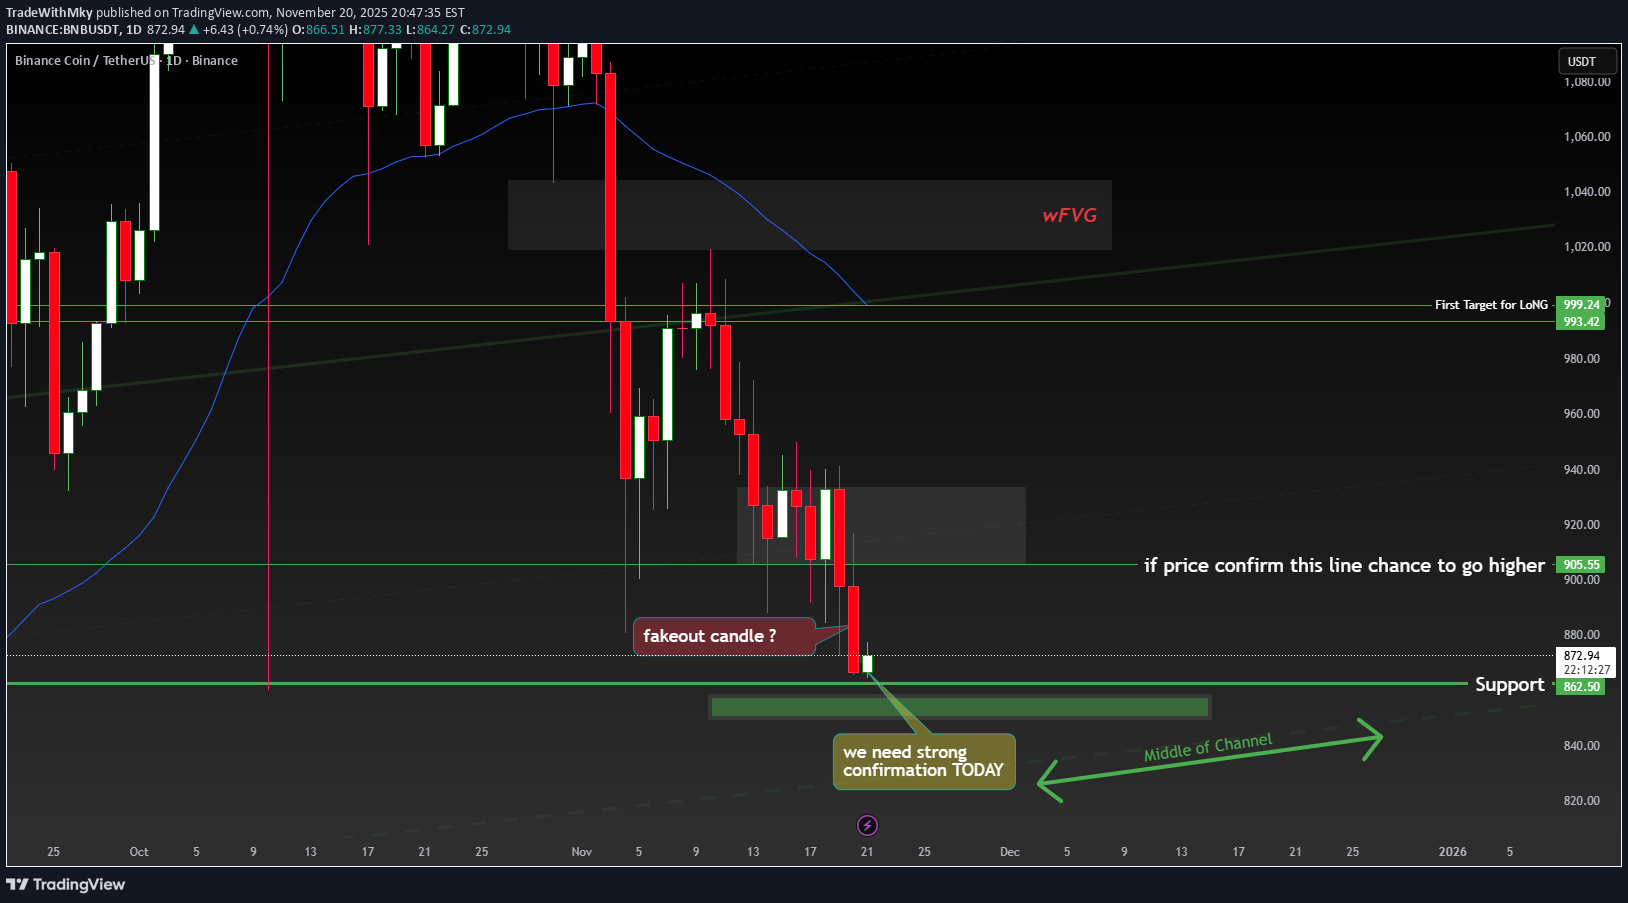
BNB just swept the $862 support with a massive fakeout candle – classic smart-money trap! Exactly like the wFVG sweeps we saw before every parabolic leg in the last bullrun. Right now price is sitting at the middle of the channel ($905 zone). ONE strong daily close above $905-$920 = green light to $999+ then $1,400+ fast. If we lose $862 clean → back to $770–$800 zone (I’ll buy even harder there). My exact plan: → Long above $920 (stop $858) → First target $999 → Final target this cycle still $2,000–$2,400 Who’s with me on this move? Drop 🚀 if you’re buying the dip or longing the breakout! Shouting out the real BNB legends on TradingView one by one – respect to all of you: Cryptocred – the king of clean levels, still calling for BNB $2k+ since $300 thecryptodog – the man who rode BNB from $17 like a boss Trader_XO – her BNB calls are pure fire, always early @CryptoNewton – technical monster, his channel analysis never lies donalt – the OG who said “BNB will outrun BTC this cycle” WiseAnalyze – volume profile god, his footprint data matches mine 100% @Alanmasters – been bullish on BNB since single digits, living legend @CryptoWolfSignal – his BNB long at $640 is aging like fine wine What do you kings and queens think – breakout today or one more shake to $800 first? 👇 🇮🇷 داداشای ایرانی: ما هیچوقت تو فیکاوت نمیفروشیم، همیشه تو ترس بقیه میخریم و تو طمعشون میفروشیم. این بار هم مثل همیشه میترکونیم 💪🇮🇷🦁 Save this chart and thank me at $2,000+ #BNB #BinanceCoin #Crypto #Altseason #ToTheMoon LET’S GOOOOO 🚀🚀🚀
TradeWithMky
بمب جدید کریپتو: آیا قیمت BNB به زودی ۳۰۰٪ منفجر میشود؟ (راز پول هوشمند فاش شد!)
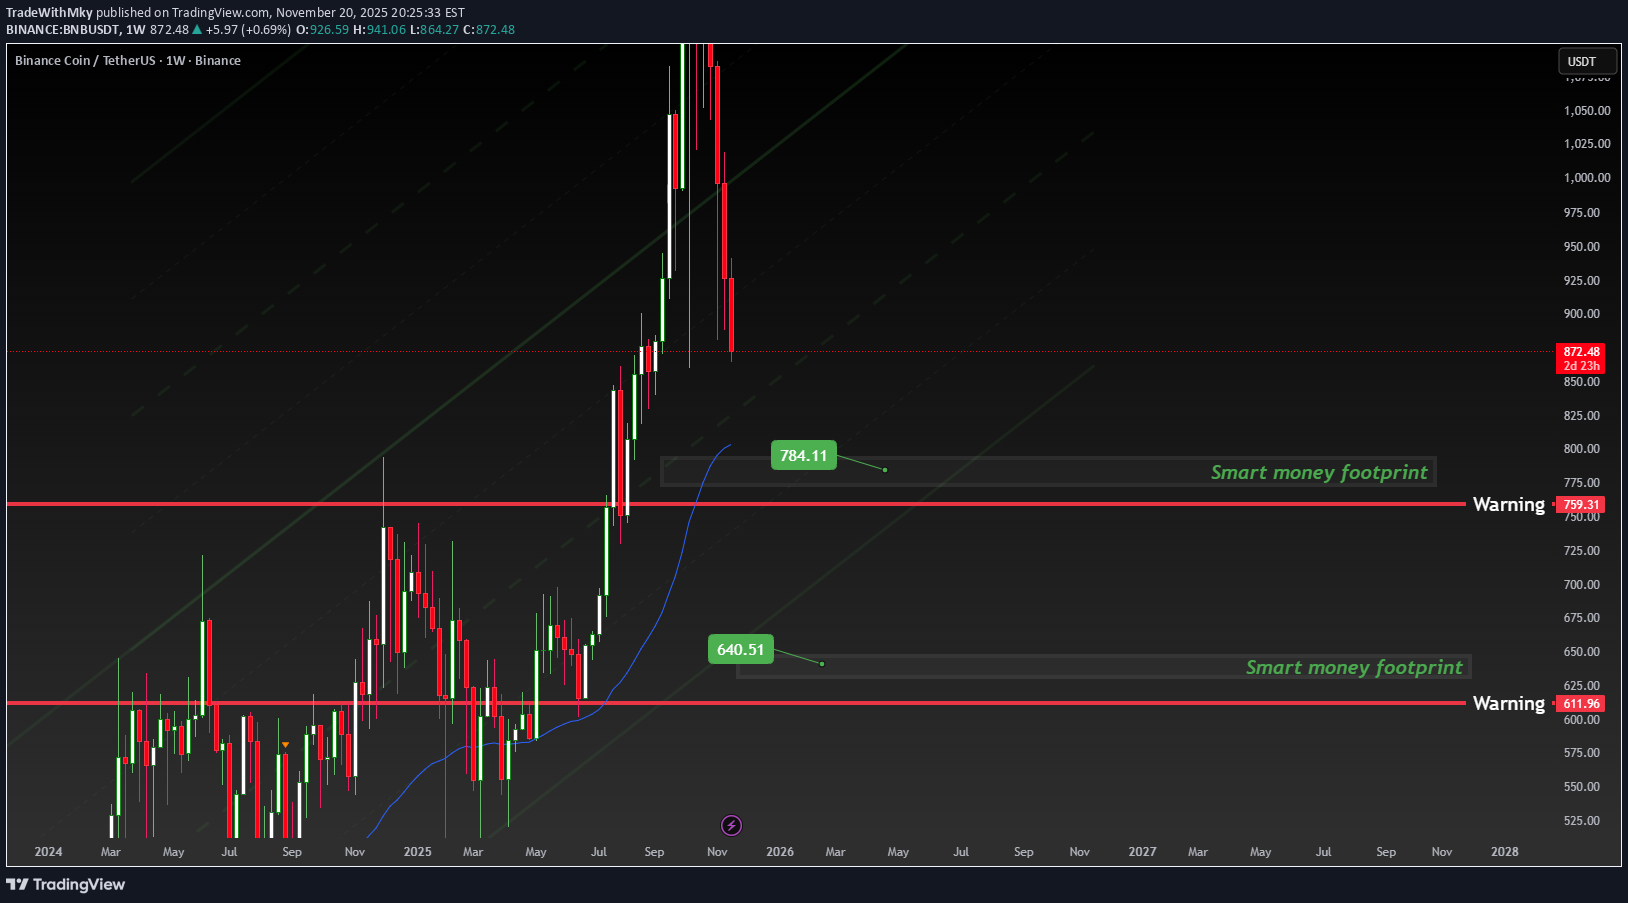
BNB ABOUT TO EXPLODE 300%?! Smart Money Already Loading at $784 & $640 – Don’t Miss the Next Leg Up! 🚀 This is the EXACT footprint I’ve been waiting for on BNB/USDT weekly timeframe! Smart money accumulated heavily at $640 and now defending the $784 zone like their life depends on it. Exactly the same pattern that launched us from $17 → $690 in 2021. History is literally repeating in front of our eyes! Every time BNB holds these “Smart Money Footprint” levels, we see minimum 3-5x moves. The weekly chart is screaming “accumulation phase over” – next stop $2,000+ in this cycle! Who else is stacking BNB right now? 👇 Tag your crew and let’s make this moon together! Shoutout to the BNB gods on TradingView: Cryptocred @CryptoWolfSignal thecryptodog Trader_XO donalt @CryptoNewton WiseAnalyze @Alanmasters – what do you guys think, is $2,000 incoming this cycle? 👀 Drop a 🚀 if you’re loading BNB under $800 Save this chart – you’ll thank me at $2,000+ #BNB #BinanceCoin #Crypto #Altseason #1000xAlso we have this zone for sellers
TradeWithMky
فرصت انفجاری خرید اتریوم: ورود به منطقه طلایی اسمارت مانی با ریسک به ریوارد استثنایی!
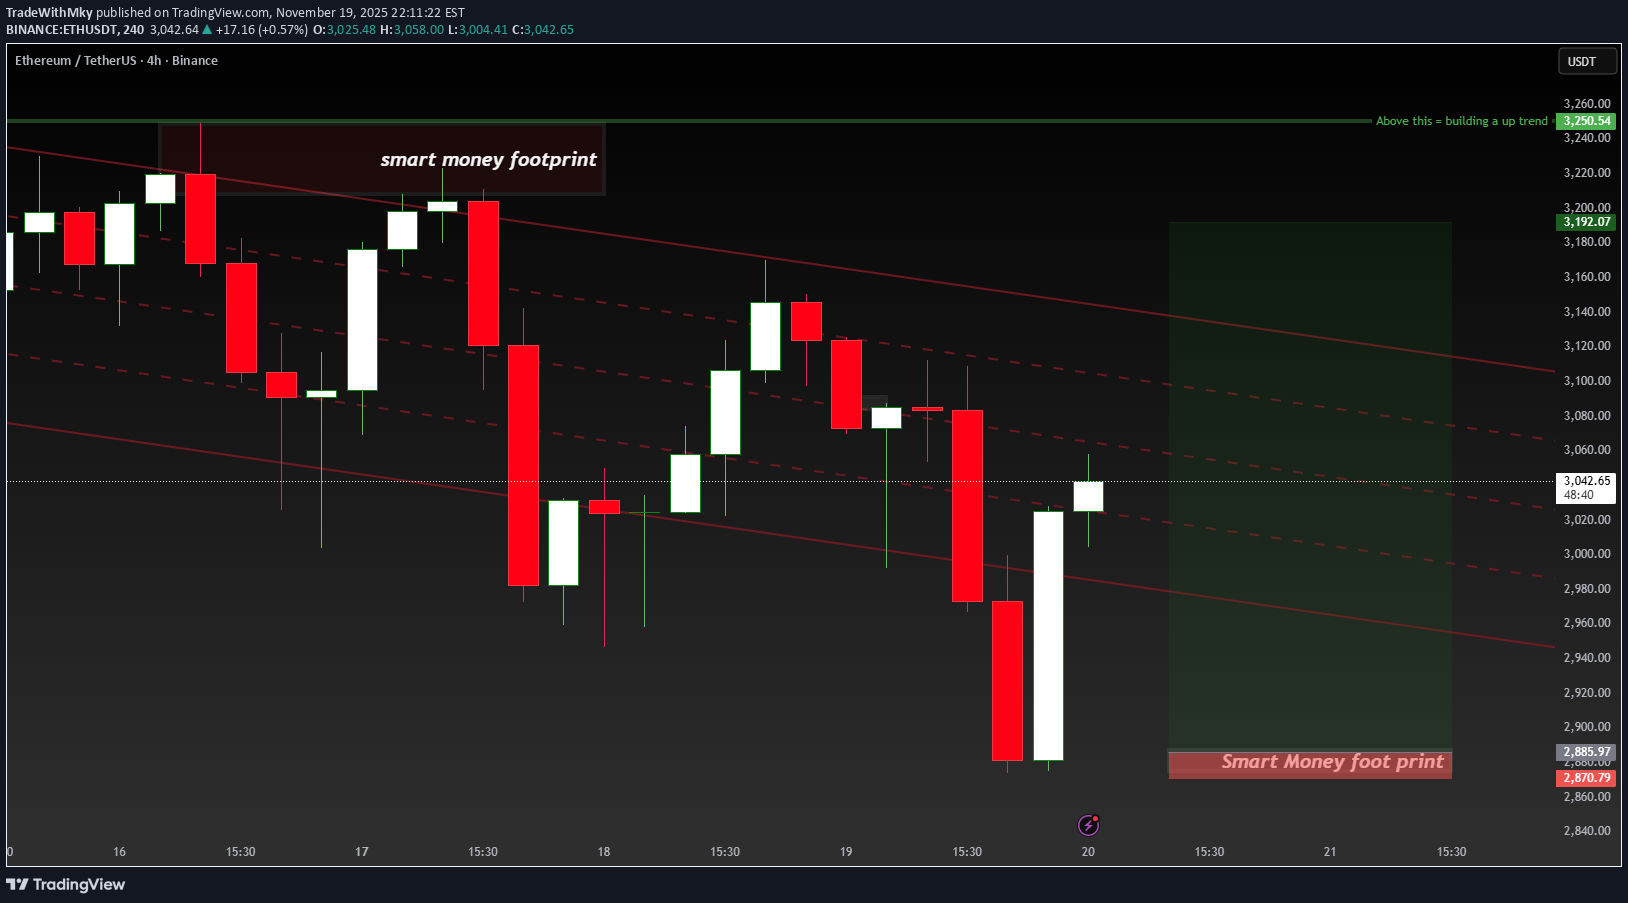
ETH/USDT — 4H This chart reveals a clean Smart Money Footprint sitting exactly at the end of the current corrective leg. Price rejected the upper channel line and tapped deep into the discount zone, creating a high-probability reversal setup. 🔥 Why This Setup Matters Price tapped SM footprint liquidity Clear mitigation and bounce structure forming Market is still trading inside a bearish channel — but we’re now entering the ideal long zone Target is aligned with the mid-channel & previous inefficiency levels 📈 Trade Idea (Not Financial Advice) LONG: Around the Smart Money Footprint SL: Below the footprint low TP: 3,150 → 3,250 zone This creates a monster R:R opportunity if the structure shifts to bullish. “ETH is tapping into a deep Smart Money discount zone. Liquidity swept, footprint printed, structure shifting. If the bounce confirms, this becomes one of the cleanest R:R setups of the week. Watching the 3,150–3,250 range for targets.”
TradeWithMky
بیت کوین در حال ریزش است یا انباشت پنهان؟ حرکت بزرگ بعدی نزدیک است!
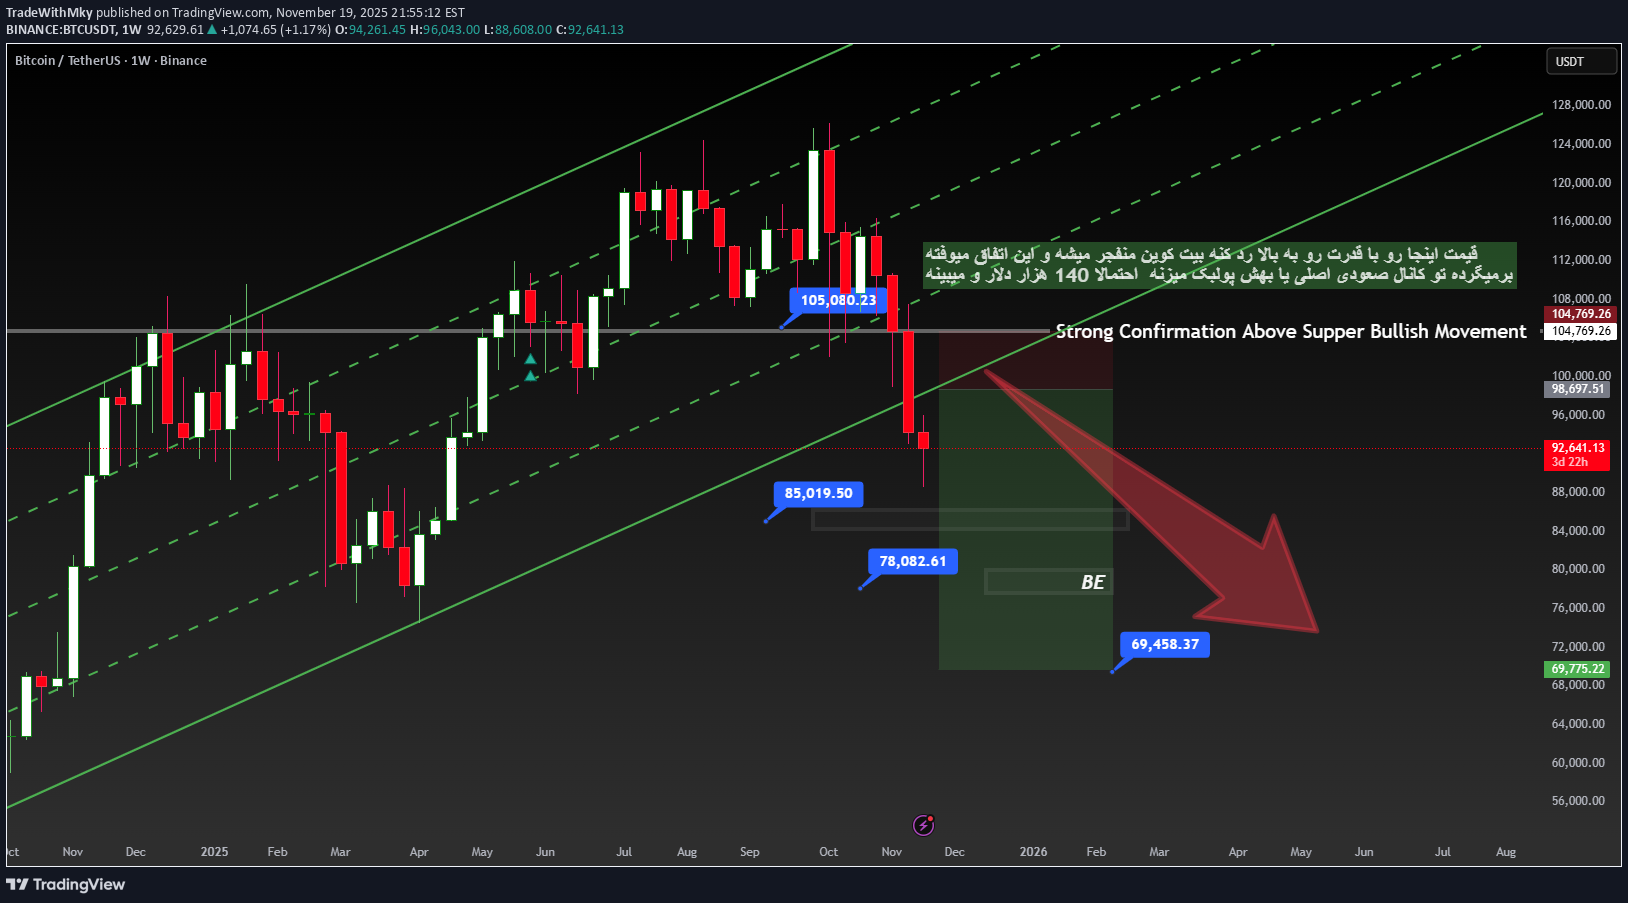
MagicPoopCannon Vibes “Bitcoin Breakdown or Hidden Re-Accumulation? BIG MOVE Loading… ⚠️ Bitcoin just tapped a critical structural level inside the macro channel — and this chart shows exactly where the real liquidity vacuum sits. Price failed to reclaim the upper regression band and is now sliding toward the mid-channel + major demand zones. My mapped levels: 📌 85,019 → First liquidity pocket 📌 78,082 → High-probability reaction zone 📌 69,458 → Final sweep before a potential mega-reversal A break below the key mid-channel zone could trigger a full liquidity hunt before any strong bullish continuation. But if BTC flips the 104–105K region with conviction, we may see the type of explosive breakout that legends like TradingShot , CryptoBullet , and MagicPoopCannon often highlight. ⚠️ This setup is high-confluence, high-volatility, and high-reward. If this plays out, it will be remembered. Drop your thoughts below — do you expect the sweep, or the breakout? 👇🔥 Let’s make this chart viral.
TradeWithMky
شکست شوکهکننده اتریوم: صف "فشار فروش" سوخت! هدف بعدی ۳۰۰۰ دلار؟
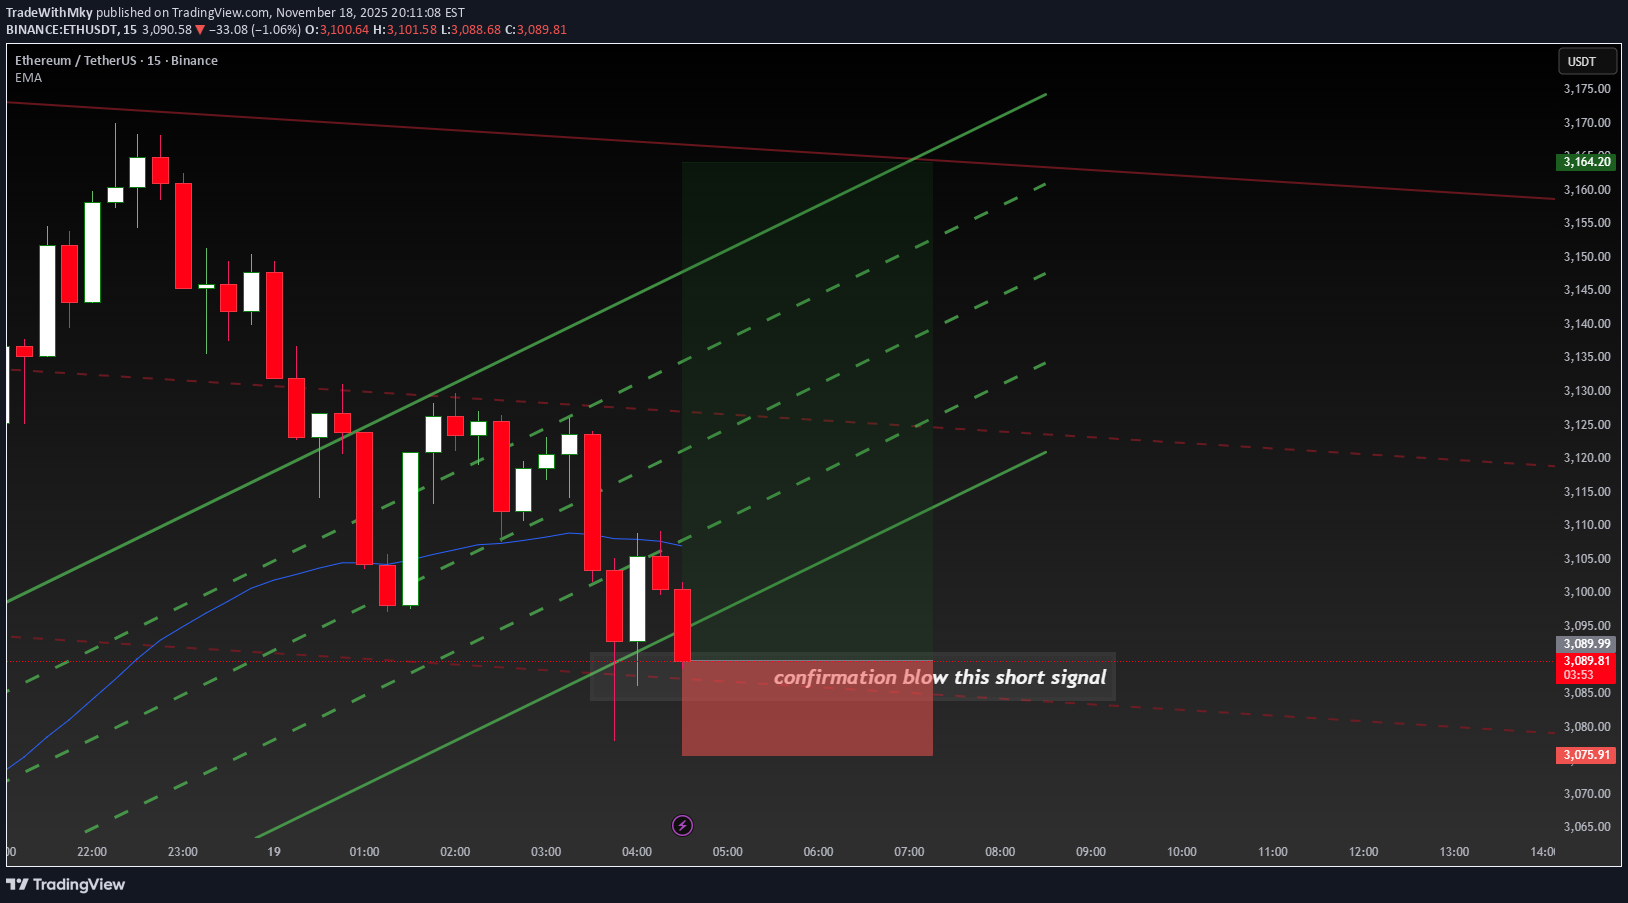
ETH UPDATE: The short squeeze everyone was praying for just got INVALIDATED hard. - Fake breakout above descending trendline → trapped longs - EMA 3,107 acting as perfect resistance - Clear lower high formed - Confirmation candle just closed under the channel Target: 3,000 – 2,950 zone retest (80–90% probability this week) I warned the bulls 48h ago – now it’s happening live. Legends who saw this coming too: Cryptocred CryptoCapo_ thecryptodog Pentosh1 donalt cryptokaleo Anbessa100 Trader_XO IncomeSharks @CryptoTony__ @CryptoNewton RaoulGMI cryptocobain Cryptowizardd @0xGreed Bookmark this chart – you’ll want to show your friends when ETH hits 3k. NOT financial advice – just what the chart is screaming right now 🩸 #Ethereum #ETH #ShortSqueezeFailed #AltseasonOver
Disclaimer
Any content and materials included in Sahmeto's website and official communication channels are a compilation of personal opinions and analyses and are not binding. They do not constitute any recommendation for buying, selling, entering or exiting the stock market and cryptocurrency market. Also, all news and analyses included in the website and channels are merely republished information from official and unofficial domestic and foreign sources, and it is obvious that users of the said content are responsible for following up and ensuring the authenticity and accuracy of the materials. Therefore, while disclaiming responsibility, it is declared that the responsibility for any decision-making, action, and potential profit and loss in the capital market and cryptocurrency market lies with the trader.