
AVAX
Avalanche
| تریدر | نوع سیگنال | حد سود/ضرر | زمان انتشار | مشاهده پیام |
|---|---|---|---|---|
 SaitamasignalRank: 35 | فروش | حد سود: تعیین نشده حد ضرر: تعیین نشده | 12/16/2025 | |
 Richtv_officialRank: 29646 | خرید | حد سود: تعیین نشده حد ضرر: تعیین نشده | 3 hour ago | |
 SwallowAcademyRank: 30684 | خرید | حد سود: تعیین نشده حد ضرر: تعیین نشده | 12/16/2025 | |
 Mike-BTDRank: 32025 | خرید | حد سود: تعیین نشده حد ضرر: تعیین نشده | 12/3/2025 | |
خرید | حد سود: تعیین نشده حد ضرر: تعیین نشده | 12/7/2025 |

Price Chart of Avalanche
سود 3 Months :
خلاصه سیگنالهای Avalanche
سیگنالهای Avalanche
Filter
Sort messages by
Trader Type
Time Frame
Richtv_official
AVAX Long Setup – Support Test in Play
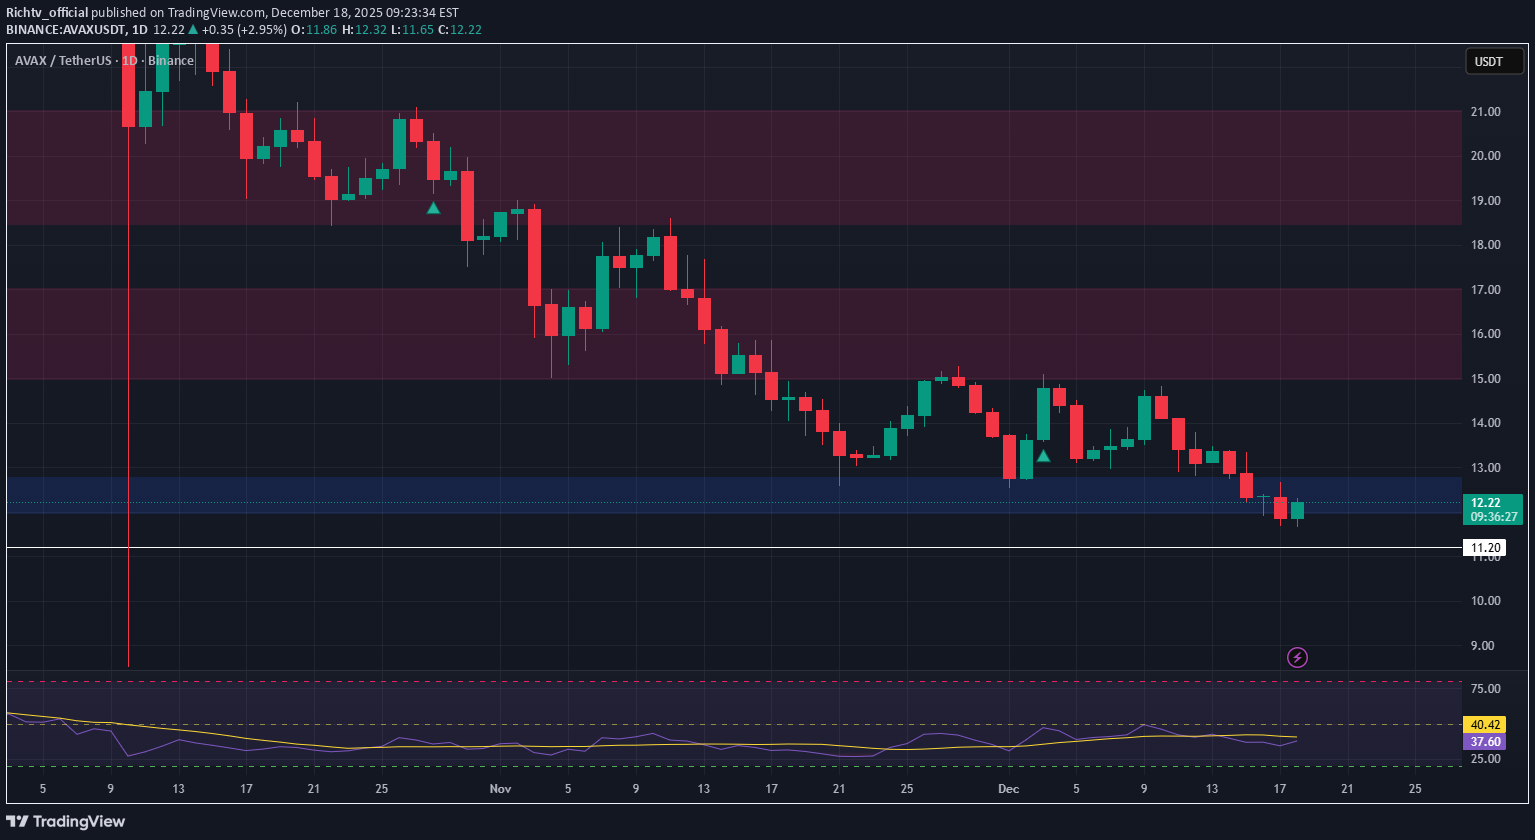
Avalanche (AVAX) is currently testing a key support level, presenting a potential long setup for spot traders. This zone has held up previously and could act as a launchpad for a move higher if buyers regain control. 🔹 Entry Zone: $12.00 – $12.75 🔹 Take Profit Targets: • TP1: $15.00 – $17.00 • TP2: $18.50 – $21.00 🔹 Stop Loss: Below $11.20

Nabi_Gunduz
AVAX - 17.12.2025
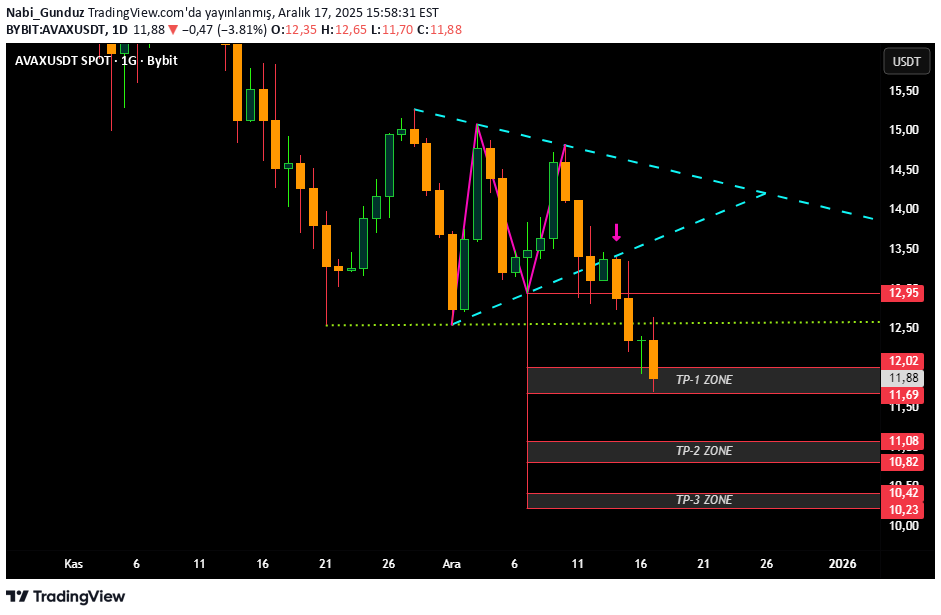
If the TP-1 zone breaks downwards, the decline may continue...

SwallowAcademy
Avalanche (AVAX): Sellers Taking Control | Waiting For Setup
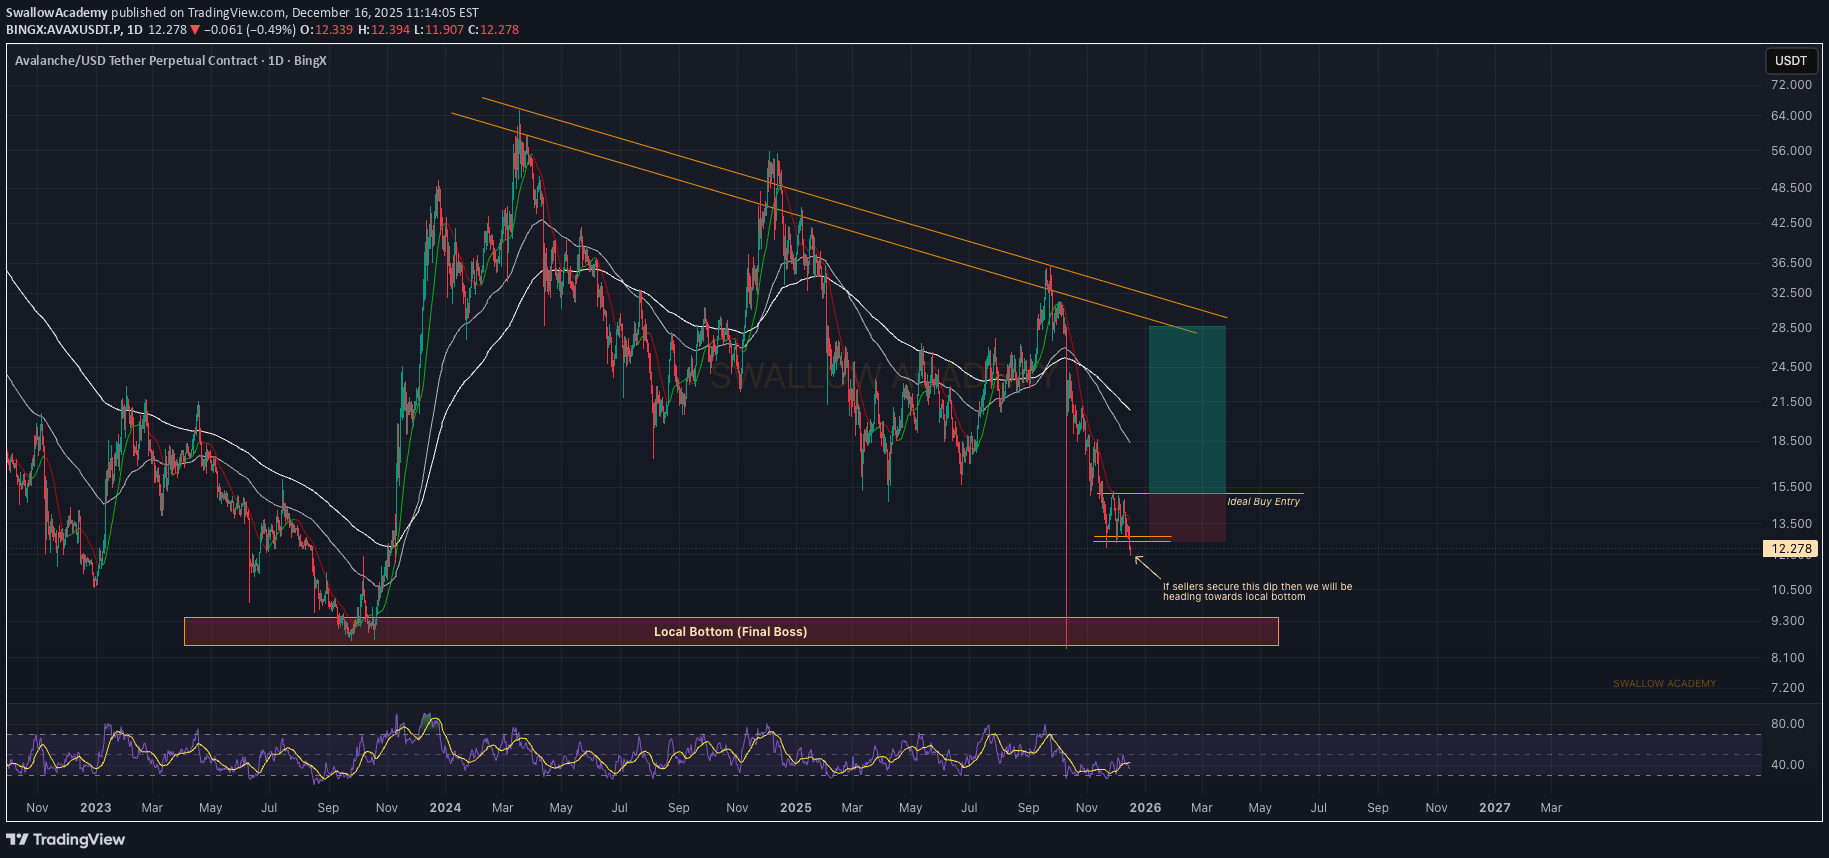
AVAX just broke a smaller local support, but so far sellers are not really showing strong pressure. The move down looks more like a quick liquidity sweep rather than a clean breakdown and control. If sellers manage to secure this breakdown and the price accepts below the broken support, then we will likely see another dip toward the local bottom. But as mentioned before, nothing is confirmed yet; we look for a recovery and once we see that, we are open to a good long setup! Swallow Academy
Saitamasignal
AVAX breakdown
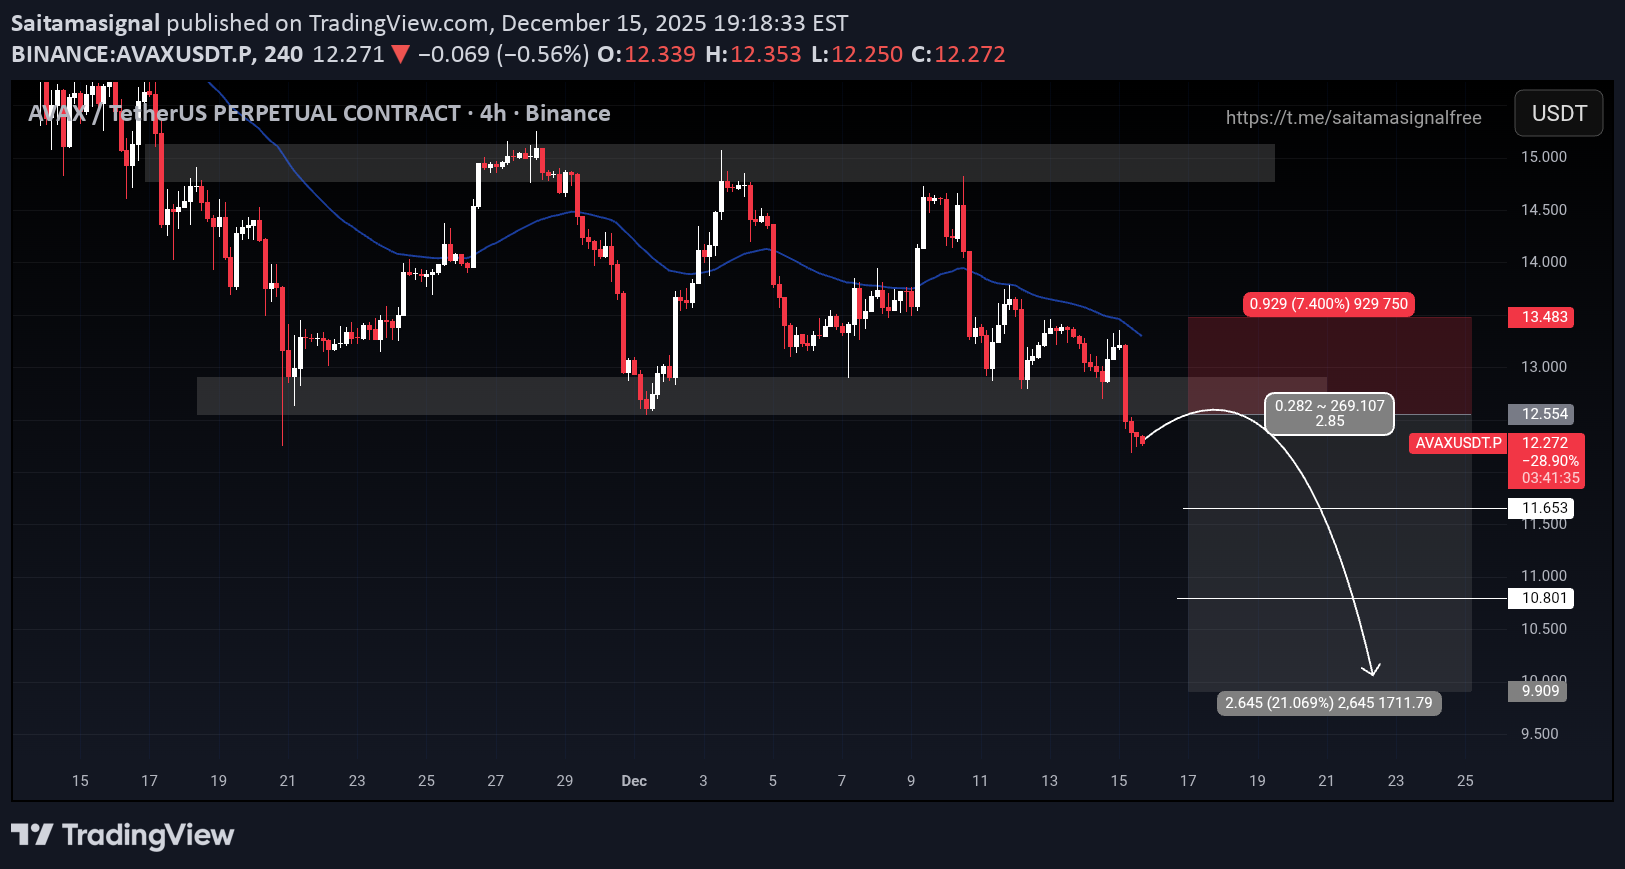
COIN NAME : AVAXUSDT ( isolated ) Sell short zone : 1) 12.554 Take profit : 1) 11.653 2) 10.801 3) 9.909 Stop loss : 13.483 Max leverage: 5x Amount : 2.0% Disclaimer: This is not financial advice. Always do your own research and use strict risk management. The crypto market is highly volatile.

abusarasr
Avax TOP price is around 125-150 usd
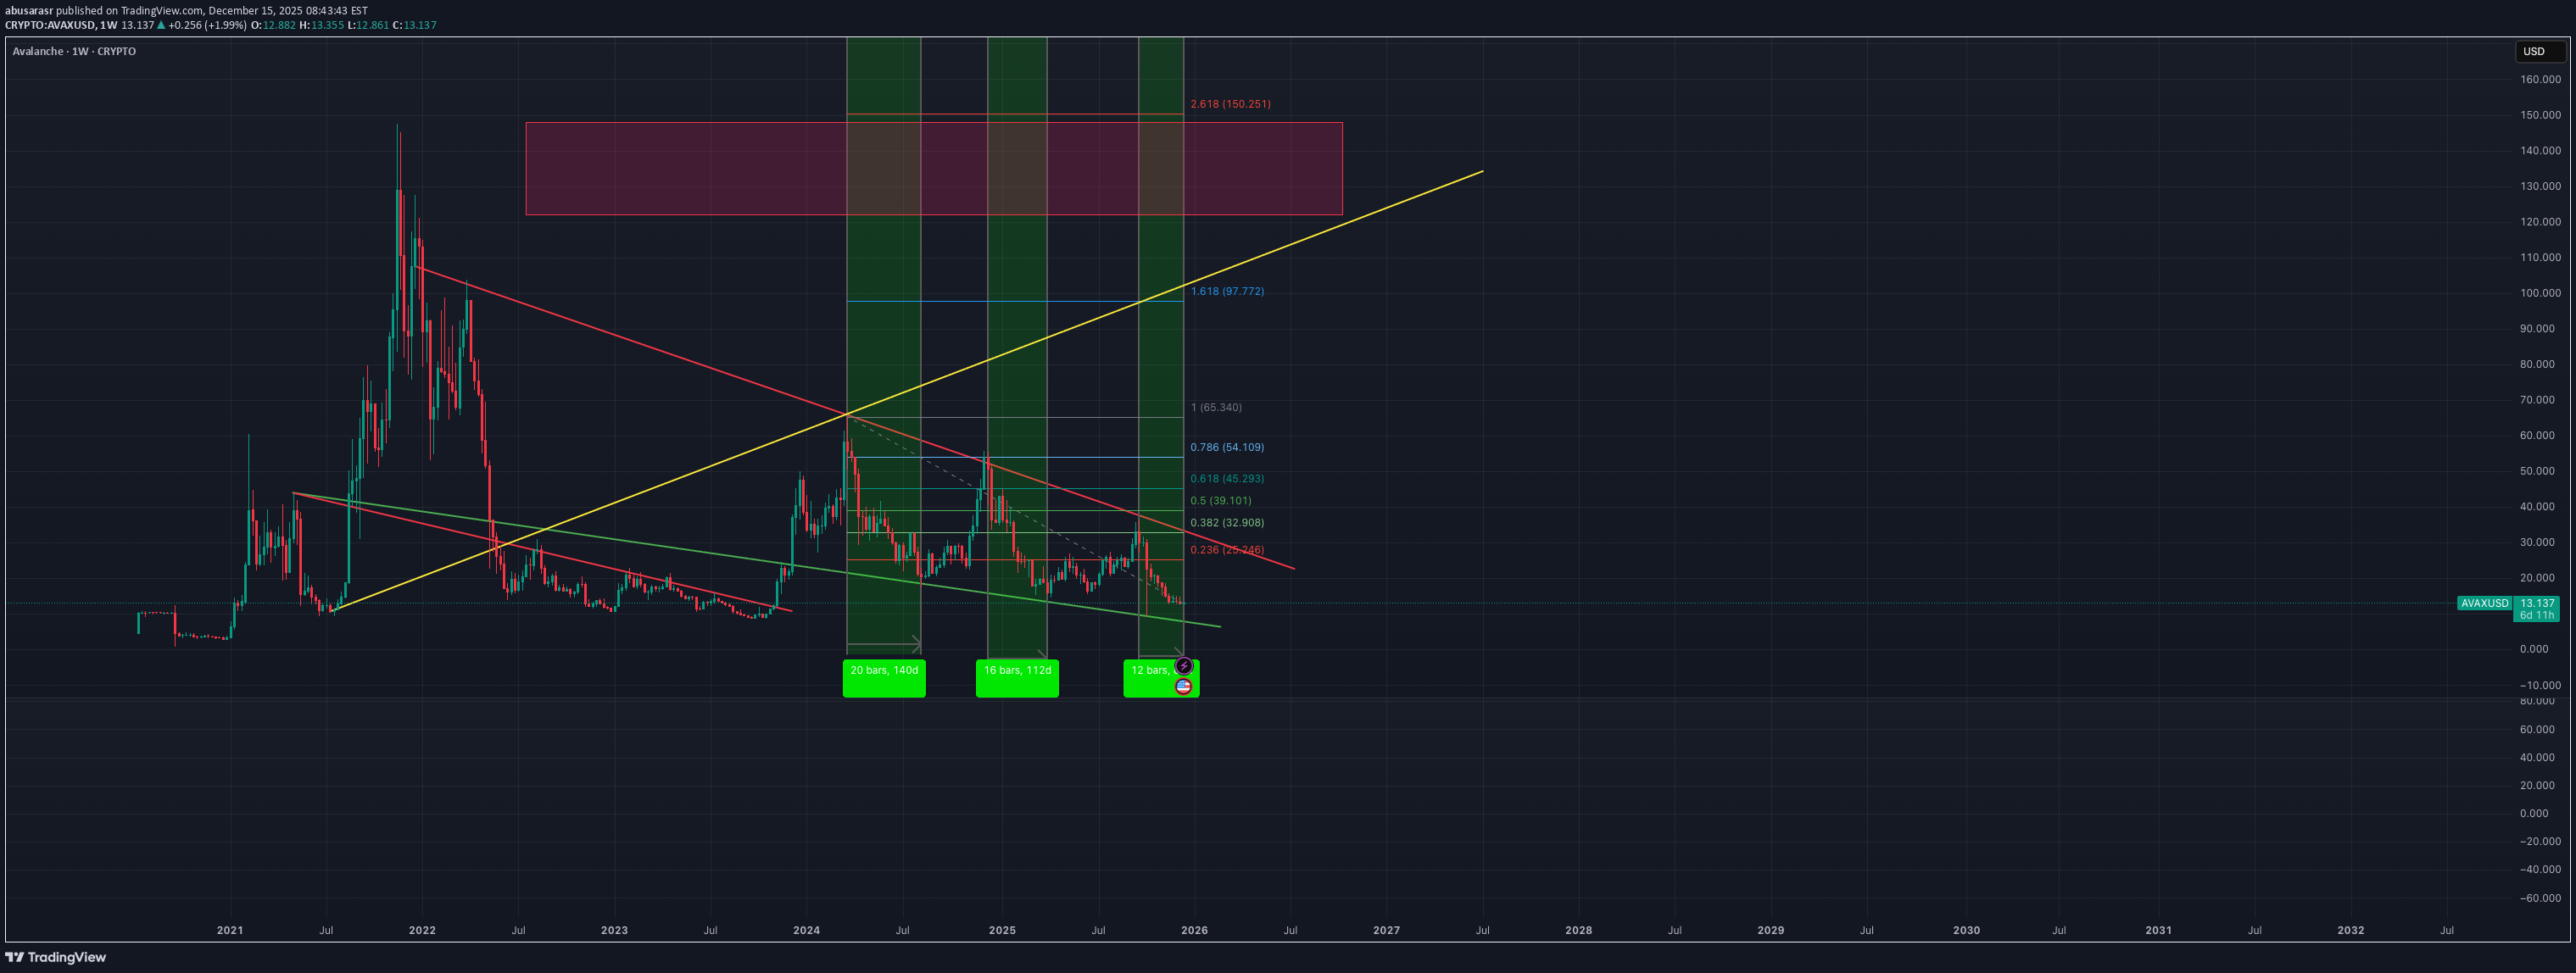
there are big w pattern and week is reducing every 4 week and we are now in bottom week so expecting top and exit price is around 125-150 usd which is whole crypto market will be euphoria

CryptoAnalystSignal
#AVAX/USDT : The Calm Before the Squeeze Storm
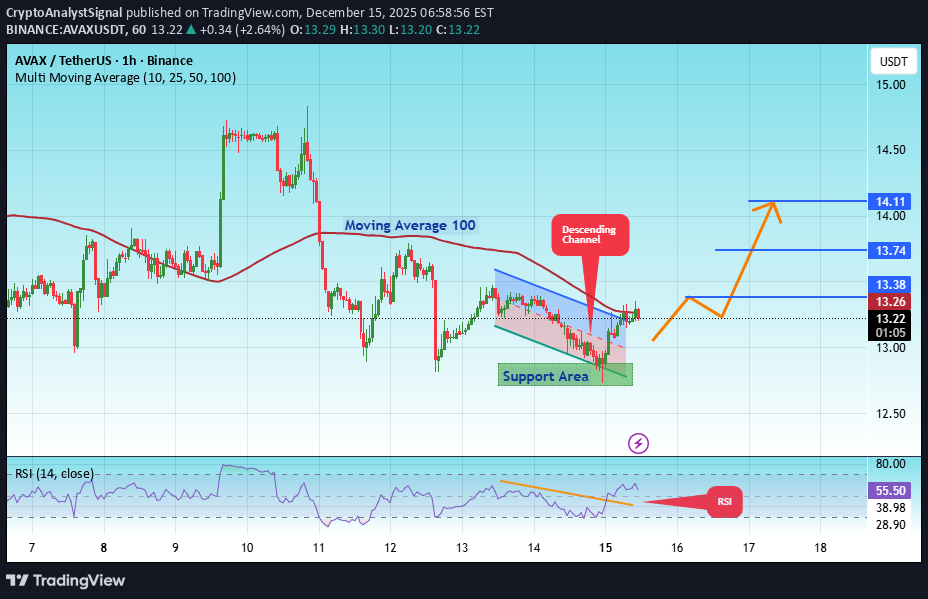
#AVAX The price is moving in a descending channel on the 1-hour timeframe. It has reached the lower boundary and is heading towards breaking above it, with a retest of the upper boundary expected. We have a downtrend on the RSI indicator, which has reached near the lower boundary, and an upward rebound is expected. There is a key support zone in green at 12.80. The price has bounced from this zone multiple times and is expected to bounce again. We have a trend towards stability above the 100-period moving average, as we are moving close to it, which supports the upward movement. Entry price: 13.22 First target: 13.38 Second target: 13.74 Third target: 14.11 Don't forget a simple principle: money management. Place your stop-loss below the support zone in green. For any questions, please leave a comment. Thank you.
Mike-BTD
AVAX make it or break it.
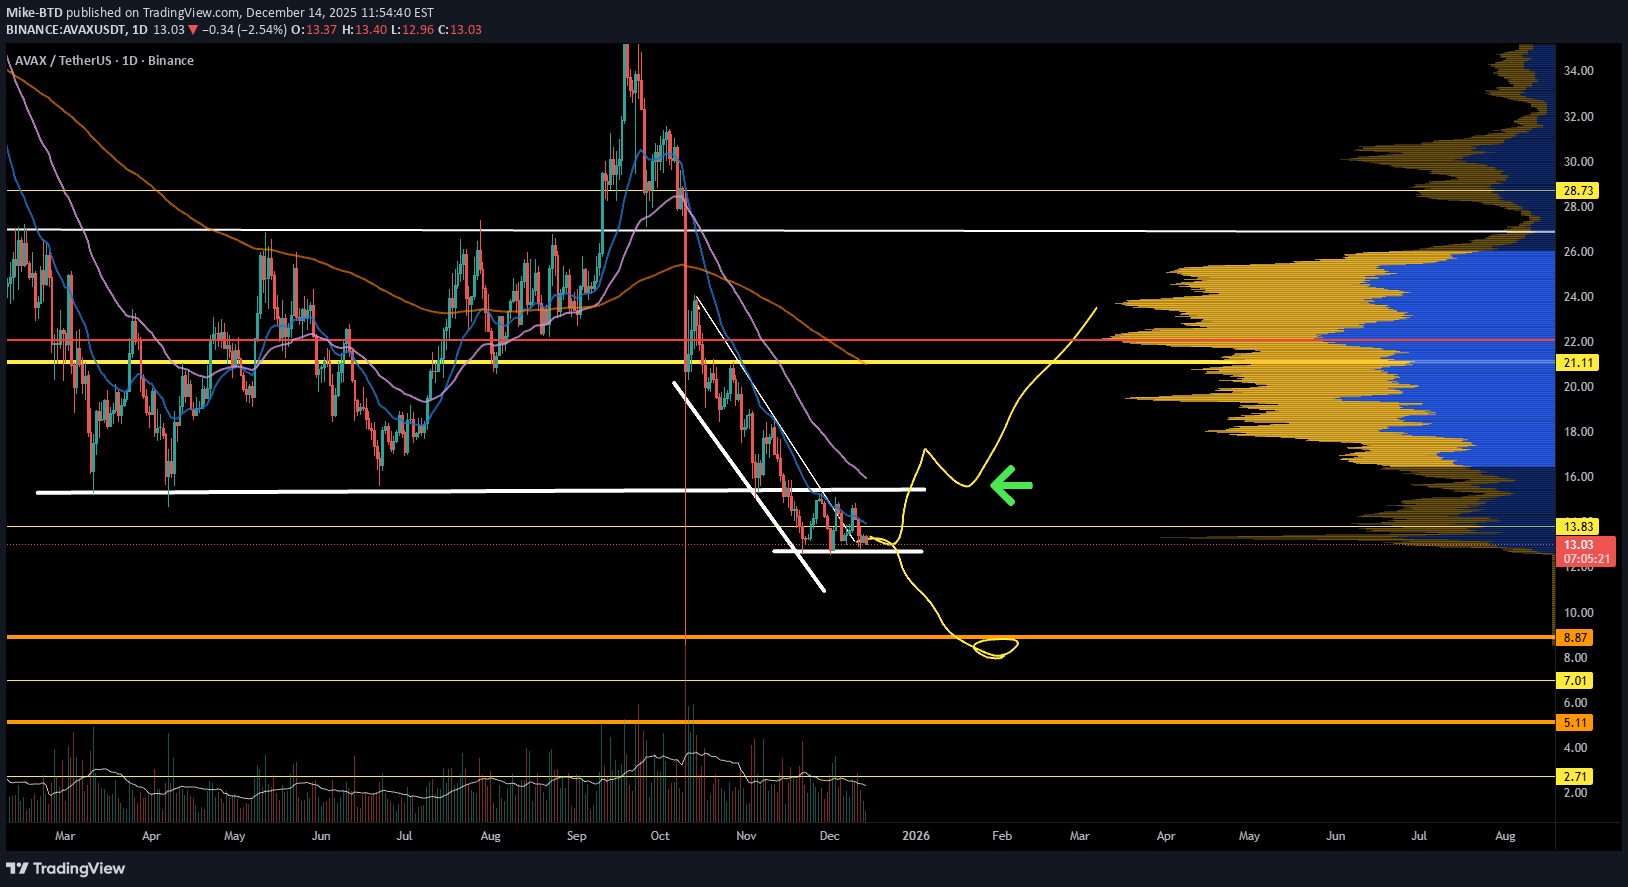
AVAX remains in a broader downtrend, but price is now sitting at a well-defined demand zone where selling pressure has clearly slowed. The aggressive move down has transitioned into tight, compressed candles, often seen when sellers begin to lose control. Market structure is still technically bearish, but momentum is no longer expanding lower. Instead, price is stabilizing, suggesting the move may be shifting from continuation into a potential pause or base. If this area holds, a relief move back into prior resistance and high-volume territory becomes likely. If it fails, AVAX risks another leg lower with little support below. This is a high-importance zone where the next trend leg forms. Bounce or breakdown?

ThetaNomad
AVAX - LONG - SQUEEZE TRAIN LOADING
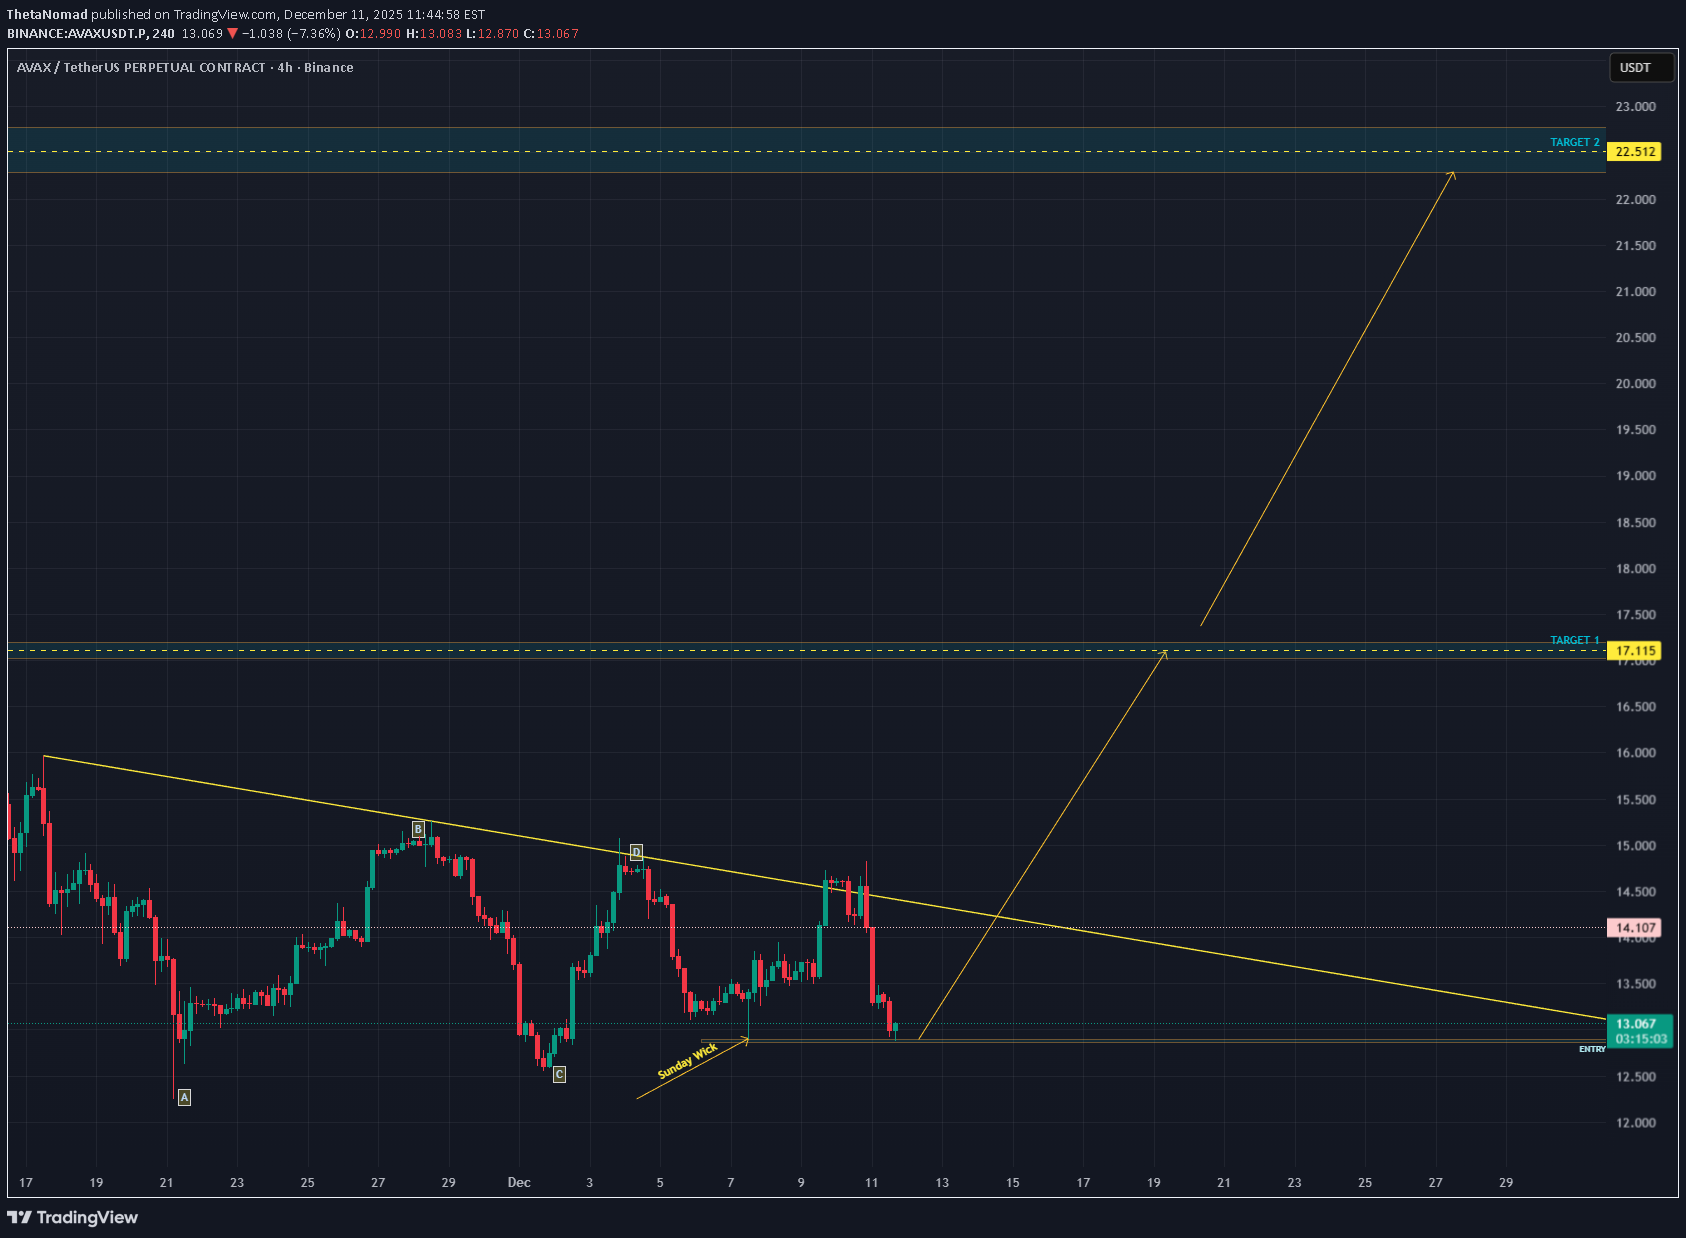
Traders, I believe AVAX is getting ready to load a squeeze train upwards. This move might be quick, fast and harsh, the kind of reversal that catches traders off guard and leaves late shorts wondering what just happened. Price has returned to a deep support zone where two separate Fibonacci retracements align. The 0.786 level from the A to B leg sits exactly at the current price. The 0.886 level from the C to D leg lands in the same place. When two independent fib legs converge like this, it often marks a high interest area where stronger hands quietly position and wait. Before reaching this zone the market swept the Sunday wick. Sunday wicks are created during thin weekend volume without meaningful institutional presence. Because they form on weak liquidity, the market tends to revisit and clear them once real volume returns. Sweeping this wick removed weak weekend longs, cleaned the structure and collected liquidity needed for a sustained move. Order Flow is lining up. Spot buyers are absorbing selling while perp traders are shorting into the lows. Spot CVD is rising which shows genuine demand. Both coin margined and stablecoin margined CVD are falling which shows leveraged shorts pressing down. Net Shorts are increasing at the bottom. Open Interest is rising at the same time. This confirms new short positions are opening rather than closing. When spot accumulation meets leveraged short pressure at deep fib support, the stage is set for a squeeze. The first target above is the 1.618 extension of the A to B leg. This is the expected continuation level after a deep 0.786 retracement. It also aligns with a higher time frame 0.786 level not shown here to keep the chart clean. Confluence at the target strengthens its gravitational pull. AVAX has swept liquidity, tapped strong fib confluence and attracted late shorts into the structure. All the ingredients for a fast upside squeeze are present. Summary • Two fib retracements meet at the current level • Sunday wick swept which removes weak weekend positions • Spot CVD rising which shows real buying • Perp CVD falling which shows leveraged short pressure • Net Shorts rising at the lows • Open Interest rising which confirms new shorts opening • Squeeze conditions forming • First target is the 1.618 extension of A to B • This target aligns with a higher time frame 0.786 Final Thought The market does not shout its intentions. It whispers through structure, flow and confluence. Deep retracements, cleared liquidity and patient accumulation often appear right before sudden expansion. AVAX feels ready to shift tone and when it does, the shorts gathered at the lows may find themselves riding the squeeze train the wrong way. Targets and Invalidation My first target is 17.115, which aligns with the 1.618 extension of the A to B leg and fits the structure of a classic deep retracement continuation. My second target is 22.5, a level that connects beautifully with mid-range liquidity left behind on the way down and acts as a natural expansion point once the first target is cleared. For the more mid to long term, I am watching 31.25, which sits directly inside a higher time frame inefficiency zone and marks the beginning of true trend continuation rather than a simple corrective squeeze. Invalidation sits cleanly at 12.275, the low of point A. If price breaks below that level, the structure of the current idea collapses and the setup no longer fits the narrative of a squeeze. Until that level is violated, the bullish structure remains intact and the path of least resistance stays upward. ---------------- If you like this analysis, feel free to leave a like or a comment. I am not asking for money and I am not trying to sell anything. I simply enjoy helping people look through the noise and understand the structure beneath the chaos.

P_S_trade
Avalanche AVAX price analysis
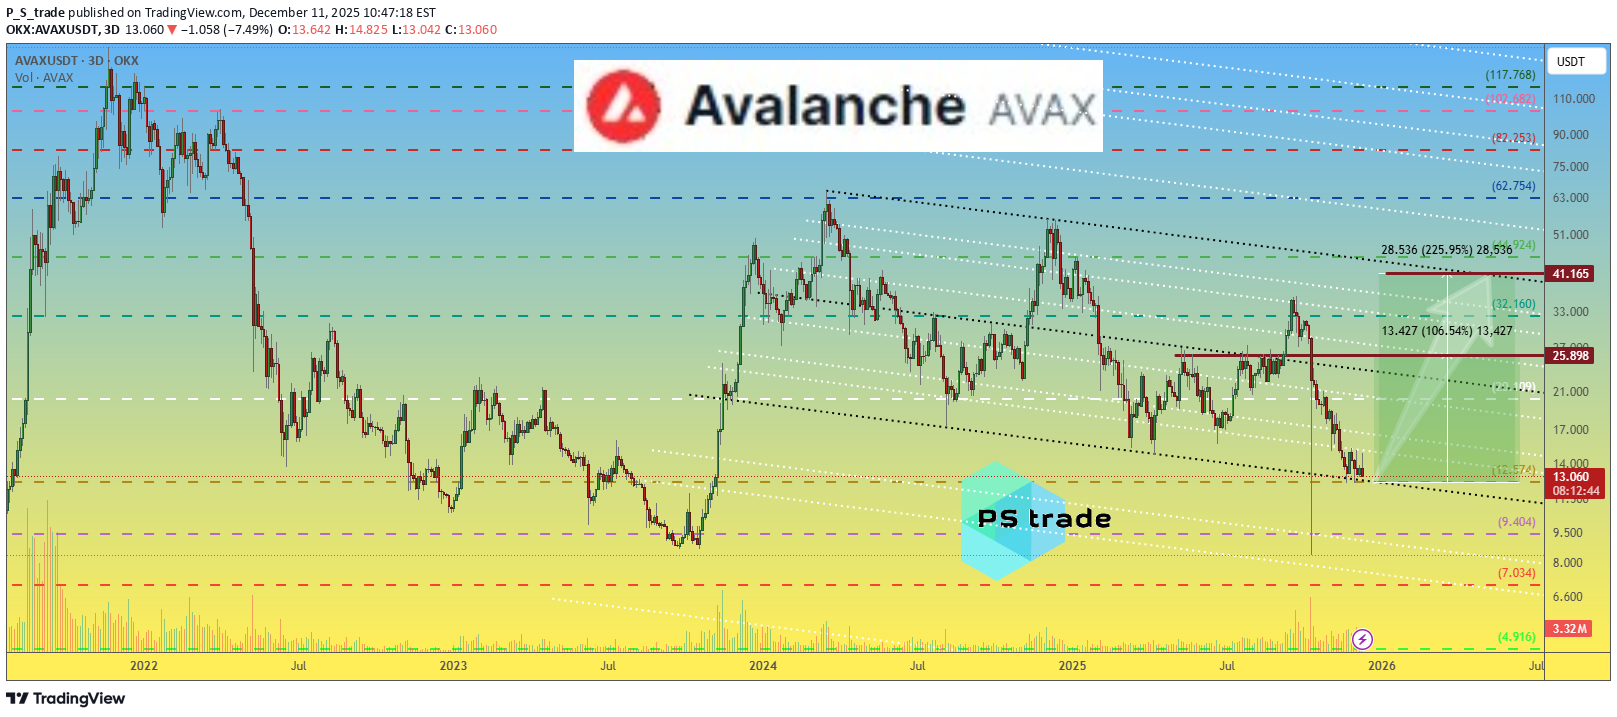
AVAX right on the bottom of the 2-year channel! The price of AVAX is once again touching the lower boundary of a massive channel that has been forming for more than 24 months. And what’s interesting — #Avalanche has strong fundamentals, active development, and a “starting” market cap of $5.5B 💰 📈 So… is it finally time for AVAXUSDT to move up? 🔹 Conservative target: +100% → $26 🔹 Ambitious but realistic: upper channel → $41–42 (+225%) Looks juicy, right? 🤔 Do you think AVAX is gearing up for a breakout — or are we in for another round of accumulation? ______________ ◆ Follow us ❤️ for daily crypto insights & updates! 🚀 Don’t miss out on important market moves 🧠 DYOR | This is not financial advice, just thinking out loud
Disclaimer
Any content and materials included in Sahmeto's website and official communication channels are a compilation of personal opinions and analyses and are not binding. They do not constitute any recommendation for buying, selling, entering or exiting the stock market and cryptocurrency market. Also, all news and analyses included in the website and channels are merely republished information from official and unofficial domestic and foreign sources, and it is obvious that users of the said content are responsible for following up and ensuring the authenticity and accuracy of the materials. Therefore, while disclaiming responsibility, it is declared that the responsibility for any decision-making, action, and potential profit and loss in the capital market and cryptocurrency market lies with the trader.