
Nabi_Gunduz
@t_Nabi_Gunduz

What symbols does the trader recommend buying?
Purchase History
پیام های تریدر
Filter
Nabi_Gunduz
OPUSDT - 07.01.2025

A very nice Wedge breakout... Daily candle closing above 0.3484 has the potential to give 40% profit...
Nabi_Gunduz
BTC - 06.01.2026

Hello, A monthly candle closing above 102000, the upper level of the FVG region seen in yellow on the chart, will be the first sign of an increase in the medium and long term. The second bullish sign will occur with the monthly candle closing, which may be above 124474. The trend lines seen with red dashed lines on the chart are the trend lines of the Wolfe wave structure, and if the trend line below these trend lines breaks downward on a monthly basis, the price may drop to 50 thousand dollars. To put it simply; A monthly candle closing above 102 thousand may indicate an increase, while a monthly candle closing below 74 thousand may indicate a decrease. I WISH YOU GOOD EARNINGS
Nabi_Gunduz
ONS ALTIN - 04.01.2025

Hello, Daily pivot for Monday: 4347.95 Weekly pivot for next week: 4384.78 Monthly pivot for January: 4342.08 I don't know how the opening will be, but after a very long time, we witnessed the Ounce Gold price closing below the monthly, weekly and daily pivot for the first time. This week, I can say that opening a buy trade without seeing a DAILY candle close above the weekly pivot level of 4384.78 would not be technically correct for swing transactions. After a daily candle close above 4384.78, we can consider buying for the rest of the week. On the other hand; Without seeing a WEEKLY candle close above 4342.08, it would not be technically correct to think BUY for the rest of the month. When we examine our chart; We see that the price moves almost at the mid-level of 2 important regions. Perhaps the price may consolidate between these 2 regions for a while. I would like you to pay attention to the movement I have enclosed in an ellipse on the sol side of the chart. The beginning of the movement over the region and the movement experienced in the last 5 days are very similar to each other. Therefore, one cannot help but wonder if the continuation of the movement occurs like the movement in an ellipse. If such a possibility occurs, we may initially witness the price falling from the 2 blue zones to the upper one, and if it does not stop here, to the lower blue zone. I don't know how the markets will react to the latest cyclical developments. In fact, it is not possible to predict to what point the developments will evolve. Therefore, the reaction of the markets on the opening and Monday should be closely monitored. I wish you all a beautiful first week of the year...
Nabi_Gunduz
ADAUSDT/Cardano - 03.01.2026 - EĞİTSEL AMAÇLI ANALİZ

Hello, One of the most important features of the formation formed with Wolfe waves in the weekly time period is that the price passing over the trend line drawn from wave points 1 to 3 returns below this trend line and the formation produces a SELL signal and its first target is the level 4 of wave points. If this level is broken, there is a possibility that the trend line drawn from 1 to 4 will be another target. The SELL signal, which occurred after the third week of December 2024 with the candle closing under this trend line after the rising upper trend line on the chart was broken upwards, made a point shot at level 4 from the wave points of the formation, 42 candles after the formation produced the signal. Now, two things should be noted here. In case of a candle closing below level 4, 0.2750, there is a possibility that the price will target the trend line seen in red. Or; Level 4 may act as support and there may be a possibility that the price may now make a comeback. Although the distance may seem short, it should be noted that if the price targets the red trend line, your money could decrease to approximately 1 in 6. Considering that 1/3 of the price has been reached when the formation reaches its first target after the sell signal is formed, the fact that the second target can bring a much greater decrease should never be overlooked... NOTE: The Wolfe formation seen in this chart is a great example that is a lesson and has worked very well.
Nabi_Gunduz
ETHUSDT/Ethereum - 03.01.2026

Hello, Composite man, who started to collect the first goods after the Liquidity operation in mid-August 2025, reached the first region where he could increase the price. If it can provide enough supply, there may be a return from this region. If the supply is not yet sufficient, the price may drop to the fvg zone below. The triangle formation that broke upward before the liquidity operation actually indicates that the price will eventually rise, but we are trying to predict when and at what level this rise may occur. I shared with you the sales formation that occurred after the liquidity operation back then. As seen in this chart, the sales formation in question has reached its target. Therefore, it is technically normal for us to think that the possible return could be from here. But we need to get confirmation of this in smaller time periods. When we examine it in a daily time period; In the graph, there are two different structures formed by WOLFE waves in two wave structures with depths of 12 and 20. The wave structure I numbered is a 12-depth wave structure. However, the breakout level of both formations is 3447.44. In the trend lines drawn from 1 to 4 and to be followed as resistance, you see the trend line of the formation formed according to the 12-depth wave structure in red and the trend line of the formation formed according to the 20-depth wave structure in orange. Therefore, we will get the first signs of a possible return movement with upward breaks of these trend lines. With daily candle closings above 3447.44, important breakouts will occur and the way for the rise will be paved. On the other hand, unless the price falls below the 2623.57 level, the wave structure seen as 3, 4, 5 in this daily chart is actually also a Pattern 123 formation and the signal generation level of this formation is 3447.44. If the price falls below 2623.57, the possibility of this formation will disappear. The STOPLOSS level of the bullish signal that will occur after the candle close, which may be above 3447.44, will be just below 2623.57. CONCLUSION: Whether the price will move to the lower FVG region on our main chart or whether the FVG region it is trying to exit from will be a return region can be understood by the conditions in the last chart in the daily time frame. I WISH YOU GOOD EARNINGS...
Nabi_Gunduz
ONS ALTIN - 30.12.2025

Hello, As the week opened, I could not foresee that there would be a $250 drop in one day. That's why I didn't share this drawing in my weekend analysis, but it was necessary to share with you the WOLFE formation, which should be taken into consideration at the moment. A downward break of the red trend line drawn from level 1 to level 3 will cause the formation to generate a SELL signal and the possible target will be at least 4169.96, seen with the yellow horizontal line. In fact, after such a breakout, the price may even fall to the green trend line, which is the support trend and second target area of the formation. The region seen in blue on the chart broke downwards and turned into the Inverse FVG region. So, for now, it is a little difficult to say that the rise will start again unless this region breaks upwards... In fact, the Order Block region formed with the Engulfing candle structure just above the region appears as the second obstacle to the rise. Like divers getting hit, many investors got hit with yesterday's massive decline. Maximum caution must be exercised to avoid a second profiteering. This post will probably be the last post of 2025. On this occasion, I once again hope that the New Year will bring good things to you and your loved ones, and I congratulate you on your New Year in advance... Such a signal occurred on the 30-minute chart, but it should be taken into consideration that there is a daily pivot at 4393.69 and H3, which is the daily Camarilla reversal level at 4399.44. Fibonacci EXPANSION levels (Medium-Long Term) The levels to be followed in 2026 with MONTHLY CANDLE closings... 30-minute The BUY signal formed in the time frame has reached the TP1 level.
Nabi_Gunduz
ONS ALTIN - 28.12.2025

Hello, There are only 3 trading days left until the year ends. We are leaving behind another year, good and bad. I hope the new year brings beauty to you and all your loved ones. I hope 2026 will be a profitable year for all of you... It is clearly seen in our main chart on the daily time frame that the price will continue to rise unless our short-term rising trend line is broken downwards. During this upward trend, of course, there will also be regressions. I believe that such possible pullbacks should be considered as buying opportunities. For now, the FVG region seen in pink on the chart should be followed as a support region. A candle closing below this area on a daily basis may cause problems for the upward process, but it is too early to talk about this for now. Because the price still continues to be in an upward trend. Almost all of the evaluations I made on previous weekends remain valid. Therefore, I do not want to become repetitive by saying the same things over and over again. Please check out my past analysis in case you need it. In the wave structure you see in orange on the chart, we see that we are in the third of the 5th impulse wave of the price. After this wave, a correction wave will come, but we do not yet know exactly where the third wave will end. We're just trying to guess where it might be. In this context; You see the Bearih Butterfly Harmonic formation in the chart. The "D" point of this formation may be the Fibonacci Retracement 2.618 level, which is drawn to the maximum "CD" leg. If the price rises above this level, it will invalidate the formation possibility. So, when we evaluate this chart together with the previous chart, it would be quite natural to think that the third impulse wave may end around 4600-4650. But this is only a possibility and it is not certain that the harmonic formation will work. Therefore, if you have a long directional transaction, it may be more logical to make partial profit realizations instead of exiting this transaction or transactions completely. Because, unfortunately, in such bullish periods, if the expected decline does not occur after exiting the trade, it is not easy to enter the bullish trade again. Signals do not occur constantly. Since it is not right to enter into a transaction before the signal is formed, then it is necessary to know the value of the current transactions. When we look at the last 1 month in a 4-hour time period, as you can see in the chart, the ball basis trading signal has occurred 5 times. Well, since there is no new signal at the moment and the last signal is bullish, it is necessary to either move the transactions or make partial profit realizations... As I see new things, I will continue to share them in the comments sections under this analysis until my next analysis, and I hope you all have a nice SUNDAY...
Nabi_Gunduz
تحلیل طلای اونس: رسیدن به اهداف مهم قیمتی و سطوح کلیدی خرید!

In the chart, we see that the price has reached the half-target of the Triangle formation and the gray-filled Darvas box target level of 4492. A daily close above this level makes the target 4603, another green-filled darvas box target, but the price can also go directly to the target without generating such a signal. Unless the weekly close is below 4381, possible pullbacks may be a buying opportunity. The main target of the triangle is 4740, the half target of the blue filled box is 4629, and the main target is 4877. NOTE: I recommend you evaluate it together with my analysis dated 20.12.2025. GOOD EARNINGS...
Nabi_Gunduz
ONS ALTIN - 20.12.2025 (Hafta Sonu Analizi)

Merhaba sevgili arkadaşlar, Bu hafta sonu sizler için, farklı zaman dilimlerinde, içinde çok sayıda çizimin olduğu, oldukça detaylı değerlendirmelerde bulunacağım. 19 Aralık Cuma günü itibariyle ABD Vadeli Opsiyonların vade sonu gerçekleşti. Son yılların en büyük vadeli opsiyonlar kontrat sözleşmesi olması nedeniyle bu vade sonu oldukça önemliydi. Son haftada volatilitesi düşük, dar band hareketlerinin yaşanması da bu nedenleydi. Bu tür önemli sözleşmeler öncesinde trend kırılımları beklenmez. Eğer bir trend kırılımı gerçekleşecekse, genellikle vade kapanışlarından sonra gerçekleşir. Önümüzdeki haftanın ortasından sonra, birçok büyük yatırımcının Noel tatiline çıkacağı da düşünüldüğünde, haftanın ilk 3 günününde volatilitesi yüksek hareketler yaşanabileceğine dikkat edilmelidir. Şimdi önce ana grafiğimizi inceleyelim. Kapanan son haftalık mum ile, çok dar aralıklı bir FVG bölgesi oluştu ve fiyatın önünde de son zirve seviyesi 4381.45 var. İlk dikkat etmemiz gereken şey ise; 4381.45 üzerinde haftalık mum kapanışı olup olamayacağıdır. Zira, zirvenin yukarı yönlü geçilip, haftayı 4381.45'in altında kapatması durumunda, bunun bir likidite alma operasyonu olma ihtimali ortaya çıkacaktır. Böyle bir durumda, sonrasındaki haftalarda yeni bir zirve daha yapmadan 4264.58 altında yaşanabilecek haftalık bir mum kapanışı, bütün resmi değiştirecektir. Bakın burası çok önemli. Olası 4381.45 üzerinde günlük mum kapanışı sonrası sakın iş bitti sanmayın. Tabii ki bu kırılım önemli olacaktır ama yükselişin devamı için mutlaka haftalık mum kapanışının da 4381.45'in üzerinde olması gerekmektedir. Şimdi geçelim ikinci grafiğimize... Daha önce birkaç kez size anlattığım kapanan mumlara çekilen fibonacci retracement ile bir alt zaman diliminde kırılım takip etme tekniğine göre, Kapanan aylık Kasım ayı mumuna uygulanan bu yöntem sonucunda haftalık zaman diliminde takip etmemiz gereken seviye kırılımlarından fibo 1.236 seviyesi yukarı yönlü kırılmış ve fiyat bir sonraki seviyeye ulaşamadan hafta kapanmıştır. Öyleyse, fiyatın en az fibo 1.5 seviyesi olan 4403'e gidebilme ihtimali doğmuştur. Hatta bu yükseliş ihtimali fibo 1.5 seviyesi ile sınırlı kalmayıp, daha yukarıdaki diğer seviyeleri de hedefleyebilir. İşte tam da bu noktada, bir önceki değindiğim likidite alma operasyonu ihtimalini, bu grafikteki mantık ile birlikte değerlendirelim. Diyelim ki, bu grafikteki yükseliş sinyali devreye girdi ve fiyat fibo 1.618 seviyesi olan 4440'a kadar yükseldi ama ardından tekrar düşerek, haftayı 4381.45'in altında kapattı. İşte buyurun size bir likidite alma operasyonu ihtimali... Diğer yandan, kırılım sonrası fiyatın 4381.45 üzerinde kalıcı olabileceğini ve ay sonuna kadar geçerli olacak mavi fibonacci seviyelerinin daha yukarıda olanlarını da hedefleyebileceği ihtimalini unutmamak gereklidir. Buraya kadar olan kısım iyice anlaşıldıysa, artık daha küçük zaman dilimlerine geçebiliriz Günlük zaman diliminde olan bu grafikte DARVAS Kutu Teorisi'ne göre çizilmiş bir çalışmayı görmektesiniz. Bu teorideki amaç, kırılım seviyelerini ve stoploss seviyelerini tespit etmektir. Son kutucuğun kırılan seviyesinin tersindeki seviye, en yakın stoploss seviyesidir. Buna göre grafikte mor renkli kutucuğun üst bandı yukarı yönlü kırıldıktan sonra bu kutucuğun alt seviyesi olan 4169.95'in hemen altı en kısa stoploss seviyesidir. Grafikte yeşil ile görülen kutucuk ile mor renkli kutucuk aynı mum ile kırılmıştır. İşte bu mum sonrası ALIŞ sinyali oluşmuştur. Hedefler ise, önce kutucuğun yarı derinliği, ardından da derinliğin tamamı kadardır. Dolayısıyla son kutucuk olan mor kutucuk derinliğinin tamamı olan yüksekliğe ulaşmıştır. Yeşil kutucuğun hedefleri aynı zamanda bir 123 pattern oluşumu hedefleri olacağı için, onu aşağıdaki grafikte belirteceğim. Günlük zaman diliminde olan bu grafikte mavi ile görülen oluşum Pattern 123 oluşumudur ve görüldüğü üzere bir önceki grafikteki yeşil kutucuk ile aynı sinyal seviyesine sahiptir. Kırılım 11 Aralık Perşembe günü kapanan günlük mum ile oluşmuş ve fiyat TP1 seviyesine ulaşmıştır. Bu formasyona göre, 4368 seviyesinin günlük bazda yukarı yönlü kırılımıyla, formasyonun diğer TP seviyeleri hedeflenebilir. Bir başka günlük zaman dilimindeki bu grafikte, küçük derinlikli dalga yapısına göre AB=CD formasyonu aradığımız bir fibonacci Expansion çalışması görmektesiniz. Fiyat AB=CD eşitliğine ulaşmıştır. Bu seviyeden bir dönüş olabileceği gibi, formasyonun uzatmalı seviyelerinin de hedeflenebilme ihtimali mevcuttur. Daha önce paylaştığım günlük zaman dilimindeki bu grafikte gri renk ile görülen alçalan ve yükselen kanal çalışması ve pembe renk ile görülen ARZ Bölgesi ile son günlerde bahsetmeyen kişinin kalmadığı meşhur simetrik üçgen formasyonunu görmektesiniz. En dikkat çekici kısım ise; fiyatın Arz bölgesi orta seviyesini yukarı yönlü geçtikten sonraki diğer 2 günde bu orta seviyeyi aşağı yönlü geçememesidir. Diğer yandan; son 4 gündür fiyatın alçalan kanalın -0.50 seviyesi üzerine olduğu da bir diğer dikkat edilmesi gereken husustur. Bu grafikte ise, fiyatın üçgenler oluşturarak yükseldiğini görmekteyiz. Grafikteki pembe dalga yapısıyla görülen üçgen 4 saatlik zaman diliminde oluşan bir üçgen formasyonudur ve 4350.70 üzerinde olabilecek 4 saatlik mum kapanışıyla aktif hale gelecektir. 4 saatlik zaman diliminde oluşan Flama formasyonunun üçgen kısmının hedefine ulaştığı bu grafikte, Flama'nın direk kısmı da devreye girecek olursa, hedefin 4501 olabileceği ihtimalini görmektesiniz. Yine 4 saatlik zaman diliminde olan bu grafikte kırılım takip edilebilecek önemli bölgeleri görebilirsiniz. Ve son olarak; 3 aylık, 6 aylık ve yıllık dalga yapılarına göre çizilmiş Fibonacci Expansion seviyelerini bu grafikte görebilirsiniz... Hepinize yeni haftada güzel kazançlar dilerim. İYİ TATİLLER...P.tesi gününe ait GÜNLÜK PİVOT: 4334.76 Önümüzdeki haftaya ait HAFTALIK PİVOT: 4328.45 Aralık ayına ait AYLIK PİVOT: 4130.86Bugün itibariyle TP-3 seviyesine ulaşılmıştır.
Nabi_Gunduz
ONS ALTIN - 18.12.2025
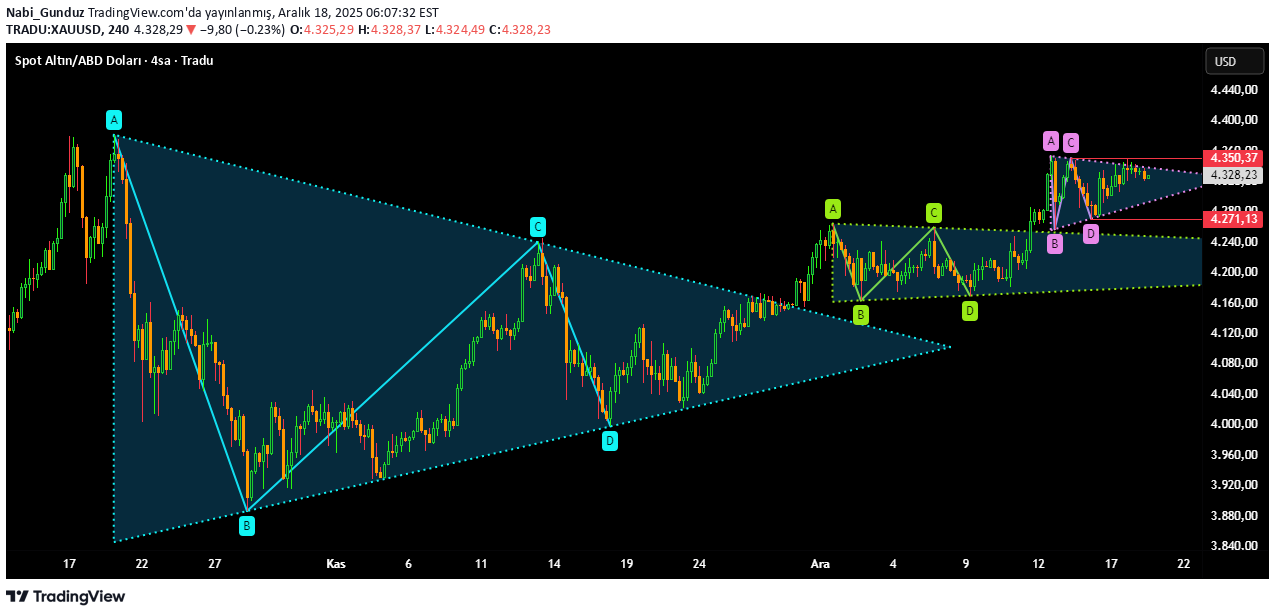
Hello, I observe that the price moves itself upwards by forming triangles. While doing this movement, I noticed that after the breakouts occurred, it could not cross the upper descending trend line of the triangle in a downward direction again. When we look at the last triangle formation above, in order for this chain to continue, the price must first not fall below the triangle "D" level of 4273.11. For the continuation of the rise, a 4-hour candle must close above 4350.37... The upper descending trend line of the last triangle may be breached upwards. In fact, a 4-hour candle closing may occur above this trend line. These are not important. What really matters is the 4-hour candle close above 4350.37, which is the "C" level of the triangle. Then; Either possible withdrawals can be considered as buying opportunities, provided that a stop is placed below 4273.11, or a buying transaction can be entered after the 4-hour candle close above 4350.37. It should be noted that if the price falls below 4273.11, this chain will be broken. I WISH YOU GOOD EARNINGS...
Disclaimer
Any content and materials included in Sahmeto's website and official communication channels are a compilation of personal opinions and analyses and are not binding. They do not constitute any recommendation for buying, selling, entering or exiting the stock market and cryptocurrency market. Also, all news and analyses included in the website and channels are merely republished information from official and unofficial domestic and foreign sources, and it is obvious that users of the said content are responsible for following up and ensuring the authenticity and accuracy of the materials. Therefore, while disclaiming responsibility, it is declared that the responsibility for any decision-making, action, and potential profit and loss in the capital market and cryptocurrency market lies with the trader.