
P_S_trade
@t_P_S_trade

What symbols does the trader recommend buying?
Purchase History
پیام های تریدر
Filter
P_S_trade
تحلیل قیمت VIRTUAL: آیا پروتکل ورچوال آماده جهش به ۱.۶۰ دلار است؟

The market is slowly coming back to life 👀 No euphoria yet, but the first sparks are already visible. So far, memecoins are leading the move, but a few non-meme projects are starting to show strength as well. One of them is Virtuals Protocol. 📊 On the VIRTUALUSDT.P chart, price is trying to hold the upper part of the channel, which is a constructive sign in current market conditions. If buyers manage to secure acceptance above $0.90, the structure opens the door for a move toward $1.50–1.60. ❓ Is this the beginning of a larger move, or just another short-lived bounce? 🧠 DYOR | This is not financial advice, just thinking out loud. ______________ ◆ Follow us ❤️ for daily crypto insights & updates! 🚀 Don’t miss out on important market moves 🧠 DYOR | This is not financial advice, just thinking out loud
P_S_trade
PEPE price analysis

🐸 “Altseason is here!” — at least that’s what the PEPE market maker decided, printing +46% on a single 3D candle. 📊 With a market cap around $2.4B and daily trading volume close to $1.2B, liquidity is clearly not an issue anymore. 📈 From a technical perspective, PEPEUSDT still has room for a step-by-step (“saw-like”) continuation higher. The key zone to watch is $0.0000090, where: a descending trendline and a strong historical mirror level intersect. ⚠️ This area could easily become a decision point 🤔 What do you think — is this just a hype-driven spike, or the beginning of a new impulsive leg for PEPE ? ______________ ◆ Follow us ❤️ for daily crypto insights & updates! 🚀 Don’t miss out on important market moves 🧠 DYOR | This is not financial advice, just thinking out loud
P_S_trade
Chiliz CHZ price analysis

🎆 Is someone launching a New Year firework on the CHZUSDT chart? Over the past 3 months, CHZ has shown much stronger price stability than most altcoins. While the broader market struggles, #Chiliz keeps holding its ground — and that already says a lot. 📍 Right now, price is pressing against a key decision zone around $0.45. This level may define the next major move. 📈 A clean breakout above $0.45 could open the way toward the trend resistance at $0.60–0.62. 🎄 So if markets get quiet during the New Year holidays — CHZ might be worth watching closely. 🤔 Is this just a short-term hype move, or are buyers quietly preparing a bigger push? ______________ ◆ Follow us ❤️ for daily crypto insights & updates! 🚀 Don’t miss out on important market moves 🧠 DYOR | This is not financial advice, just thinking out loud
P_S_trade
PENDLE Technical Outlook (Long-Term)

The global PENDLEUSDT chart continues to respect a well-defined channel. 📌 Current price action is located near the lower boundary of the channel, a region that historically preceded medium- to long-term upward impulses. 🔹 Conservative technical target: • Upper channel zone near $6.50 • Potential upside: +240–250% • Implied market cap: $900M–$1B (from ~$300M currently) 🔹 Extended bullish scenarios: If momentum accelerates and broader market conditions improve, higher targets such as $14 or even $214 could come into play — though these would require a different macro environment. ❓ Do you consider PENDLE fairly valued at current levels, or still structurally undervalued? ______________ ◆ Follow us ❤️ for daily crypto insights & updates! 🚀 Don’t miss out on important market moves 🧠 DYOR | This is not financial advice, just thinking out loud
P_S_trade
Bitcoin BTC price analysis

#Bitcoin remains in a compression phase between key structural levels. A failed attempt to break the descending trendline resulted in a bearish 12H pin bar, increasing the probability of a short-term move toward $84,500. Key BTCUSDT levels: • Resistance: $91,000 → $94,000–95,000 • Support: $84,000–84,500 • Major downside target if support fails: $75,000–77,000 On the monthly timeframe, a sweep into the $75–77K zone in early January aligns with historical market behavior observed in early 2025-type structures. Bullish continuation requires a clean break and acceptance above $91K, followed by short liquidation fuel above $94K. Question for traders: Will BTC resolve this range to the downside first, or can buyers reclaim control before year-end? ______________ ◆ Follow us ❤️ for daily crypto insights & updates! 🚀 Don’t miss out on important market moves 🧠 DYOR | This is not financial advice, just thinking out loudBTC price is attempting to break above a multi-month descending trendline. At the moment, the order book does not show significant sell-side resistance above current levels. This increases the probability of an acceleration phase if short positions begin to unwind. Key technical conditions: A confirmed 12H close above the trendline Sustained price action above $87,500 If these conditions hold, the market may transition from consolidation into a directional move within the next few sessions. Failure to hold above the trendline would likely extend the range-bound structure. 📌 What scenario do you consider more likely from here — continuation or rejection?
P_S_trade
NEAR protocol price analysis

#NEARprotocol: early signs of stabilization after a prolonged correction On the NEARUSDT chart, price action shows several notable technical elements worth monitoring. trading volumes remain relatively stable, despite broader market weakness. price is currently respecting a descending trendline from the outside, suggesting controlled downside rather than a structural breakdown Additionally, the long corrective A–B–C pattern appears to be approaching its terminal phase. From a fundamental perspective, Near Protocol’s market capitalization is around $2 billion. While token emission and supply dynamics could be more deflationary, the current valuation is not excessive for a layer-1 ecosystem of this size. If the market environment improves, a medium-term recovery scenario becomes plausible: $4–6 as a conservative target range, $8 as an optimistic scenario under strong market sentiment. Further upside would likely require a broader market expansion and renewed ecosystem demand. Question: Do you believe NEAR still has room for growth in this cycle, or has its primary expansion phase already passed? ______________ ◆ Follow us ❤️ for daily crypto insights & updates! 🚀 Don’t miss out on important market moves 🧠 DYOR | This is not financial advice, just thinking out loud
P_S_trade
VELO price analysis — Potential End of Correction?

VELO has been trading inside a broad multi-year range, and current price action suggests that the correction phase may be approaching exhaustion. Key observations: Price is near the middle boundary of a 4-year range Volatility compression often precedes impulsive moves Current market capitalization remains low at $100–120M Potential upside scenario: Conservative recovery target: $0.045–0.067 This represents a 600–1000% increase from current levels As always, confirmation will be required from structure and volume expansion. Until then, #VELO remains a high-risk, high-reward speculative setup. 👉 Do you see VELO as accumulation-worthy at these levels, or does the market need more time? ______________ ◆ Follow us ❤️ for daily crypto insights & updates! 🚀 Don’t miss out on important market moves 🧠 DYOR | This is not financial advice, just thinking out loud
P_S_trade
Bitcoin BTC price analysis

BTC is struggling to move higher. Walls of limit orders are everywhere — sellers vs buyers — and BTCUSDT is basically stuck. That’s exactly how consolidation & distribution phases look like. 🖐️ Trading manually right now? Honestly — not the best idea. At this stage, mistakes often outnumber profits. 🤖 Meanwhile, trading bots keep doing their job: • predefined ranges • zero emotions • steady volatility harvesting 👀 Retail traders (us) should wait. When the “big money” finishes its battle and fires an impulse candle — that’s when we join the stronger side. 📊 Fear & Greed Index is slowly recovering: from 10–11 last week → ~25 today. 🔑 Key BTC levels: ▪️ Resistance: $103K ▪️ Support: $84K ⚠️ Below $77K — the road toward $50K opens wide. 🎄 With holidays ahead, activity will likely drop even more. For now — we observe, not trade. 🤔 What do you expect next for #Bitcoin: breakout or another leg down? ______________ ◆ Follow us ❤️ for daily crypto insights & updates! 🚀 Don’t miss out on important market moves 🧠 DYOR | This is not financial advice, just thinking out loud
P_S_trade
Monero XMR price analysis

Is XMR preparing to break its ATH? Looking at the #XMRUSDT chart, it feels like #Monero is approaching a critical moment. After years of consolidation, a confirmed hold above $520 could mark the start of a real harvest season 🌾 🔓 This level may become the key trigger that shifts XMR into a new market phase. 🎯 So what’s the real target for #Monero? ▪️ $1250? ▪️ Or even much higher — $4300? 💰 Current market cap is around $7.9B. Do you believe XMR is capable of growing to: ➡️ $23B ➡️ or even $80B? 🤔 Share your thoughts — is #Monero ready to surprise the market again? ______________ ◆ Follow us ❤️ for daily crypto insights & updates! 🚀 Don’t miss out on important market moves 🧠 DYOR | This is not financial advice, just thinking out loud
P_S_trade
Bitcoin BTC price analysis
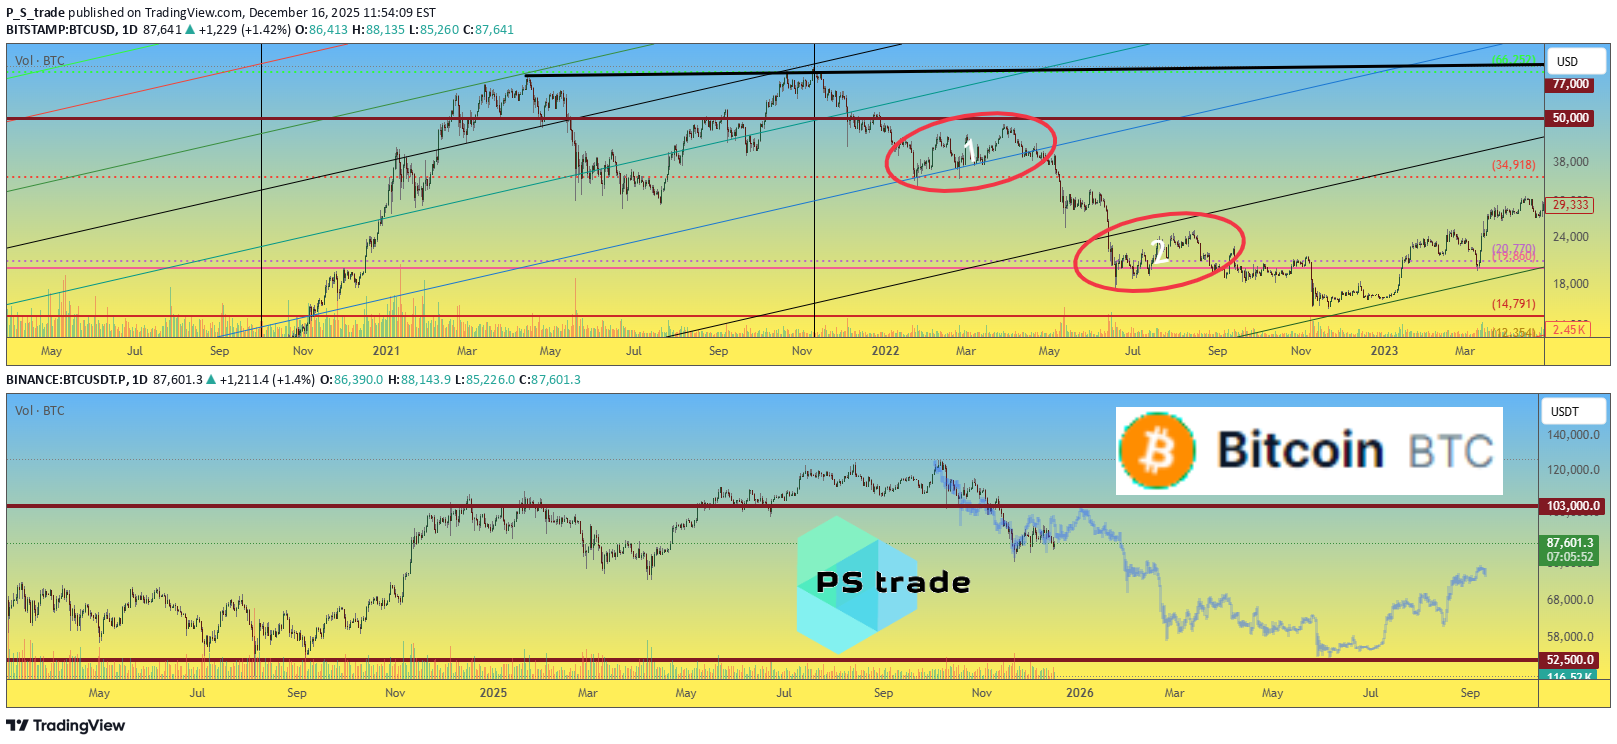
📊 US macro data has been updated — and BTC reacted with a bounce to the upside. Altcoins, meanwhile, still look confused, as if they don’t know where to run yet 🤷♂️ 😨 Fear & Greed Index: 11. That’s extreme fear — and historically, such levels often mark zones where a gradual recovery can begin. Possibly even starting tomorrow. 📈 Overall, the BTCUSDT price action in 2025 looks very similar to #Bitcoin ’s behavior in 2021–2022. We really want to believe we’re already in “Phase 2” of this fractal. Because if this is still “Phase 1”, history suggests a scenario like: ➡️ first $103,000 BTC, ➡️ then potentially a deeper move toward $53,000. 🤔 What do you think — are we already transitioning into recovery, or is another painful leg still ahead? ______________ ◆ Follow us ❤️ for daily crypto insights & updates! 🚀 Don’t miss out on important market moves 🧠 DYOR | This is not financial advice, just thinking out loud
Disclaimer
Any content and materials included in Sahmeto's website and official communication channels are a compilation of personal opinions and analyses and are not binding. They do not constitute any recommendation for buying, selling, entering or exiting the stock market and cryptocurrency market. Also, all news and analyses included in the website and channels are merely republished information from official and unofficial domestic and foreign sources, and it is obvious that users of the said content are responsible for following up and ensuring the authenticity and accuracy of the materials. Therefore, while disclaiming responsibility, it is declared that the responsibility for any decision-making, action, and potential profit and loss in the capital market and cryptocurrency market lies with the trader.