
Saitamasignal
@t_Saitamasignal

What symbols does the trader recommend buying?
Purchase History
پیام های تریدر
Filter
Saitamasignal
AVAX breakdown
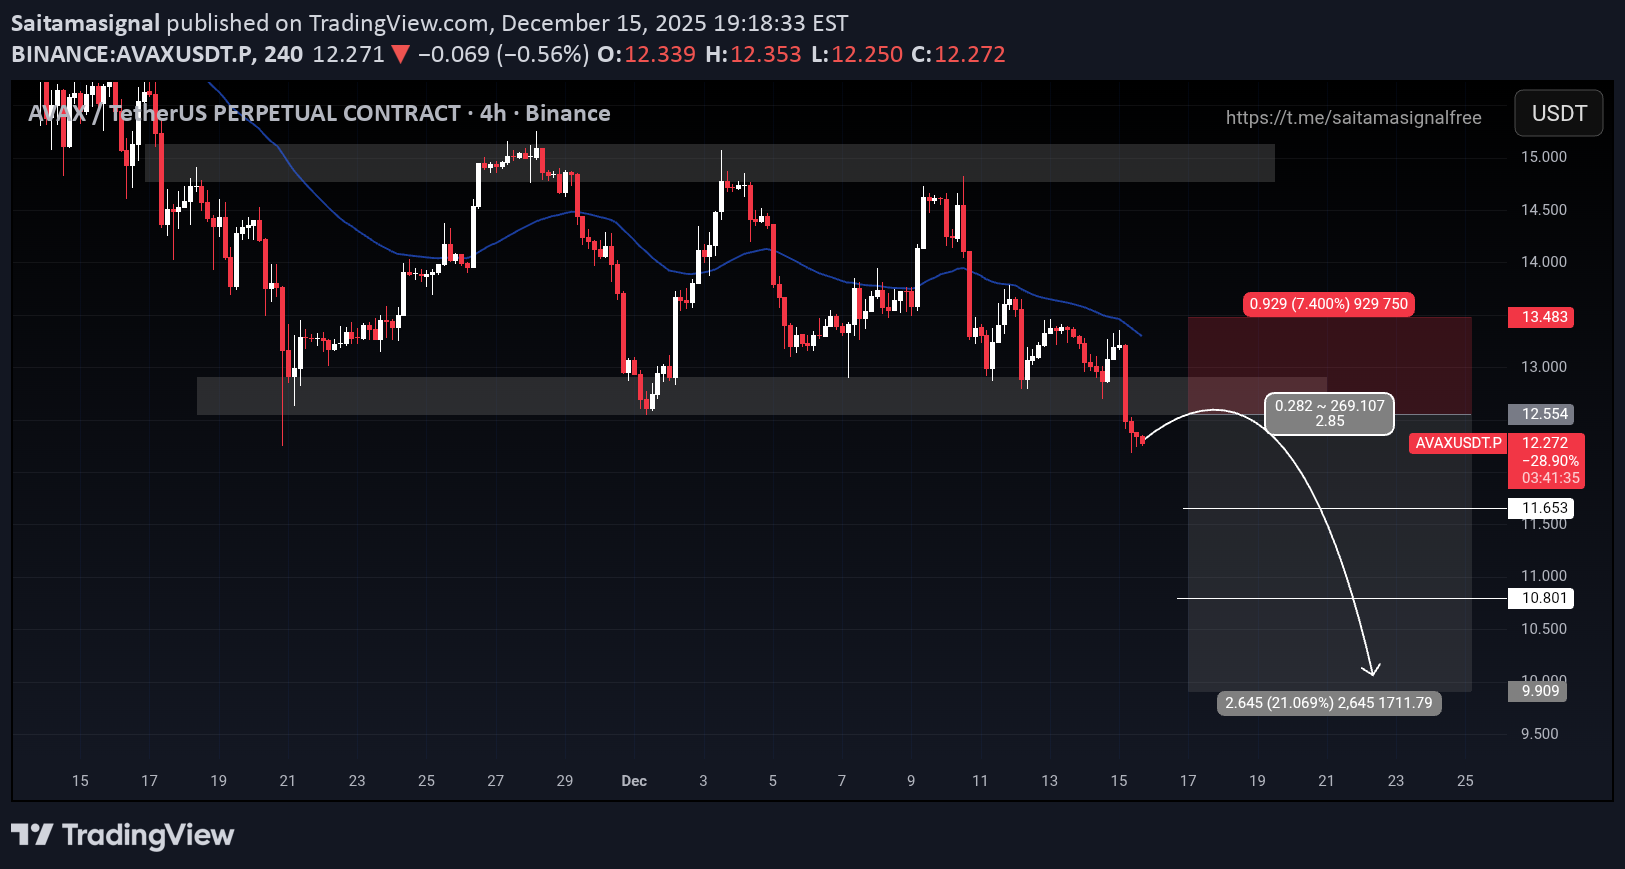
COIN NAME : AVAXUSDT ( isolated ) Sell short zone : 1) 12.554 Take profit : 1) 11.653 2) 10.801 3) 9.909 Stop loss : 13.483 Max leverage: 5x Amount : 2.0% Disclaimer: This is not financial advice. Always do your own research and use strict risk management. The crypto market is highly volatile.
Saitamasignal
SPX potential breakout
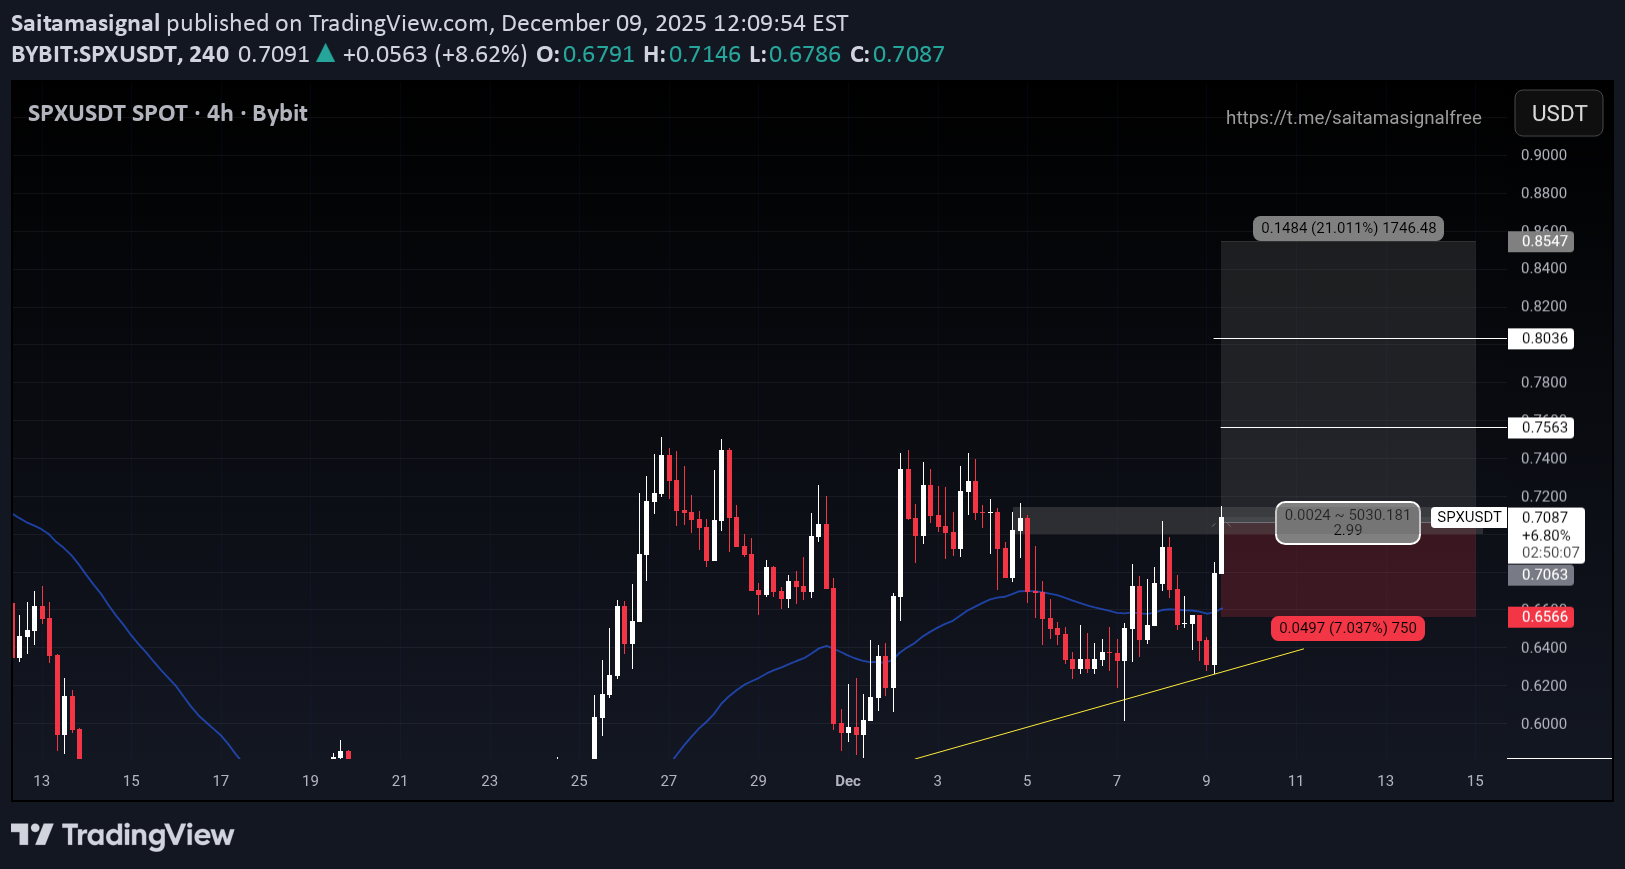
COIN NAME : SPXUSDT ( isolated ) Buy long zone : 1) 0.7063 Take profit : 1) 0.7563 2) 0.8036 3) 0.8547 Stop loss : 0.6566 Max leverage: 7x Amount : 2.0% Disclaimer: This is not financial advice. Always do your own research and use strict risk management. The crypto market is highly volatile.
Saitamasignal
سیگنال خرید فوری WAVES/USDT: اهداف صعودی و حد ضرر (با لوریج 6X)
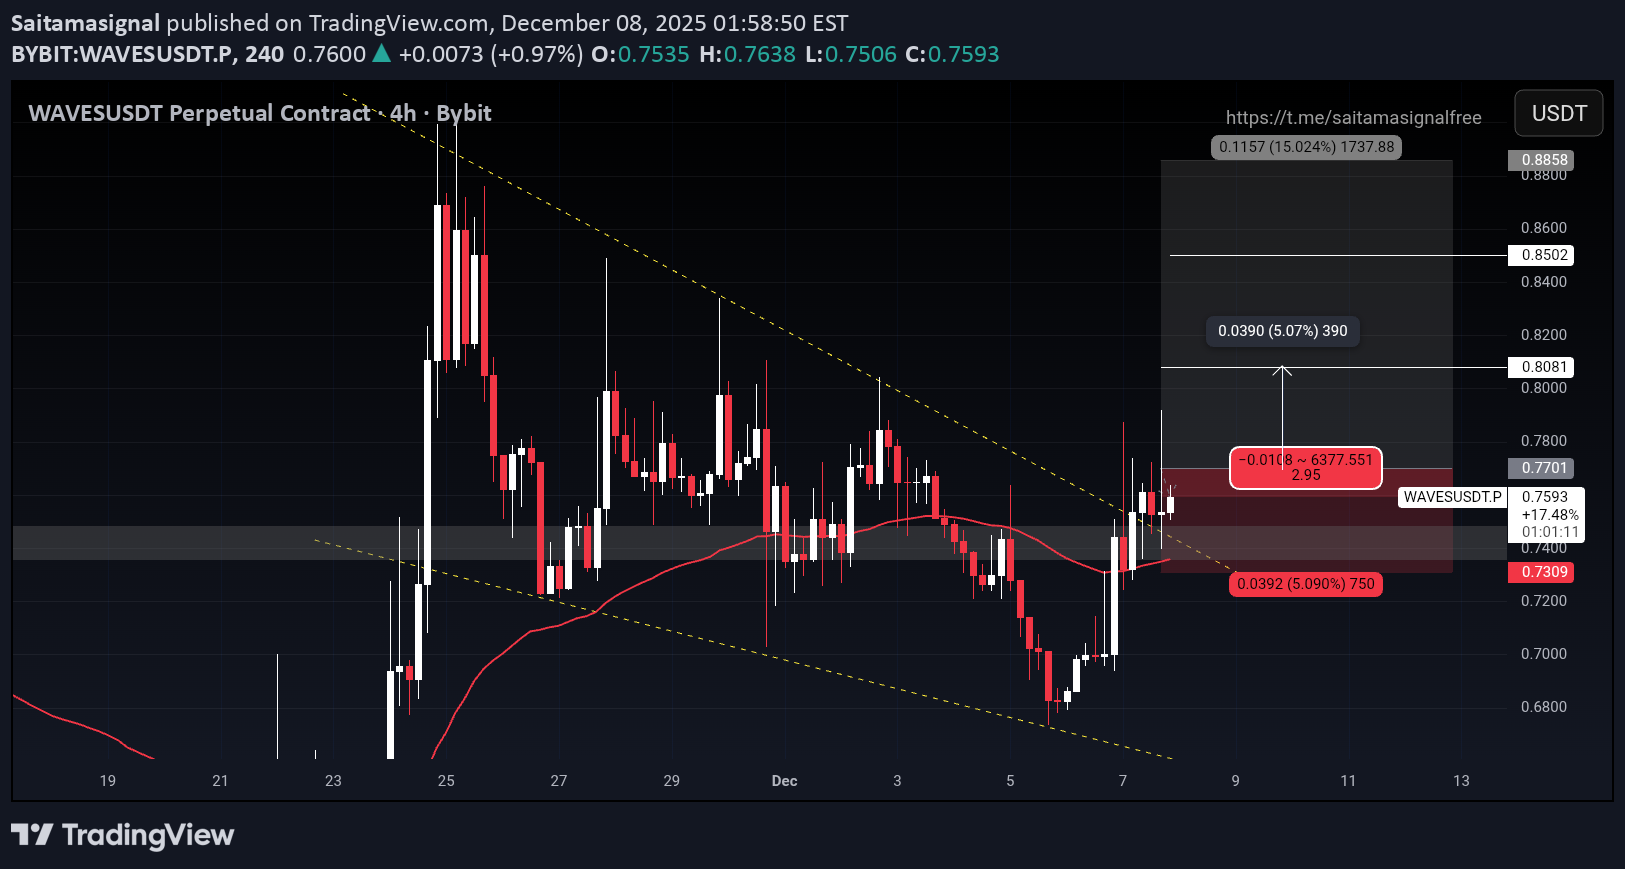
COIN NAME : WAVESUSDT ( isolated ) Buy long zone : 1) 0.771 Take profit : 1) 0.8081 2) 0.8502 3) 0.8858 Stop loss : 0.7309 Max leverage: 6x Amount : 2.0% Disclaimer: This is not financial advice. Always do your own research and use strict risk management. The crypto market is highly volatile.
Saitamasignal
نوسان شدید ACEUSDT: مثلث صعودی و احتمال فتح قله جدید!
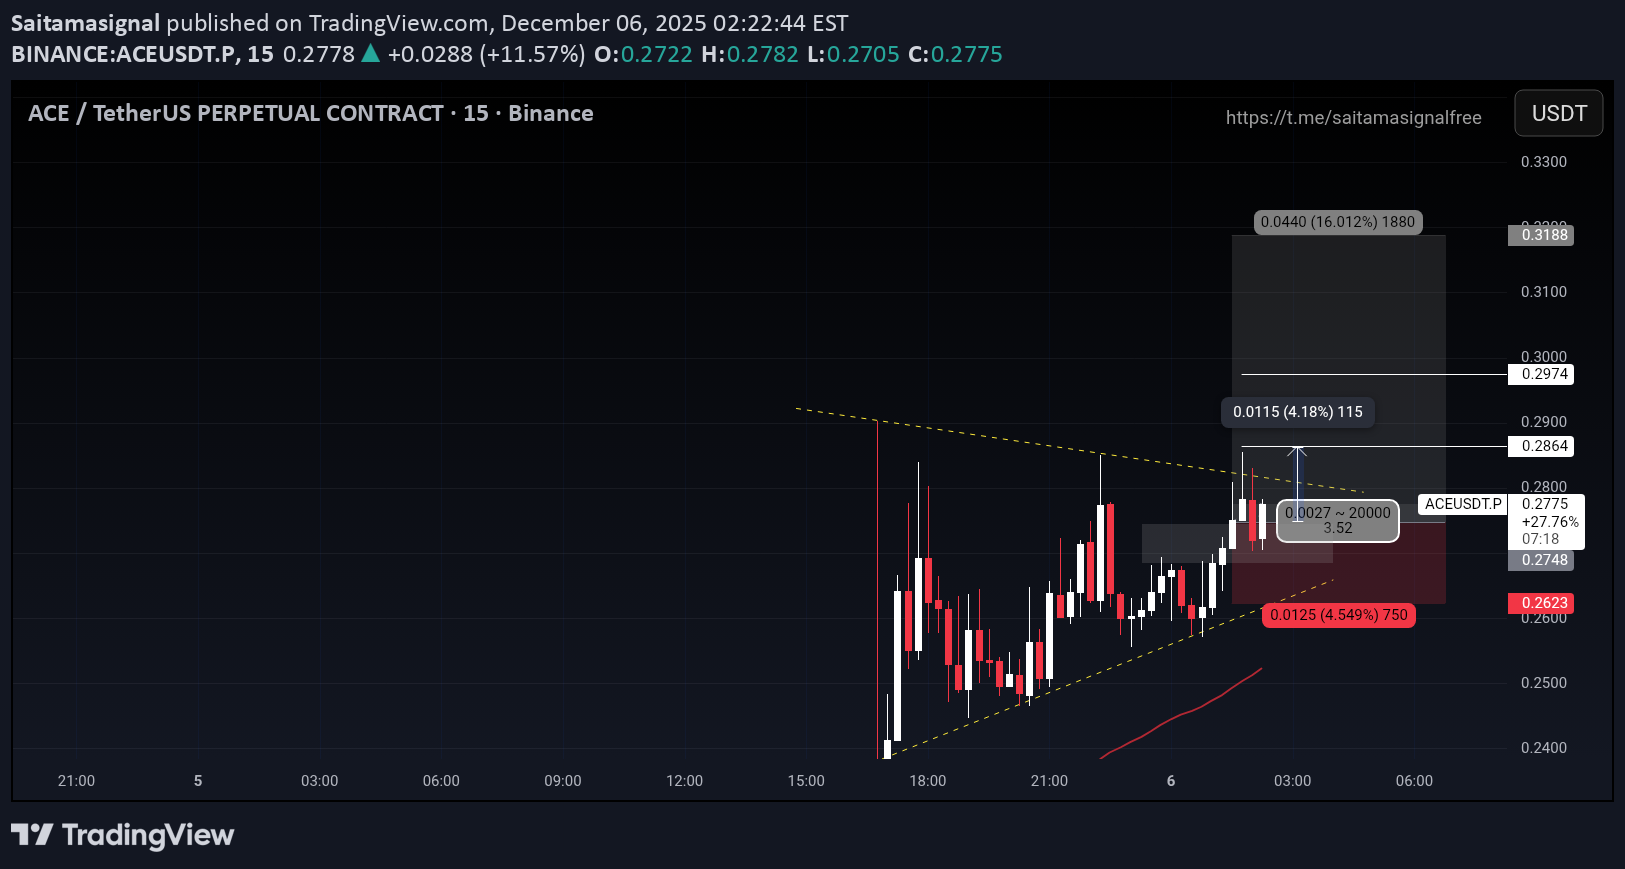
Whoops, ACEUSDT is experiencing severe swings! Chart Pattern: I see an Ascending Triangle pattern on a small time frame. This usually signals a continuation, meaning the price will continue to rise. Support & Resistance: The price is bouncing off the trendline support area. The nearest resistance area is around $0.3300. If this resistance breaks out, LFG (Let's F***ing Go) will make a new all-time high (ATH)!
Saitamasignal
طوفان اصلاح قیمت Zcash: فرصت طلایی یا تله خرسی؟
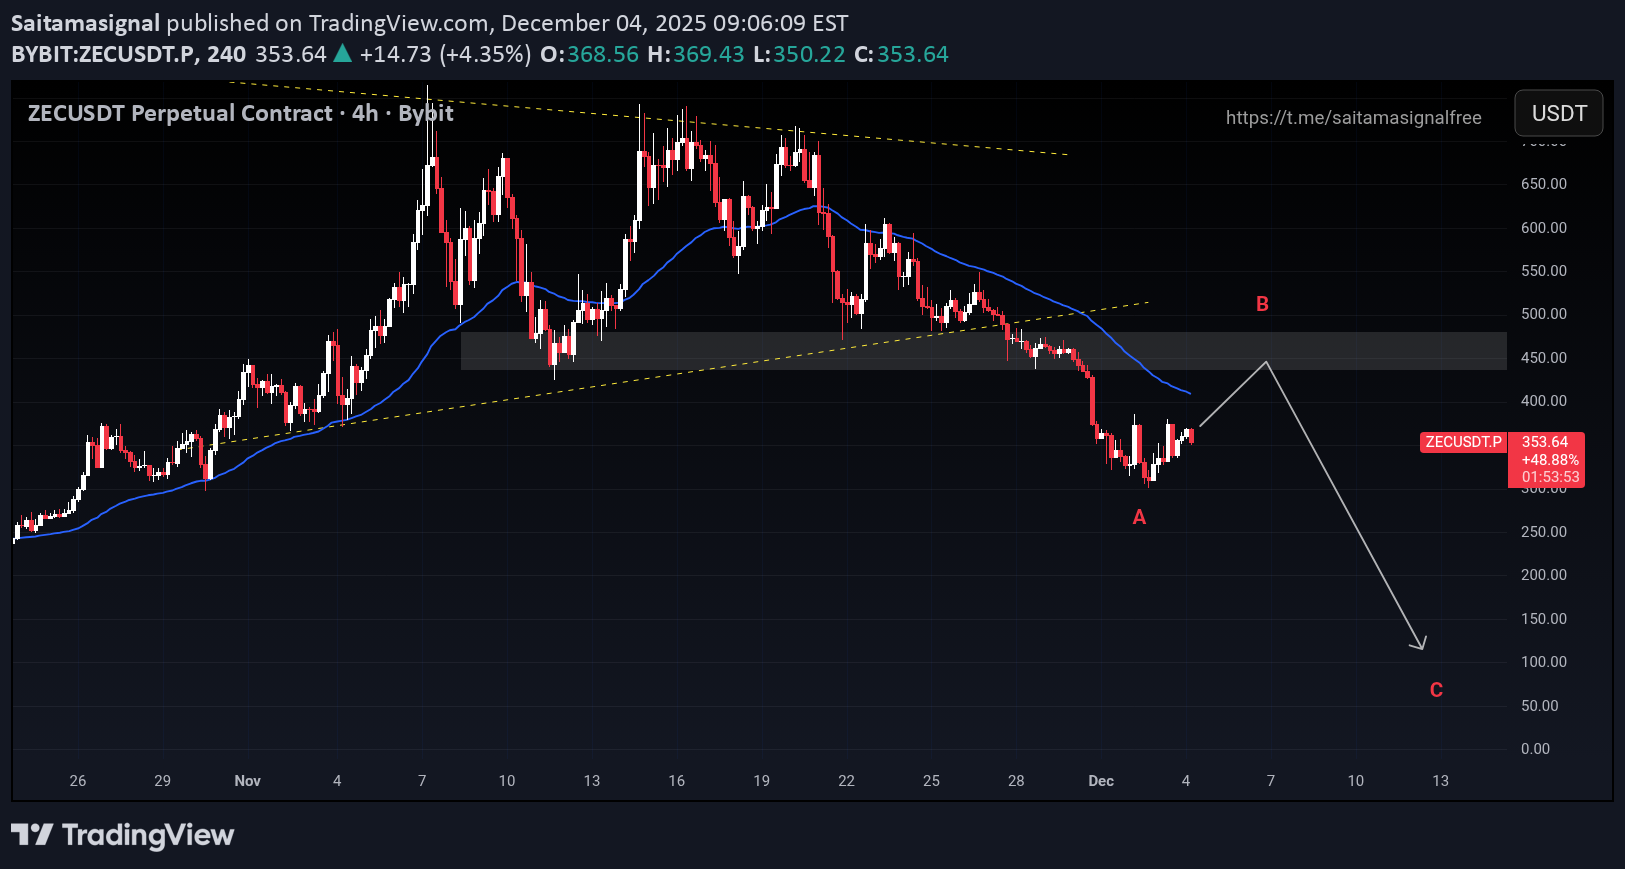
Zcash Correction Storm: Golden Opportunity or Bear Trap? This 4-hour chart of ZEC/USDT on Bybit shows a sharp decline after peaking in early November 2025. The price has plummeted more than 30% in the past week. This is a crucial moment: will we see a strong rebound from the current demand area, or will we plunge towards lower support levels? Technical analysis suggests short-term bearish sentiment is strengthening. Watch out for support around $300-$340! Disclaimer: This is not financial advice. Always do your own research and use strict risk management. The crypto market is highly volatile.
Saitamasignal
دوج کوین به کجا میرود؟ پیشبینی شوکهکننده قیمت دوج و آینده احساسی آن!
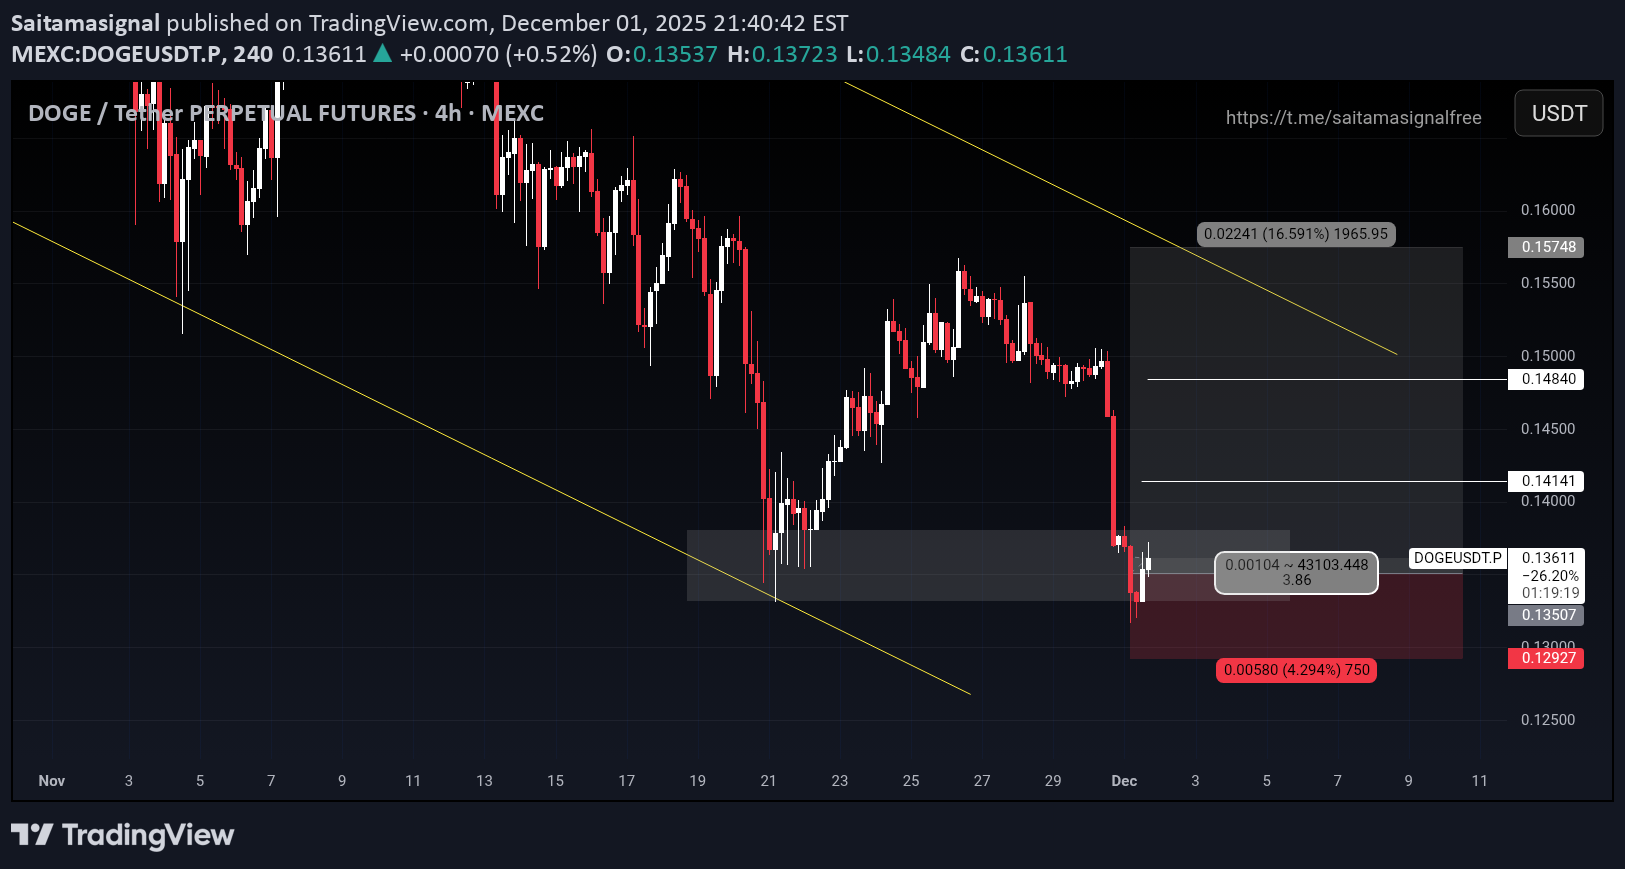
WHERE IS DOGE GOING?! THIS IS MAKING YOU EMOTIONAL! DOGE price on MEXC is volatile, folks! Crypto Drama: Since late November, DOGE has been falling like a roller coaster with broken brakes. This is really bad! DOGE is currently hovering around $0.135, seemingly in a precarious position. This is a very fragile support level. There's a "falling wedge" pattern indicating the price could "PUMP" to $0.16. However, the price could also "FALL" even lower if it breaks through the lower boundary. Oops! Essentially, DOGE is playing a guessing game. Prepare to be mentally battered! #ToTheMoonOrToTheGround Warning: This is not financial advice. Always do your own research and practice strict risk management. The crypto market is highly volatile.
Saitamasignal
جنون بازار ارز دیجیتال: بیت کوین پس از صعود نجومی، در یک چشم به هم زدن سقوط کرد! (آیا فرصت خریدی جدید در راه است؟)
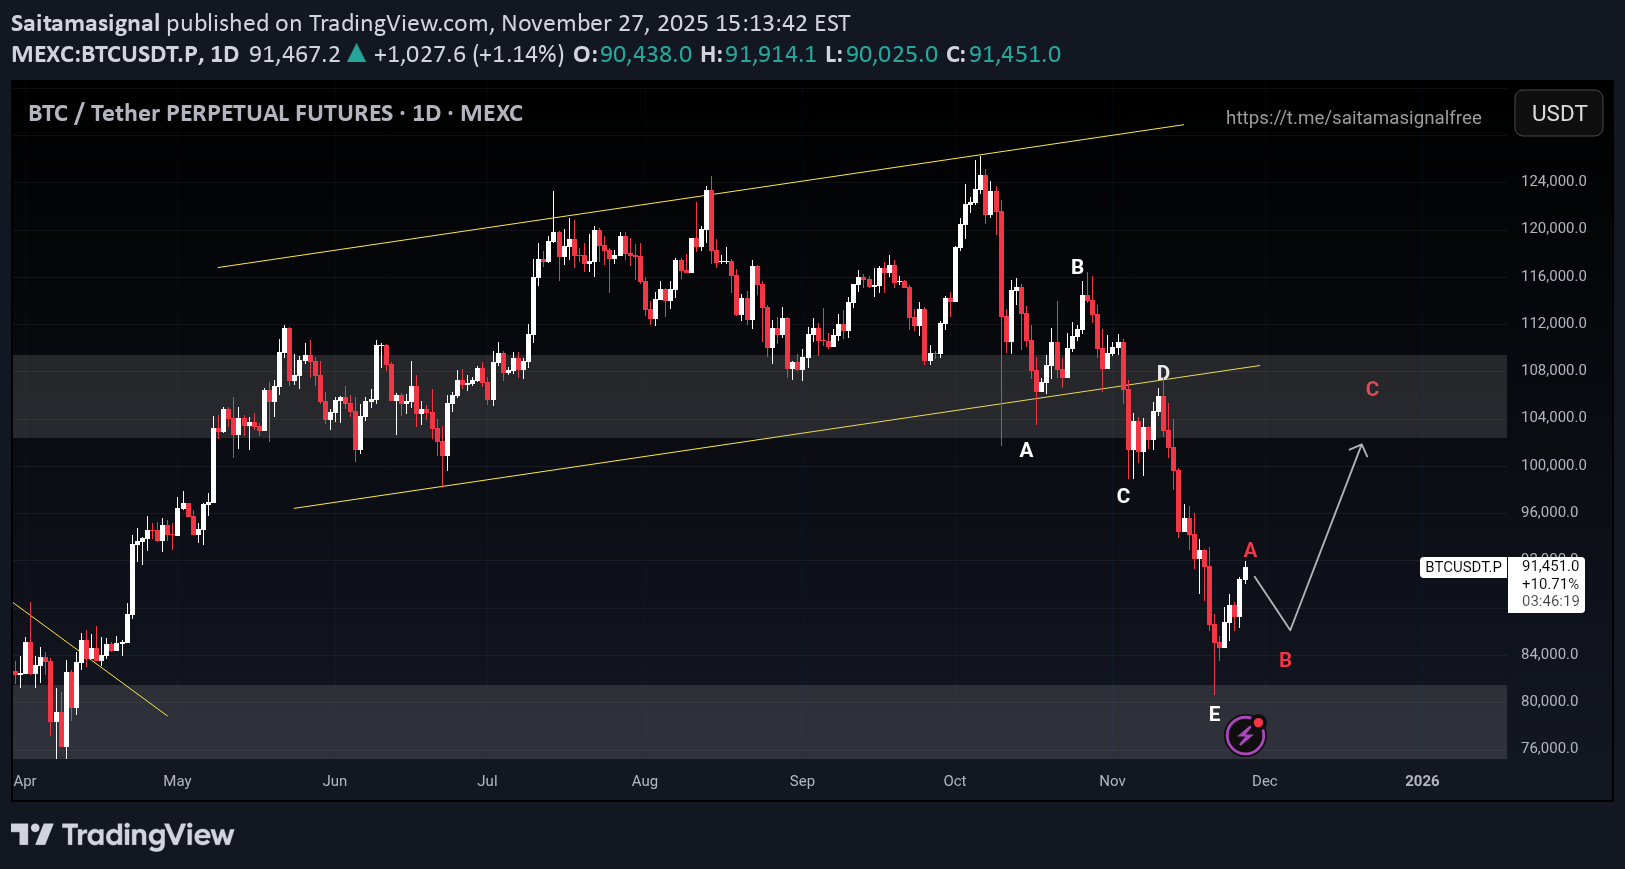
Wow, THE MARKET IS CRAZY AGAIN GREAT VIBE! 🔥 BTC NYUNGSEP: BTC after the party at 108K USDT, then it was SHASHED severely by the seller, immediately FALLED to 81K USDT like it was in free fall! Horrified by the damage! REBOUND ISN'T IT?: At the discounted price of 84K (point "E"), someone is starting to SCRATCH DOWN, guys! It looks like there is a white and red candle that gives you a hint that you want to bounce! NEXT LEVEL: The prediction is that he will try to RISE again. But remember, the market can PRANK us at any time! I'M EMPHASIZED: DON'T BE FOMO (fear of missing out) or FUD (fear, uncertainty, and doom). Stay cool! SAFE GASPOL: Your risk management must be ON POINT to avoid sudden margin calls or stop-losses! Disclaimer: Crypto trading is high risk, and can result in big profits or even heartache. This analysis is just for fun and hype based on the charts, not for telling you to go all-in. DYOR (Do Your Own Research) always, bro!
Saitamasignal
سیگنال انفجار قیمت فارتکوین: اهداف هیجانانگیز و نقطه ورود طلایی!
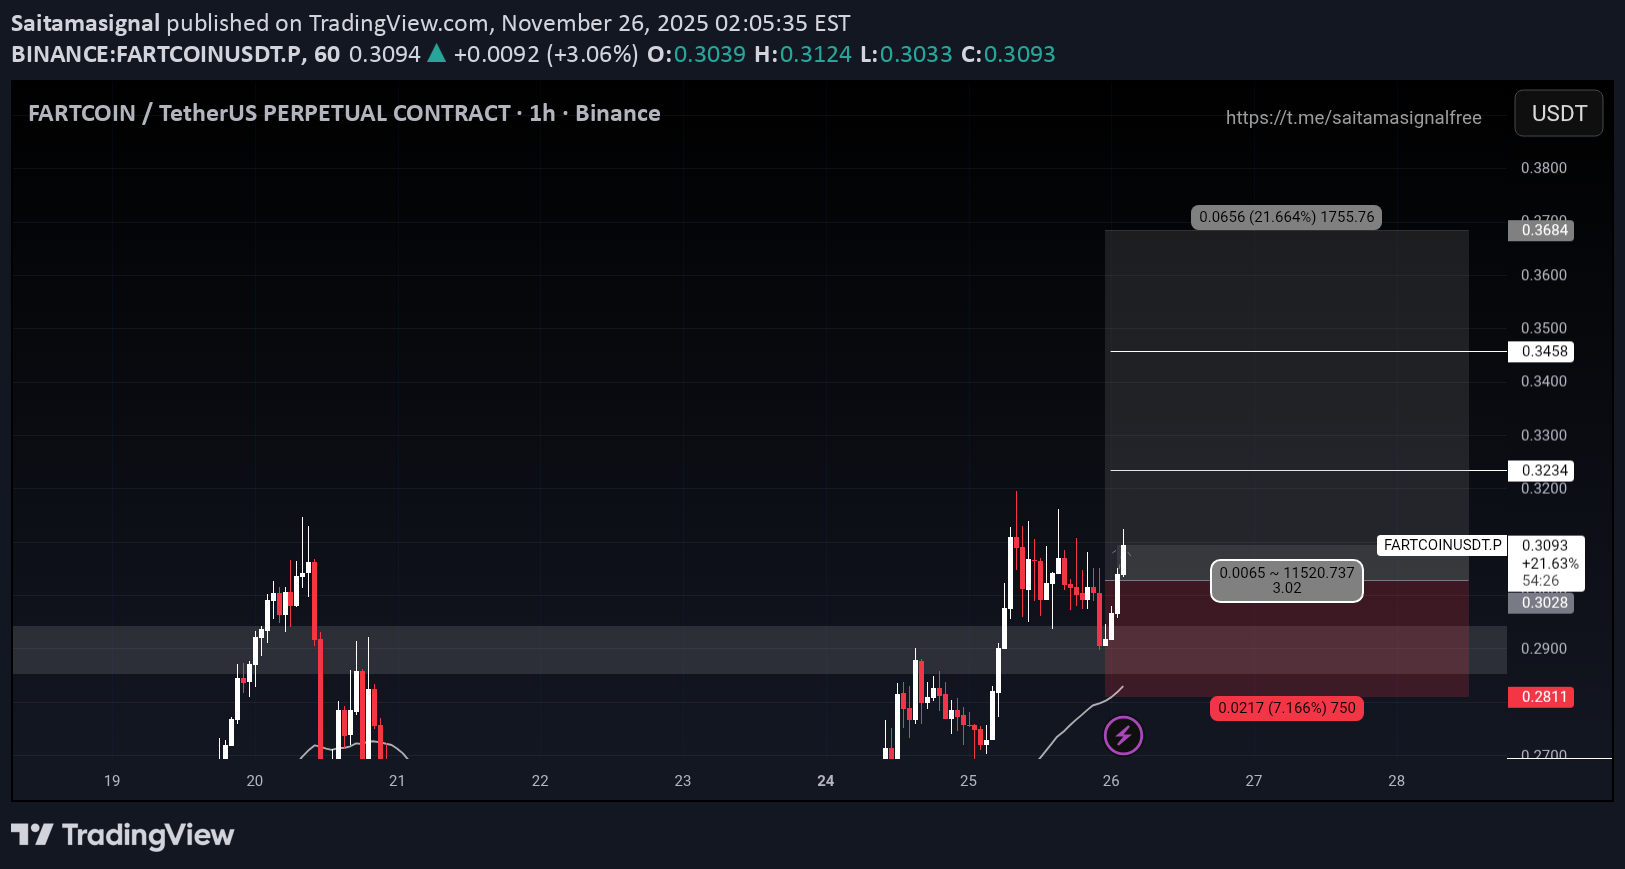
COIN NAME : FARTCOINUSDT ( isolated ) Buy long zone : 1) 0.3044 Take profit : 1) 0.3234 2) 0.3458 3) 0.2811 Stop loss : 0.3684 Max leverage: 10x Amount : 2.0% "FARTCOIN isn't just a regular fart, it's a fart that smells like profit! 🚀 Technical analysis says BUY, whales are buying! Resistance breakout has occurred, target next month! Don't forget to set a stop loss, bro! 💸📈 #FARTCOIN #Crypto #TradingView #PumpSignal #Bullish" Disclaimer: This is not financial advice. Always do your own research and use strict risk management. The crypto market is highly volatile.
Saitamasignal
تحلیل فوری اتریوم: فرصت صعود از کف حمایتی (ETHUSD) + سطوح کلیدی خرید و فروش
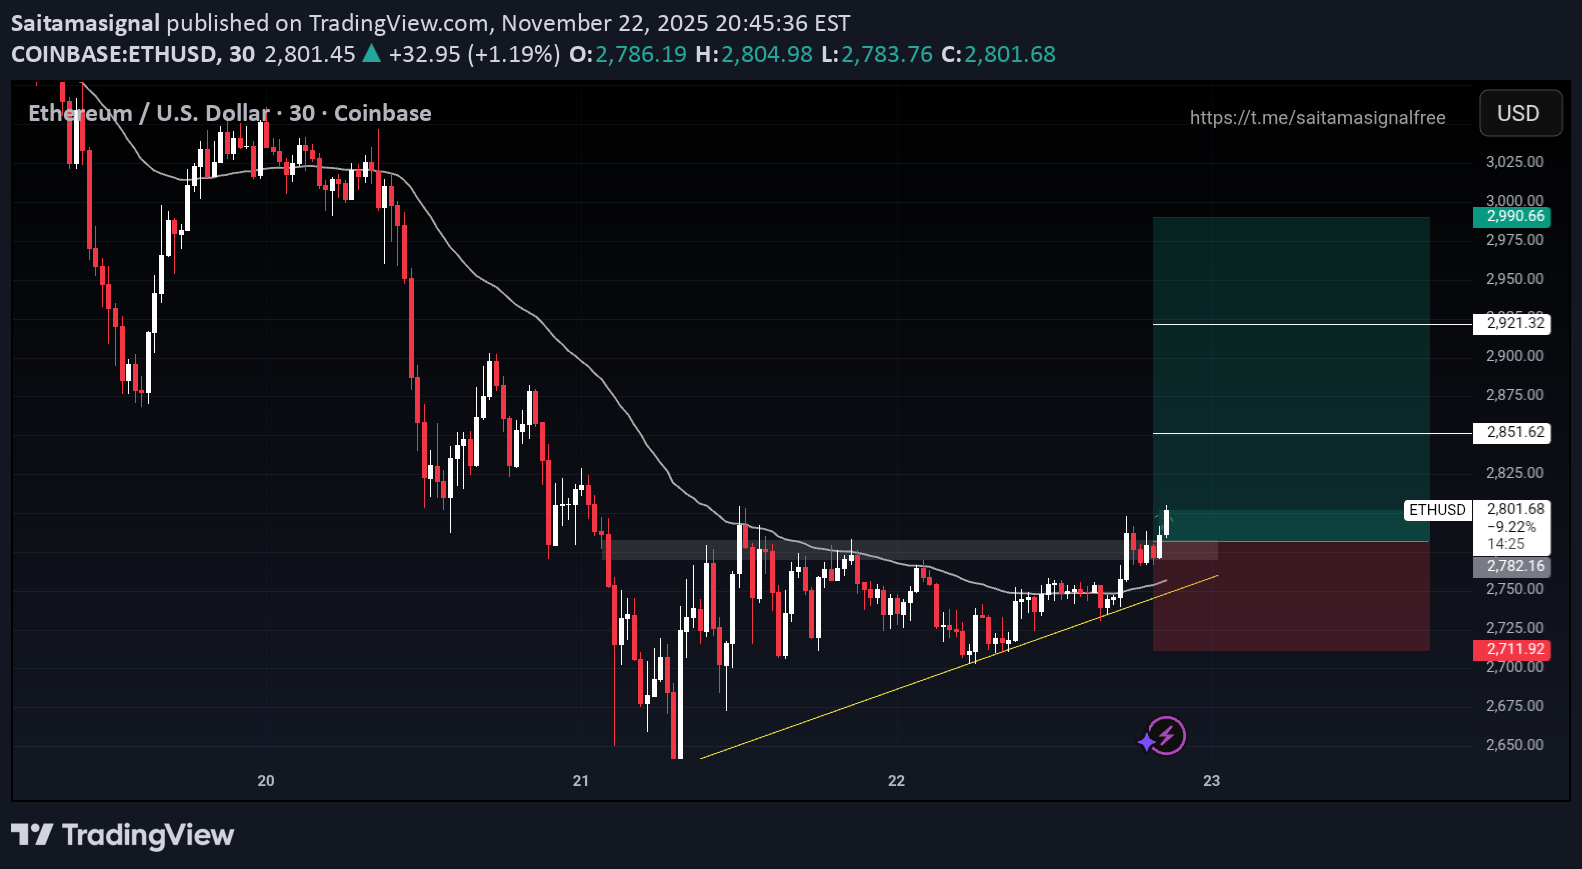
YO TRADERS! READY FOR GAINS? 🚀 QUICK ETHUSD UPDATE: BOUNCING AT SUPPORT! Hey Bro & Sis Traders! Check out Ethereum ( ETHUSD ) giving us some sweet signals on the 30-minute time frame! WHAT'S THE CHART SAYING? 📈 WAR ZONE: The price is bouncing nicely right at our strong support fortress in the $2,780 - $2,820 area. This is where the whales start accumulating! FULL THROTTLE UP?: If this fortress holds against the bear attack, we prepare for a party. The nearest targets are $2,880 & ready to break through to $2,920! Time to set up those TP (Take Profit) baskets! CAREFUL OF FALLS! 📉: But remember bro, the crypto market is brutal! If that $2,711 support breaks, better run (cut loss)! It might dump OUR PLAN: Entry: $2,782. Stop Loss: $2,711 TP: 1)$2,851 2)$2,921 3)$2,990 ⚠️ IMPORTANT: THIS IS NOT FINANCIAL ADVICE! MANAGE YOUR OWN RISK (DYOR)! DON'T FOMO! ⚠️ Let's make some money! Gains together, out together! 🔥🔥🔥
Saitamasignal
تحلیل تکنیکال بیتکوین دش (DASH/USDT)؛ سیگنال خرید در تایم فریم 1 ساعته با تارگتهای جذاب!
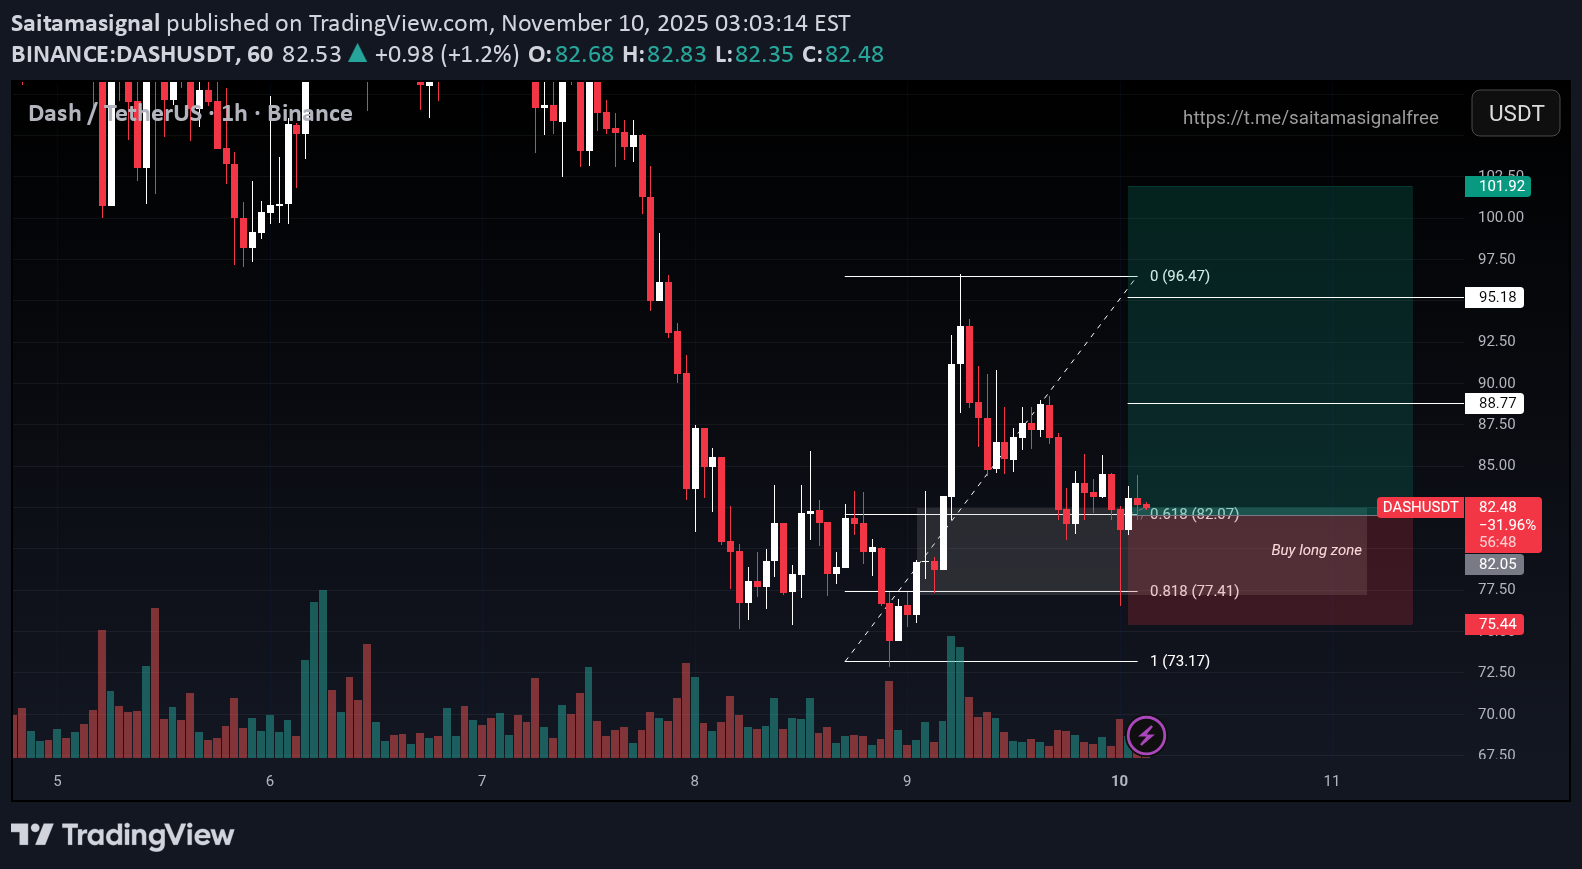
COIN NAME : DASHUSDT ( isolated ) Buy long zone : 1) 82.52 Take profit : 1) 88.77 2) 95.18 3) 101.92 Stop loss : 75.44 Max leverage: 4x Amount : 2.0% Binance DASH/USDT 1H Analysis. The price reacted strongly in the Buy Long Zone (Fibonacci level 0.618-0.818). There is a strong potential for a technical rebound and a retest of the nearest resistance. Please pay attention to your risk management. DASH #Crypto #TradingSignal #DASHUSDT #DYOR
Disclaimer
Any content and materials included in Sahmeto's website and official communication channels are a compilation of personal opinions and analyses and are not binding. They do not constitute any recommendation for buying, selling, entering or exiting the stock market and cryptocurrency market. Also, all news and analyses included in the website and channels are merely republished information from official and unofficial domestic and foreign sources, and it is obvious that users of the said content are responsible for following up and ensuring the authenticity and accuracy of the materials. Therefore, while disclaiming responsibility, it is declared that the responsibility for any decision-making, action, and potential profit and loss in the capital market and cryptocurrency market lies with the trader.