
APT
Aptos
| تریدر | نوع سیگنال | حد سود/ضرر | زمان انتشار | مشاهده پیام |
|---|---|---|---|---|
 AAK_Rank: 384 | فروش | حد سود: تعیین نشده حد ضرر: تعیین نشده | 1/4/2026 | |
 BogbeeRank: 1528 | خرید | حد سود: تعیین نشده حد ضرر: تعیین نشده | 1/2/2026 | |
 ObamaPumpRank: 1603 | خرید | حد سود: تعیین نشده حد ضرر: تعیین نشده | 1/2/2026 | |
خرید | حد سود: تعیین نشده حد ضرر: تعیین نشده | 1/2/2026 | ||
 vf_investmentRank: 16876 | خرید | حد سود: تعیین نشده حد ضرر: تعیین نشده | 12/6/2025 |

Price Chart of Aptos
سود 3 Months :
خلاصه سیگنالهای Aptos
سیگنالهای Aptos
Filter
Sort messages by
Trader Type
Time Frame
AAK_
APTUSDT SHORT SCALP IDEA BEARSH

Price is trading inside a higher-timeframe supply zone Price is currently reacting from a higher-timeframe supply zone, and I’m expecting a pullback to test demand again before any meaningful continuation. Short-term bearish / corrective scalp-focused idea ⚠️ Disclaimer This analysis reflects my personal opinion and is for educational purposes only. It is not financial advice. Trading involves risk—always manage risk and make your own decisions.
Bogbee
APT - Bullish Accumulation?

I can't ignore the much higher than normal volume on APT over the last 90 days with much of the accumulation occurring near the lows especially after it read oversold on the RSI. If it breaks its early Dec highs, it could be an interesting swing long. Nice upside potential.
ObamaPump
APT APTOS BUILDING MOMENTUM

Support holding near major demand levels suggests traders are defending this floor—momentum could shift if buyers step in.
Will APT see 50% growth?

Aptos plummeted 61% with no rebounds! There is a high probability of seeing a similar movement until the first short FVG on the daily chart. I think we will see a similar movement by the end of January or early February. There are bullish divergences and oversold conditions in the RSI. Technically, there should be a rebound after a 61% drop without rebounds. APTUSDT.P

CryptoAnalystSignal
##APT/USDT 1H – Stablecoin-heavy, swing long from local base
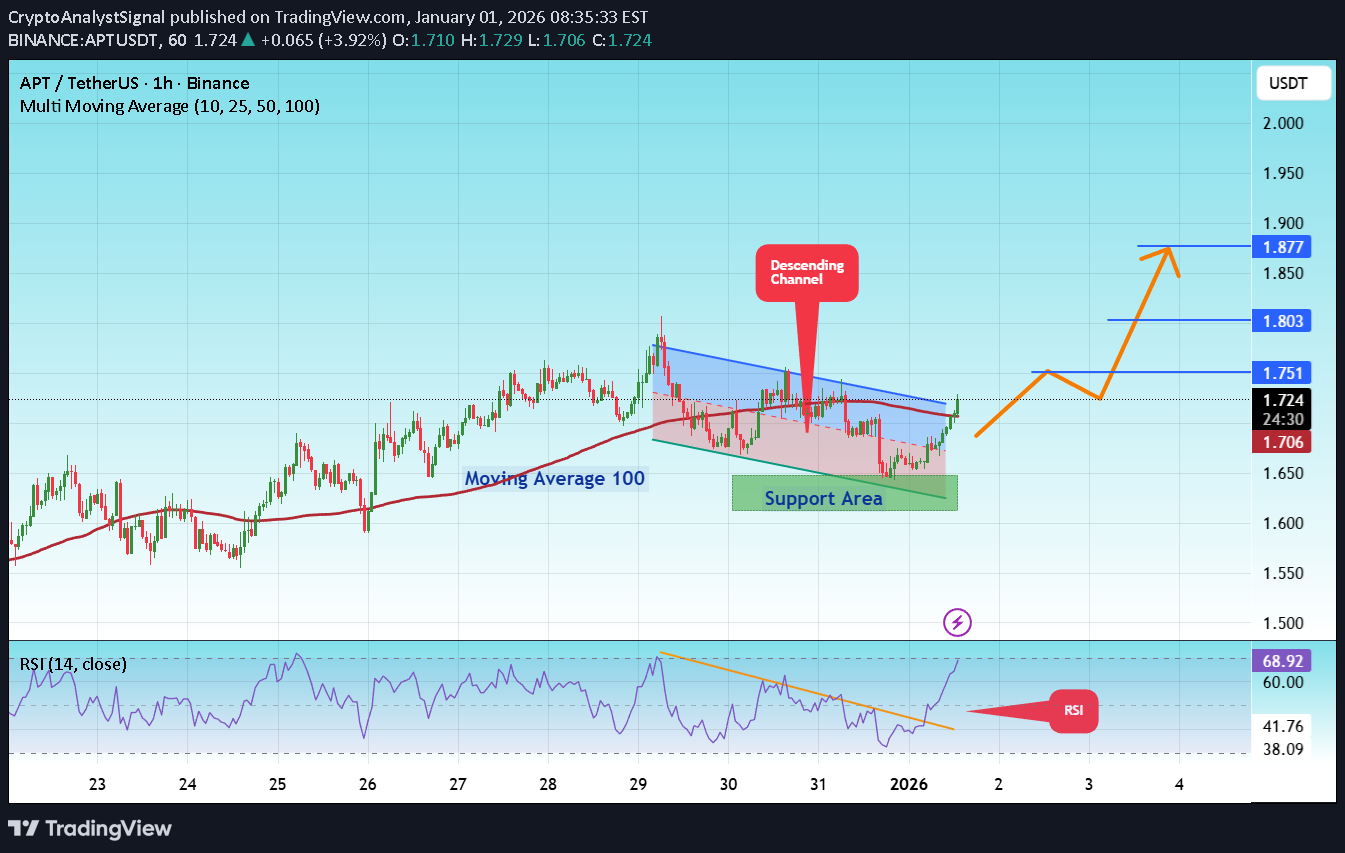
#APT The price is moving in a descending channel on the 1-hour timeframe. It has reached the lower boundary and is heading towards a breakout, with a retest of the upper boundary expected. We are seeing a bearish trend in the Relative Strength Index (RSI), which has reached near the lower boundary, and an upward bounce is expected. There is a key support zone in green at 1.62, and the price has bounced from this level several times. Another bounce is expected. We are seeing a trend towards stabilizing above the 100-period moving average, which we are approaching, supporting the upward trend. Entry Price: 1.71 First Target: 1.75 Second Target: 1.80 Third Target: 1.87 Remember a simple principle: Money Management. Place your stop-loss order below the green support zone. For any questions, please leave a comment. Thank you.#APT First Target: 1.75 Reached Second Target: 1.80 Reached Third Target: 1.87 Reached

Bithereum_io
APTUSDT 1D
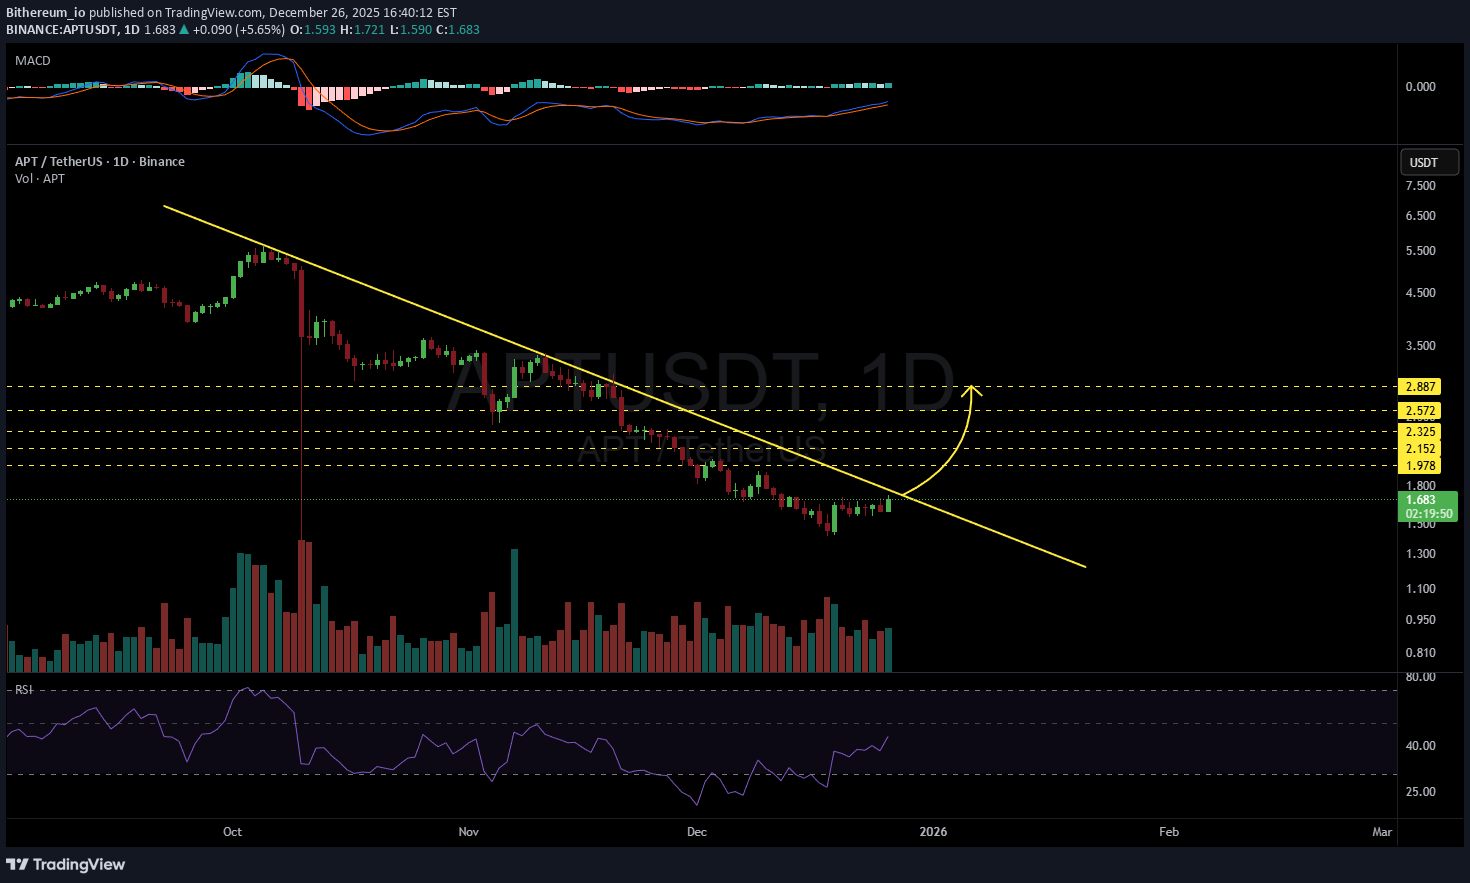
#APT is trading near the descending resistance on the daily chart. If a breakout above this level occurs, the potential upside targets are: 🎯 $1.978 🎯 $2.152 🎯 $2.325 🎯 $2.572 🎯 $2.887 ⚠️ Ensure tight stop-losses and disciplined risk management at all times.

SwallowAcademy
Aptos (APT): Looking For MSB + BOS | Bullish Setup
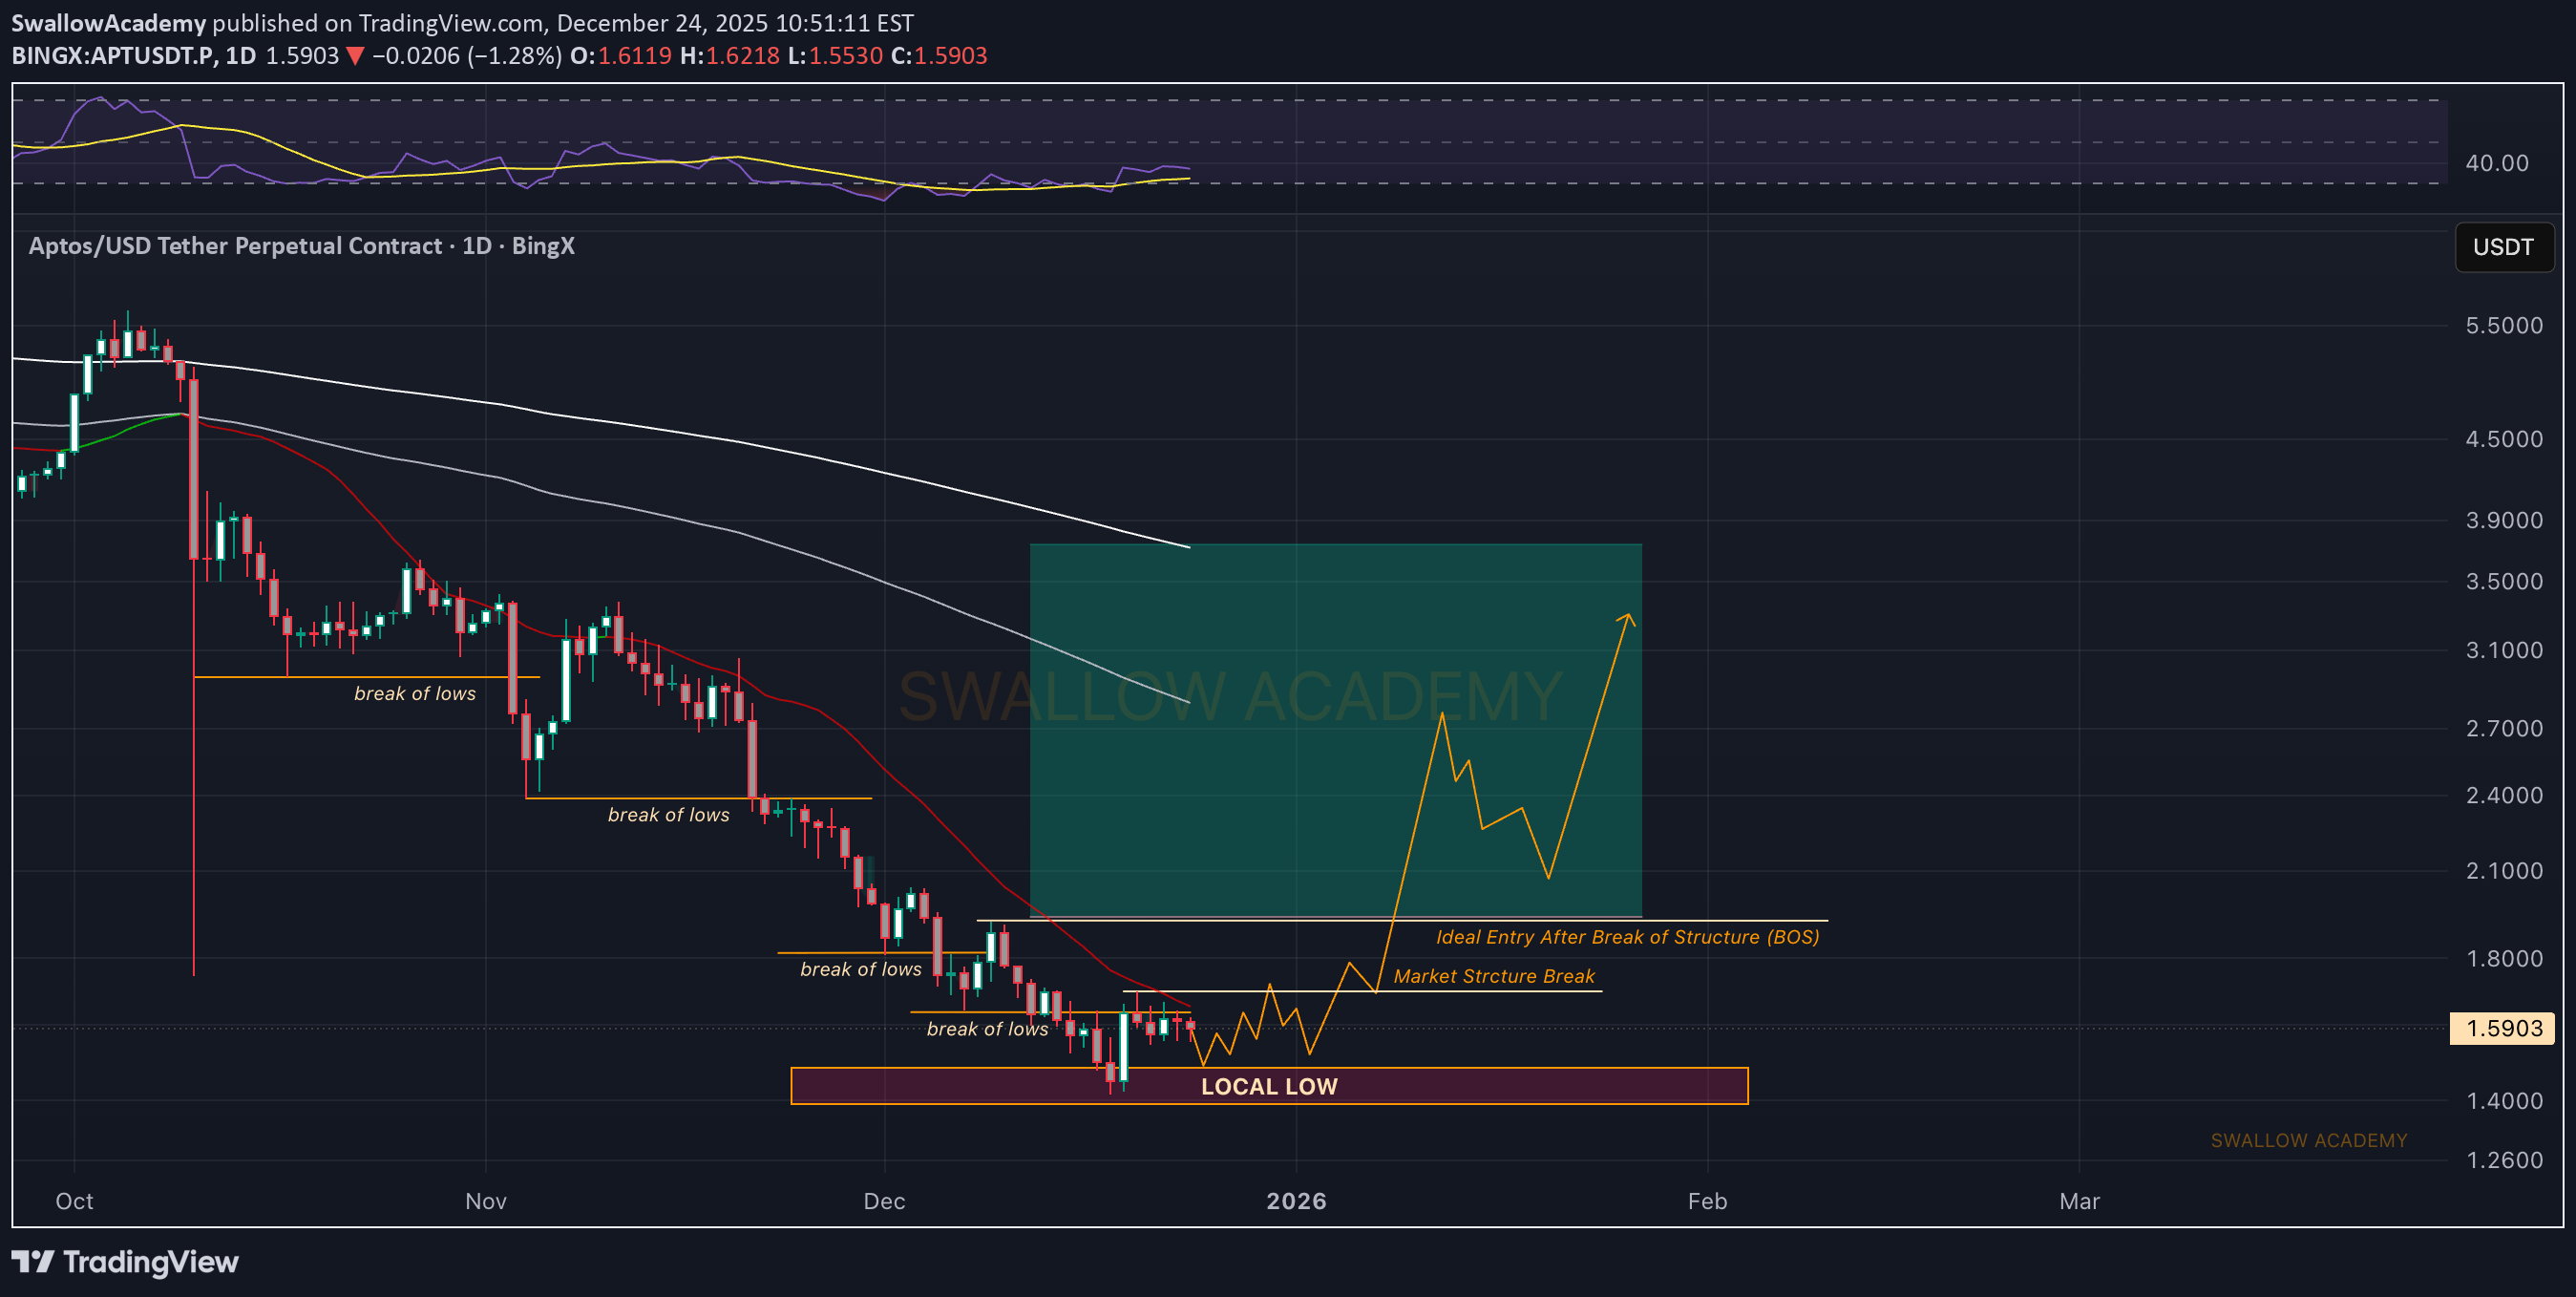
APT is still trading at the local low after a series of clear breaks of structure to the downside. For now, price is stabilizing at this support zone, but buyers haven’t confirmed control yet. The game plan is simple: we wait for a proper market structure break to form. Once that happens, we then look for a confirmational BOS, which would be our entry trigger. Until structure shifts, this remains a wait-for-confirmation setup rather than a full send. Swallow Academy
$APT
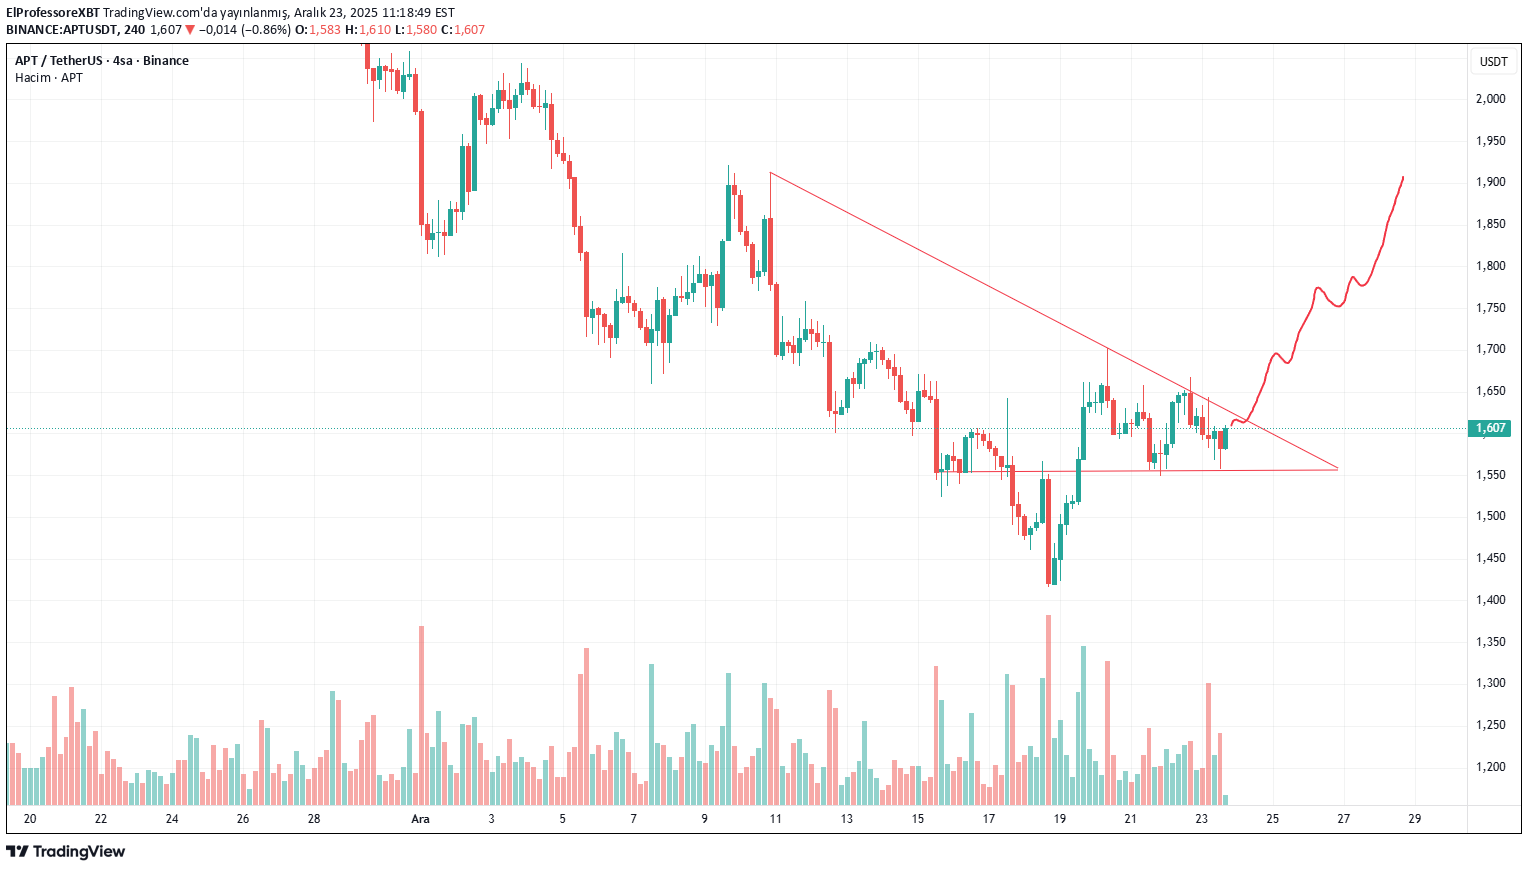
Price has been trading under a descending trendline for a prolonged period, but recent price action shows a clear loss of bearish momentum. The market is now compressing near the trendline while holding a horizontal support base, forming a classic descending triangle / compression structure. This type of structure often precedes a volatility expansion. As long as price continues to hold above the horizontal support, the probability favors a bullish breakout rather than further downside. A confirmed break and close above the descending trendline would signal a trend shift, opening the door for a strong recovery move toward the upper resistance zones. The projected path suggests higher highs and higher lows once the breakout is validated. Invalidation occurs only if price loses the support base with strong selling pressure. Until then, structure remains constructive, and patience is key while price builds energy for the next move.

RLinda
APTUSDT - Correction and liquidity capture before the fall
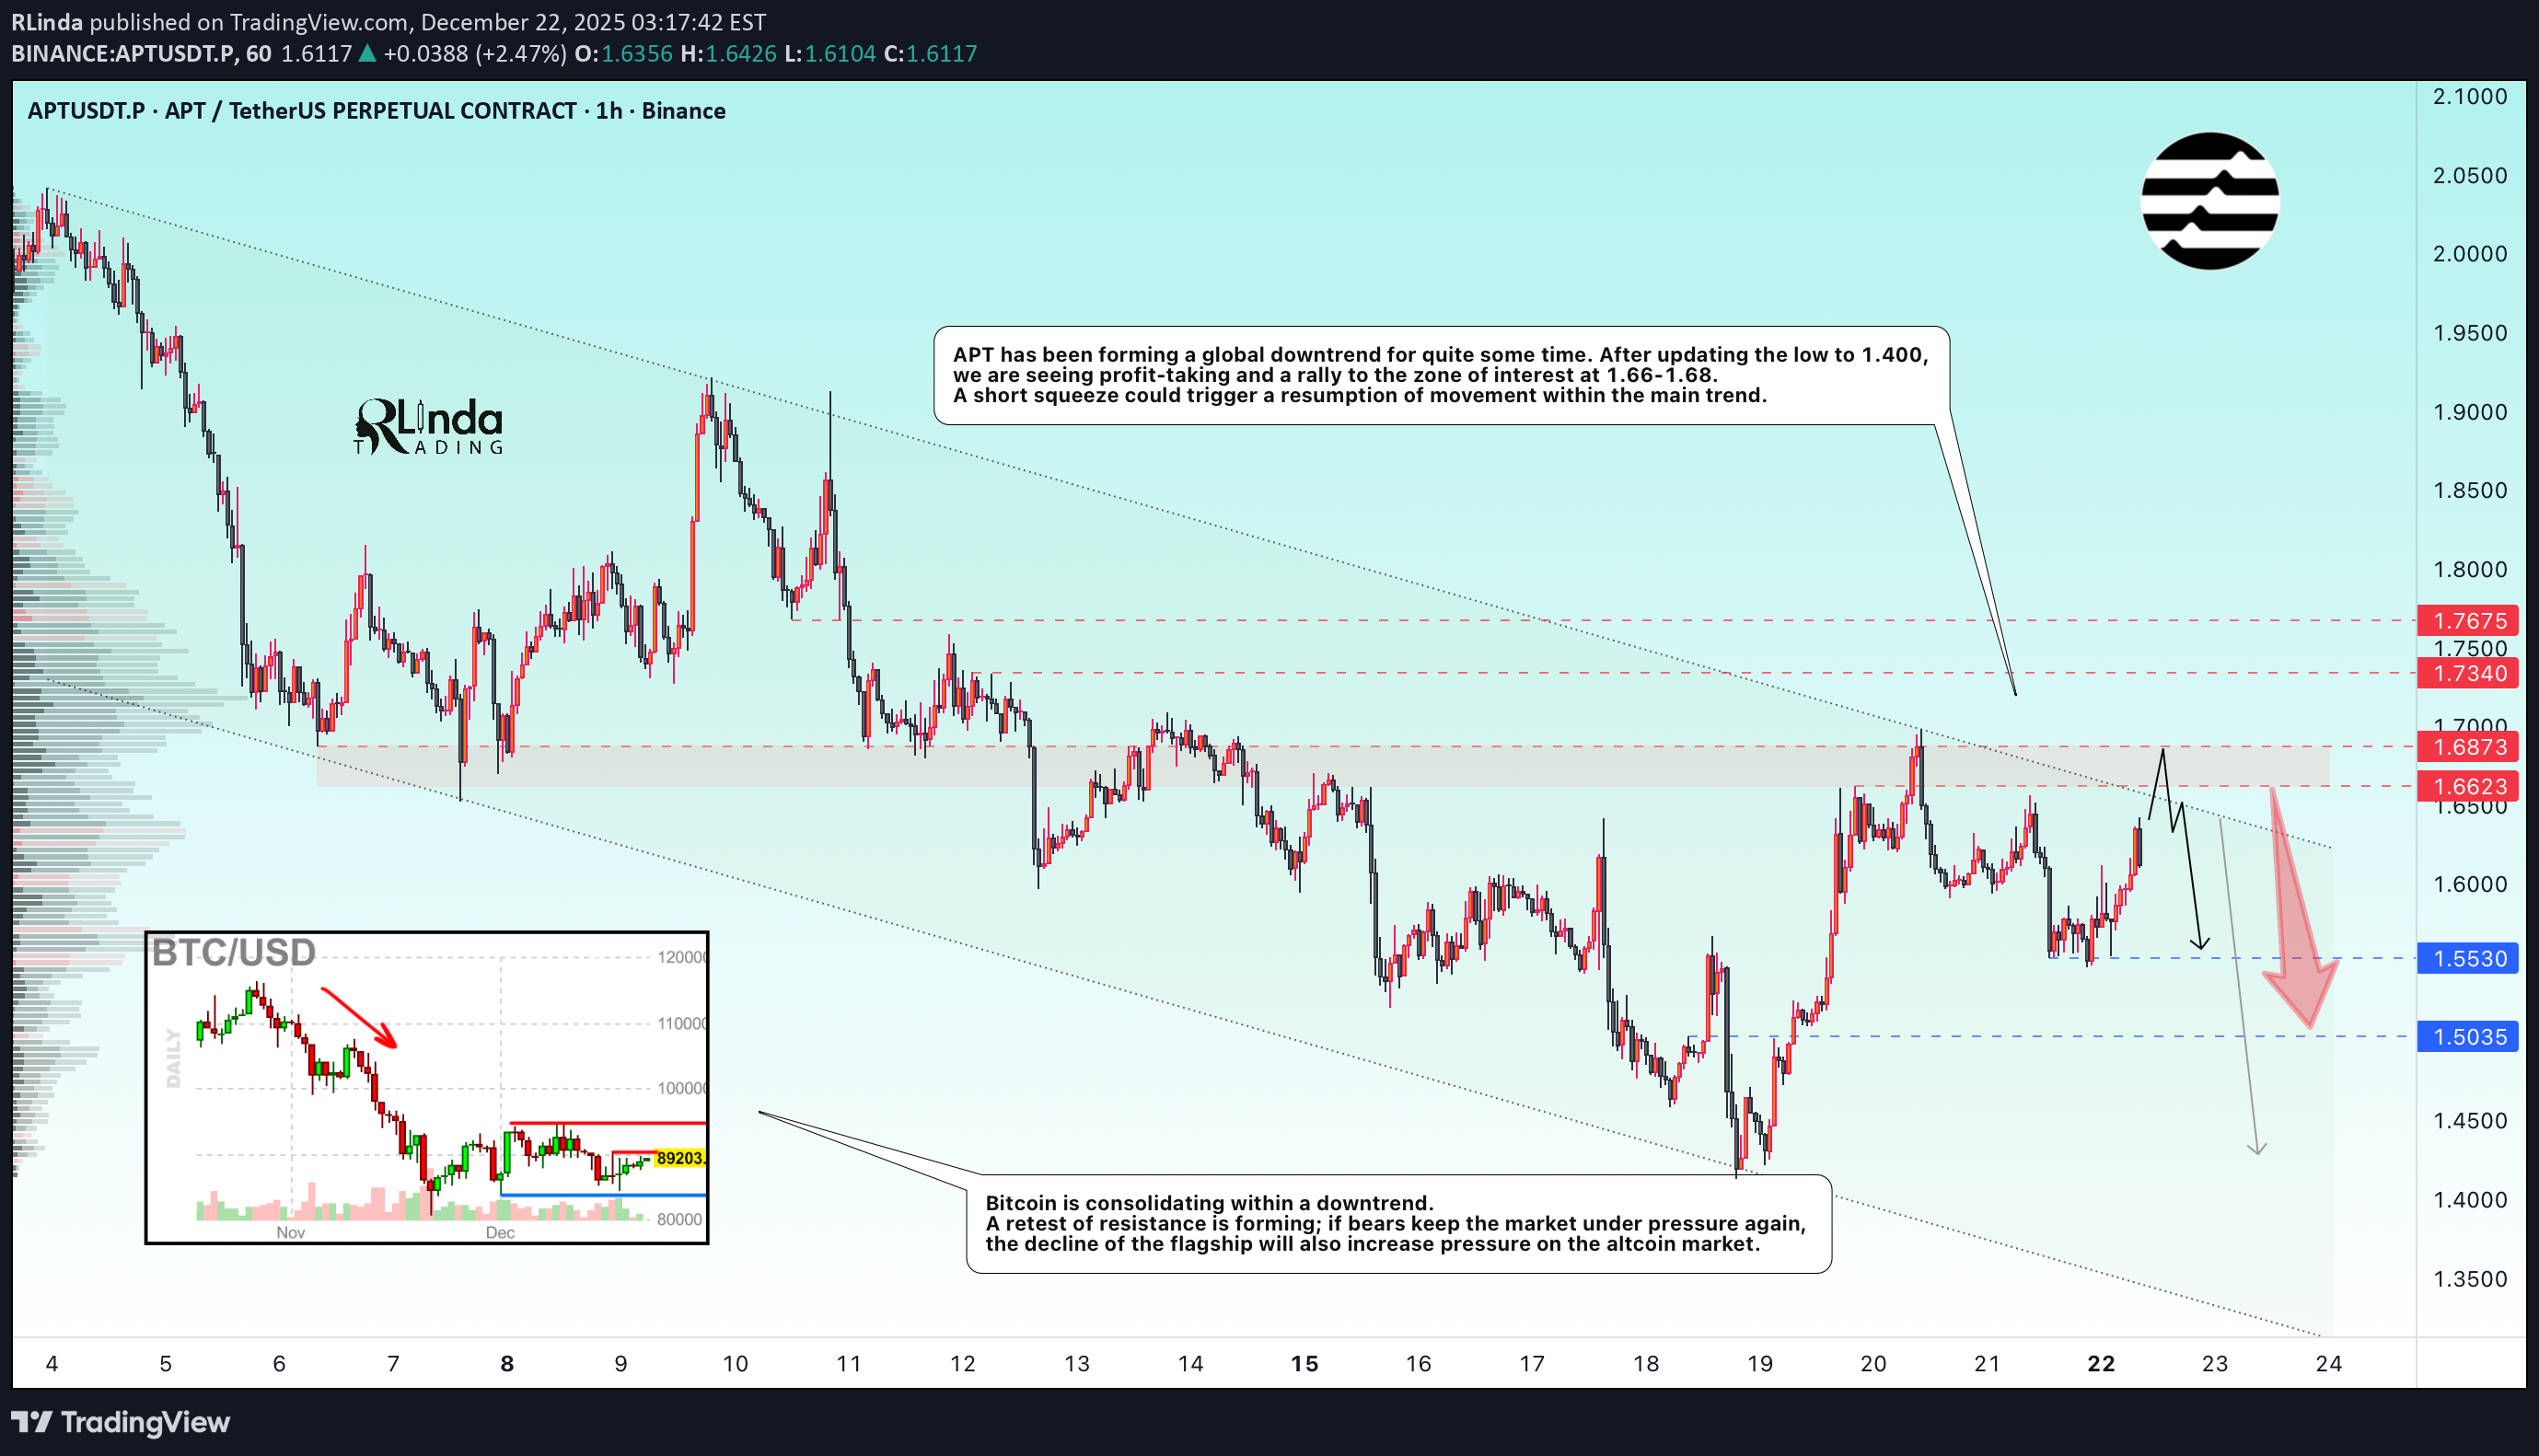
APTUSDT.P is making a countertrend move towards the zone of interest 1.66 - 1.68. Global and local trends are downward, and bearish pressure may do its job... Bitcoin is consolidating within a downward trend. A retest of resistance is forming; if bears keep the market under pressure again, the decline of the flagship will also increase pressure on the altcoin market. APT has been forming a global downward trend for quite some time. After updating the low to 1.400, we are seeing profit-taking and a rally to the zone of interest 1.66 - 1.68. A short squeeze could trigger a resumption of movement within the main trend. Resistance levels: 1.6623, 1.6873, 1.734 Support levels: 1.553, 1.5035 A retest of the specified resistance zone and the absence of bullish momentum could give us a false breakout, which in turn could trigger a reversal of the local downward movement... Best regards, R. Linda!

behdark
APT Buy/Long (4H)
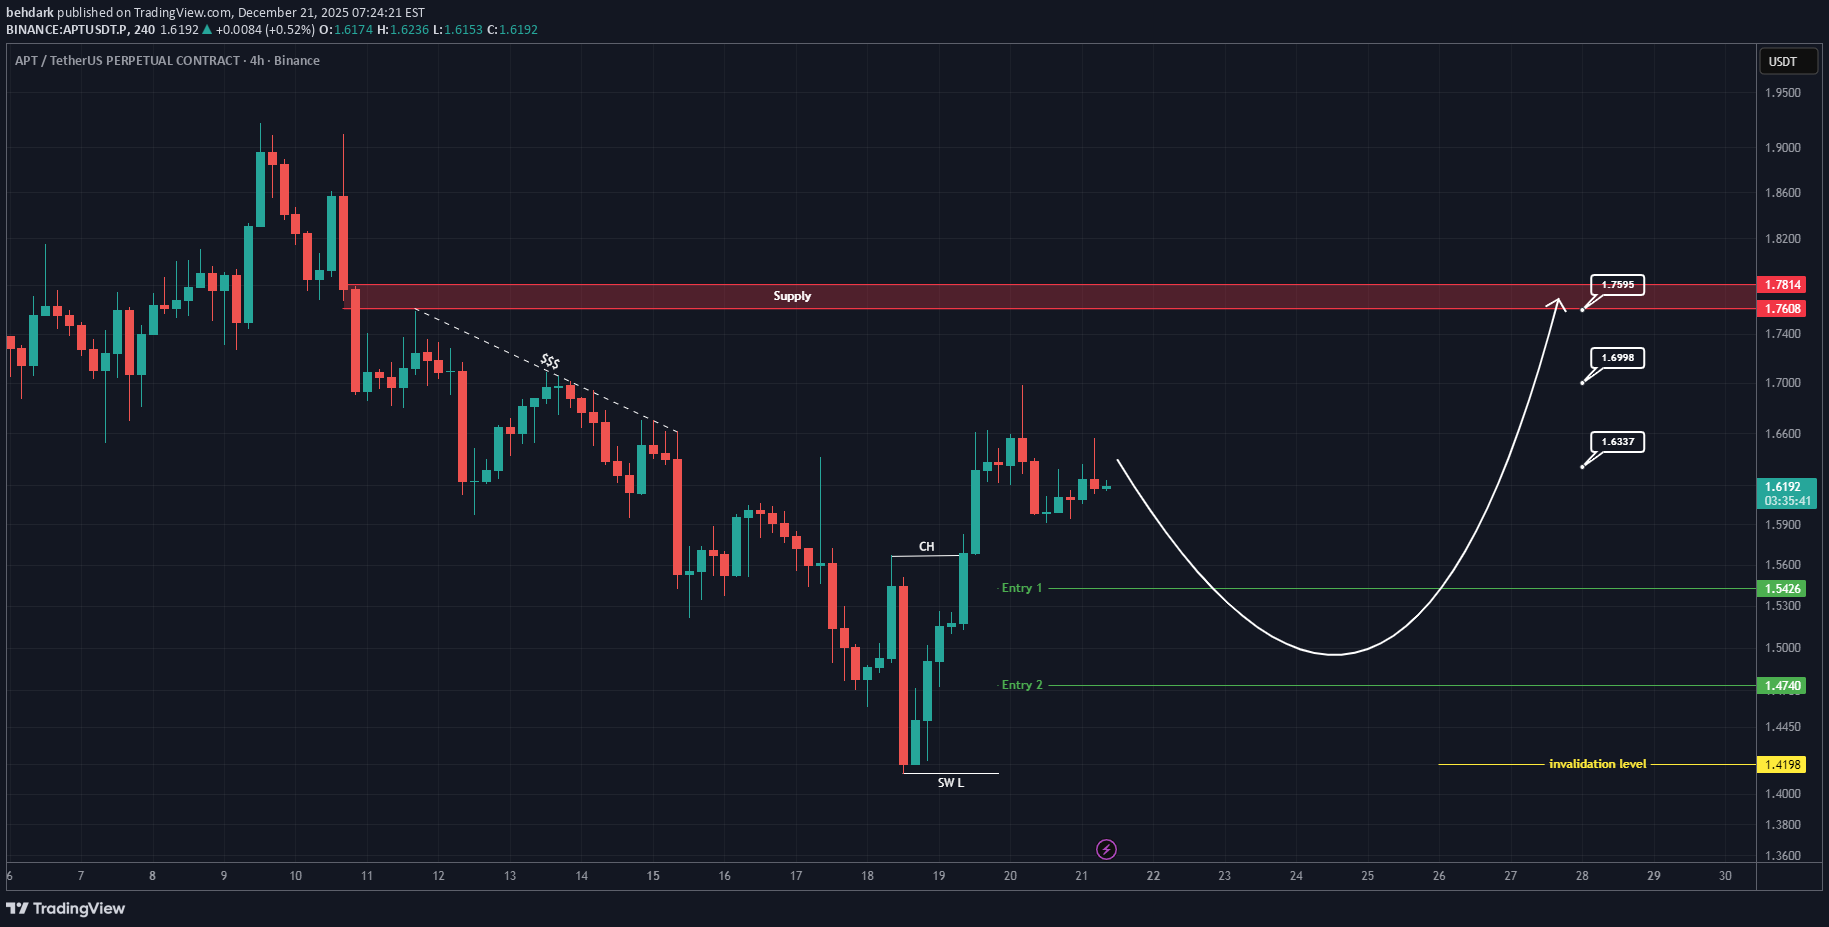
A solid structure shift has occurred on the chart, and a liquidity pool is visible above. If price reaches our entry zones before touching the supply area, we will enter the position. We have two entry points, and we will enter using a DCA approach. The targets are marked on the chart. A daily candle close below the invalidation level will invalidate this analysis. For risk management, please don't forget stop loss and capital management When we reach the first target, save some profit and then change the stop to entry Comment if you have any questions Thank You
Disclaimer
Any content and materials included in Sahmeto's website and official communication channels are a compilation of personal opinions and analyses and are not binding. They do not constitute any recommendation for buying, selling, entering or exiting the stock market and cryptocurrency market. Also, all news and analyses included in the website and channels are merely republished information from official and unofficial domestic and foreign sources, and it is obvious that users of the said content are responsible for following up and ensuring the authenticity and accuracy of the materials. Therefore, while disclaiming responsibility, it is declared that the responsibility for any decision-making, action, and potential profit and loss in the capital market and cryptocurrency market lies with the trader.