
RLinda
@t_RLinda

What symbols does the trader recommend buying?
Purchase History
پیام های تریدر
Filter
RLinda
GOLD - The market may update its ATH after a correction...
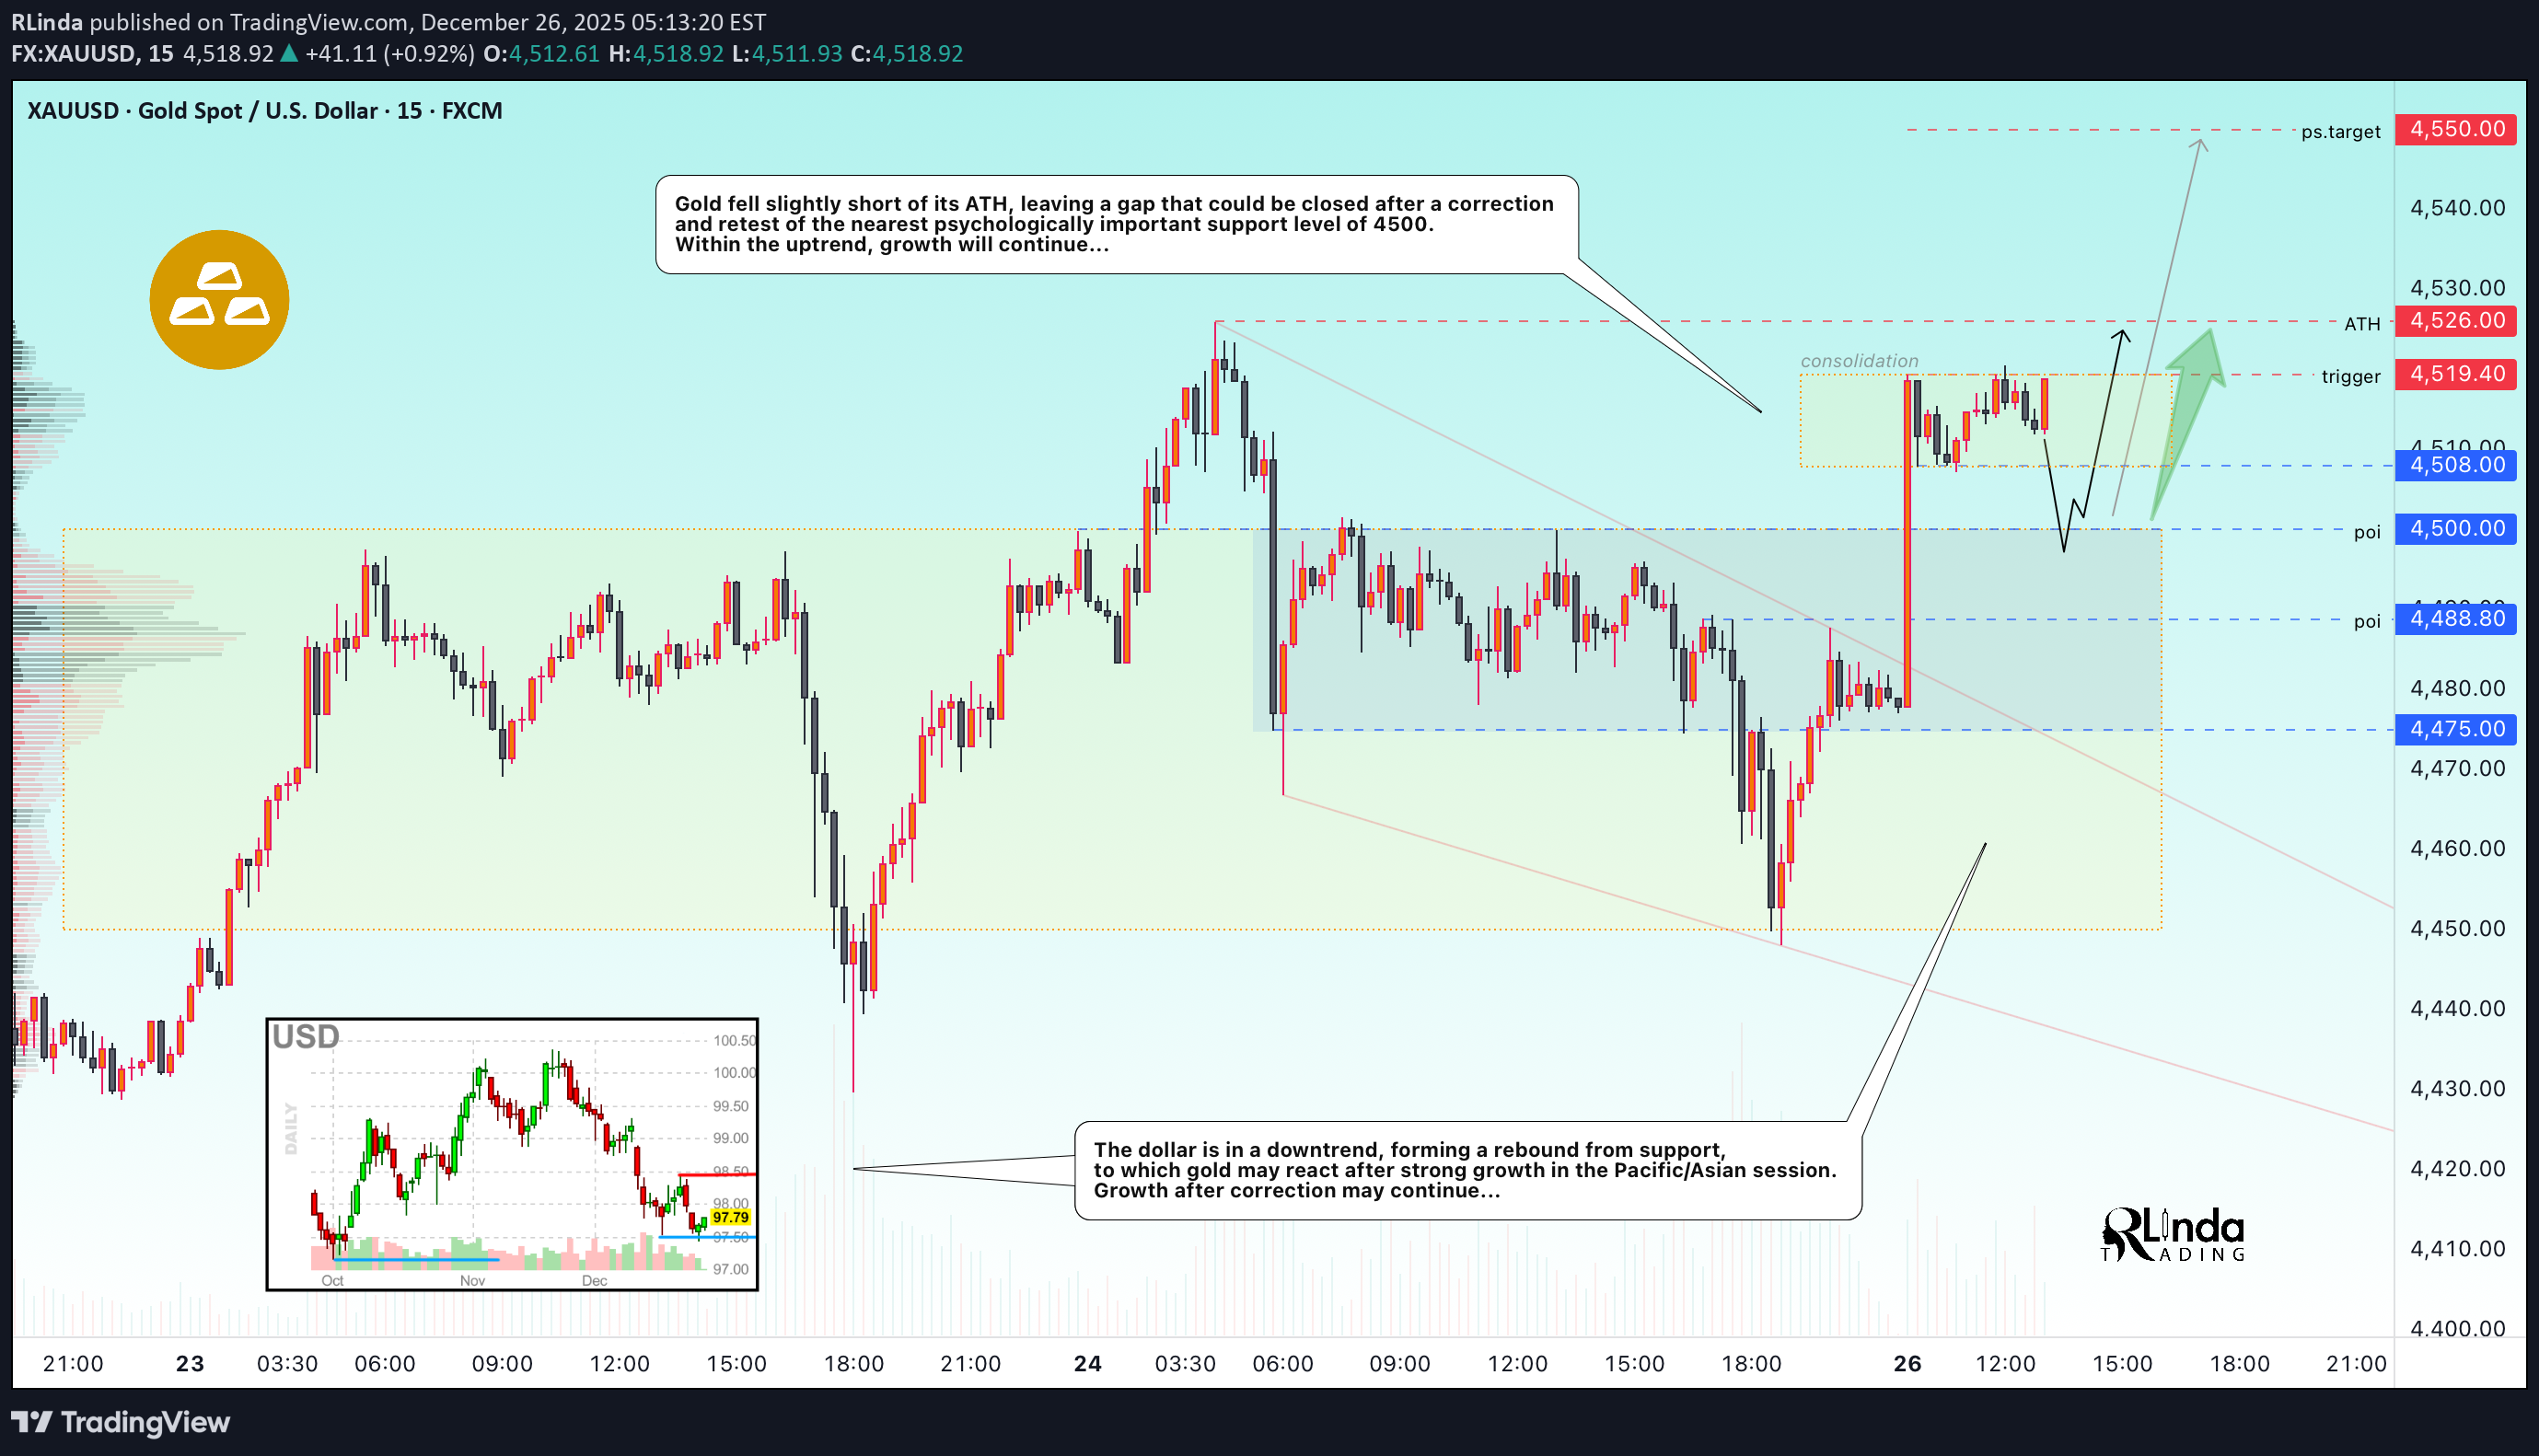
XAUUSD bounces off 4475 and updates its local maximum in the distribution phase to 4519.4. Against the backdrop of low liquidity associated with the end of the calendar year, movements may be sharp and unpredictable... The fundamental background remains unchanged, supporting gold: a weak dollar, tense geopolitical situation, mixed data from the US. However, the main problem at the moment is low liquidity due to the holidays. The Asian market bought up the supply and drove up the price. After such a strong movement, the market may enter a consolidation or correction phase, during which it may test 4508-4500 before rising. Resistance levels: 4519, 4526, 4550 Support levels: 4508, 4500 A low-liquidity market is easier to manage (in terms of manipulation). Accordingly, use strong setups and short targets for trading, as movements can be sharp and unpredictable. I expect the bull market to continue after the correction. Best regards, R. Linda!
RLinda
AVAXUSDT - The hunt for liquidity before the fall

AVAXUSDT , within the context of a global downtrend and low liquidity associated with market conditions, is forming a short squeeze ahead of a possible decline. The global trend is protracted and downward, which generally indicates the dominance of bears in the medium and long term. Bitcoin is consolidating against the backdrop of a downward trend, which generally creates negative sentiment in the market. AVAX is forming a short squeeze of consolidation resistance at 12,460, formed against the backdrop of a global downward trend. This is a manipulative maneuver to accumulate liquidity before a possible decline. If the bears keep the price below 12.540 - 12.460, then a decline can be expected in the short and medium term. Resistance levels: 12.46, 12.54 Support levels: 12.03, 11.94, 11.26 A false breakout of resistance could confirm the end of the correction or consolidation and trigger a continuation of the main downtrend. Best regards, R. Linda!
RLinda
GOLD - Hunting for liquidity ahead of growth. Focus on 4475
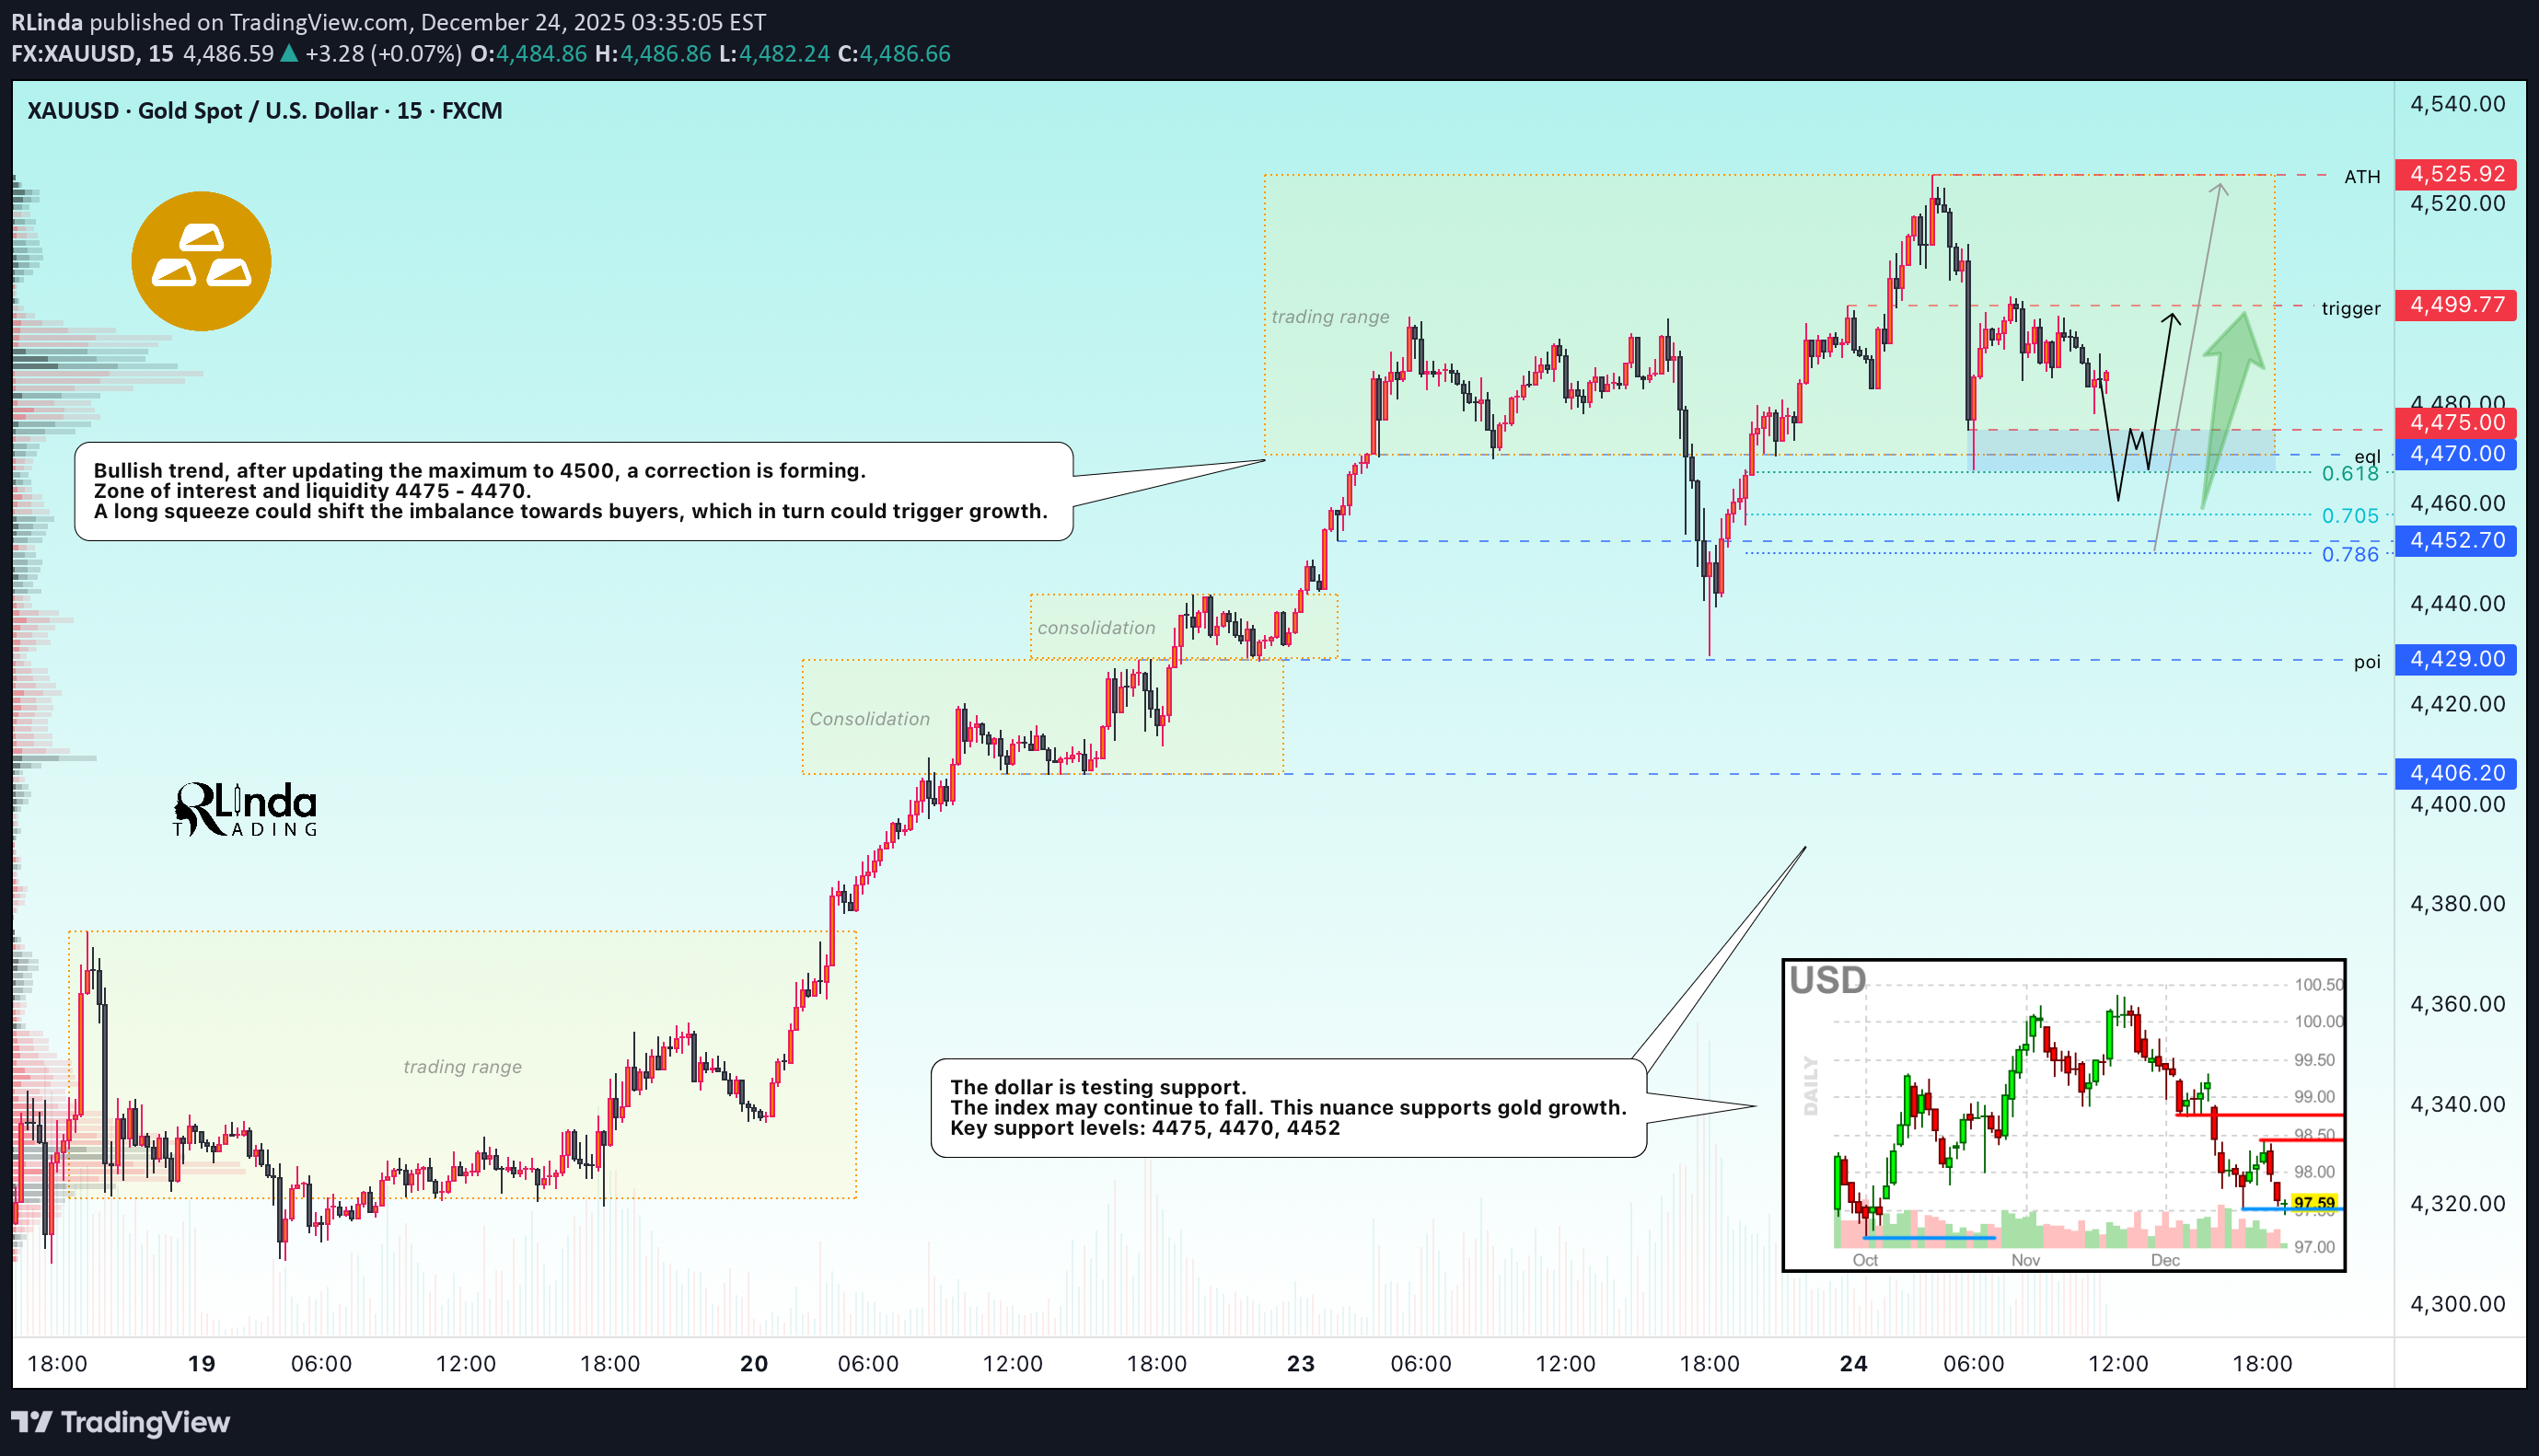
XAUUSD reached a new historic high of around $4,525. However, profit-taking is causing a correction, with the 4,475-4,470 range being the area of interest in the bull market. The dollar is weakening, with the market anticipating two rate cuts in 2026. Geopolitical risks are supporting demand for safe-haven assets. Positive US GDP data for Q3 (+4.3%) did not support the dollar due to expectations of a slowdown in growth in Q4. The dollar index has hit its lowest level since early October. Today, US jobless claims data will be released, which may increase volatility. The overall positive sentiment in the stock markets is holding back more active growth in gold. The upward trend in gold continues. Any significant correction is likely to be seen as a buying opportunity, given the Fed's accommodative monetary policy and geopolitical uncertainty. Resistance levels: 4500, 4525 Support levels: 4475, 4470, 4466, 4452 Focus on the current trading range of 4475-4525. A false breakdown of support could attract buyers waiting for favorable prices. I do not rule out a retest of 4452-4442 before growth (against the backdrop of aggressive profit-taking). Best regards, R. Linda!Local timeframe 1H - 15M - overview of the situation The price is in a wide channel of 4450 - 4500. At the moment, we are interested in the local channel of 4475 - 4500 and the downward resistance formed from the ATH. If the bulls hold their defense above the 4475 support, there may be a bullish run relative to this border with an attempt to break through the downward resistance, which in turn will confirm the end of the correction, and we can expect an upward movement with a struggle for the 4488 - 4499 zone... However, I do not rule out that before further growth, the market may fall below 4475. An important zone below is 4470 - 4460. The trend is local, global - bullish, the fundamental background is positive at the moment. Any corrections can sharply change the direction to upward...
RLinda
SUIUSDT - Readiness for bearish distribution

SUIUSDT is updating local lows after breaking through consolidation support. The market structure is weak (bearish), and the decline may continue... Bitcoin is consolidating in a symmetrical triangle. It is within a downtrend. A breakout of support will trigger a bearish rally. If the flagship of the crypto market begins to fall, altcoins may fall even lower. For SUI, within the D1 timeframe, there is potential for a fall to 1.3148 - 1.1163. SUIUSDT has a weak market structure: a downtrend, declining highs, updating local lows, breaking through consolidation support. If the bears keep the price below 1.4154, the altcoin's decline may continue towards the liquidity zone at 1.326 Resistance levels: 1.4154, 1.457, 1.4977 Support levels: 1.326 Bulls are not yet ready to make an effort to change the trend. The market is under selling pressure. Keeping the price below 1.4154 after breaking through the level could trigger further sell-offs towards a double bottom... Best regards, R. Linda!
RLinda
GOLD → Long squeeze support could strengthen the price to 4500
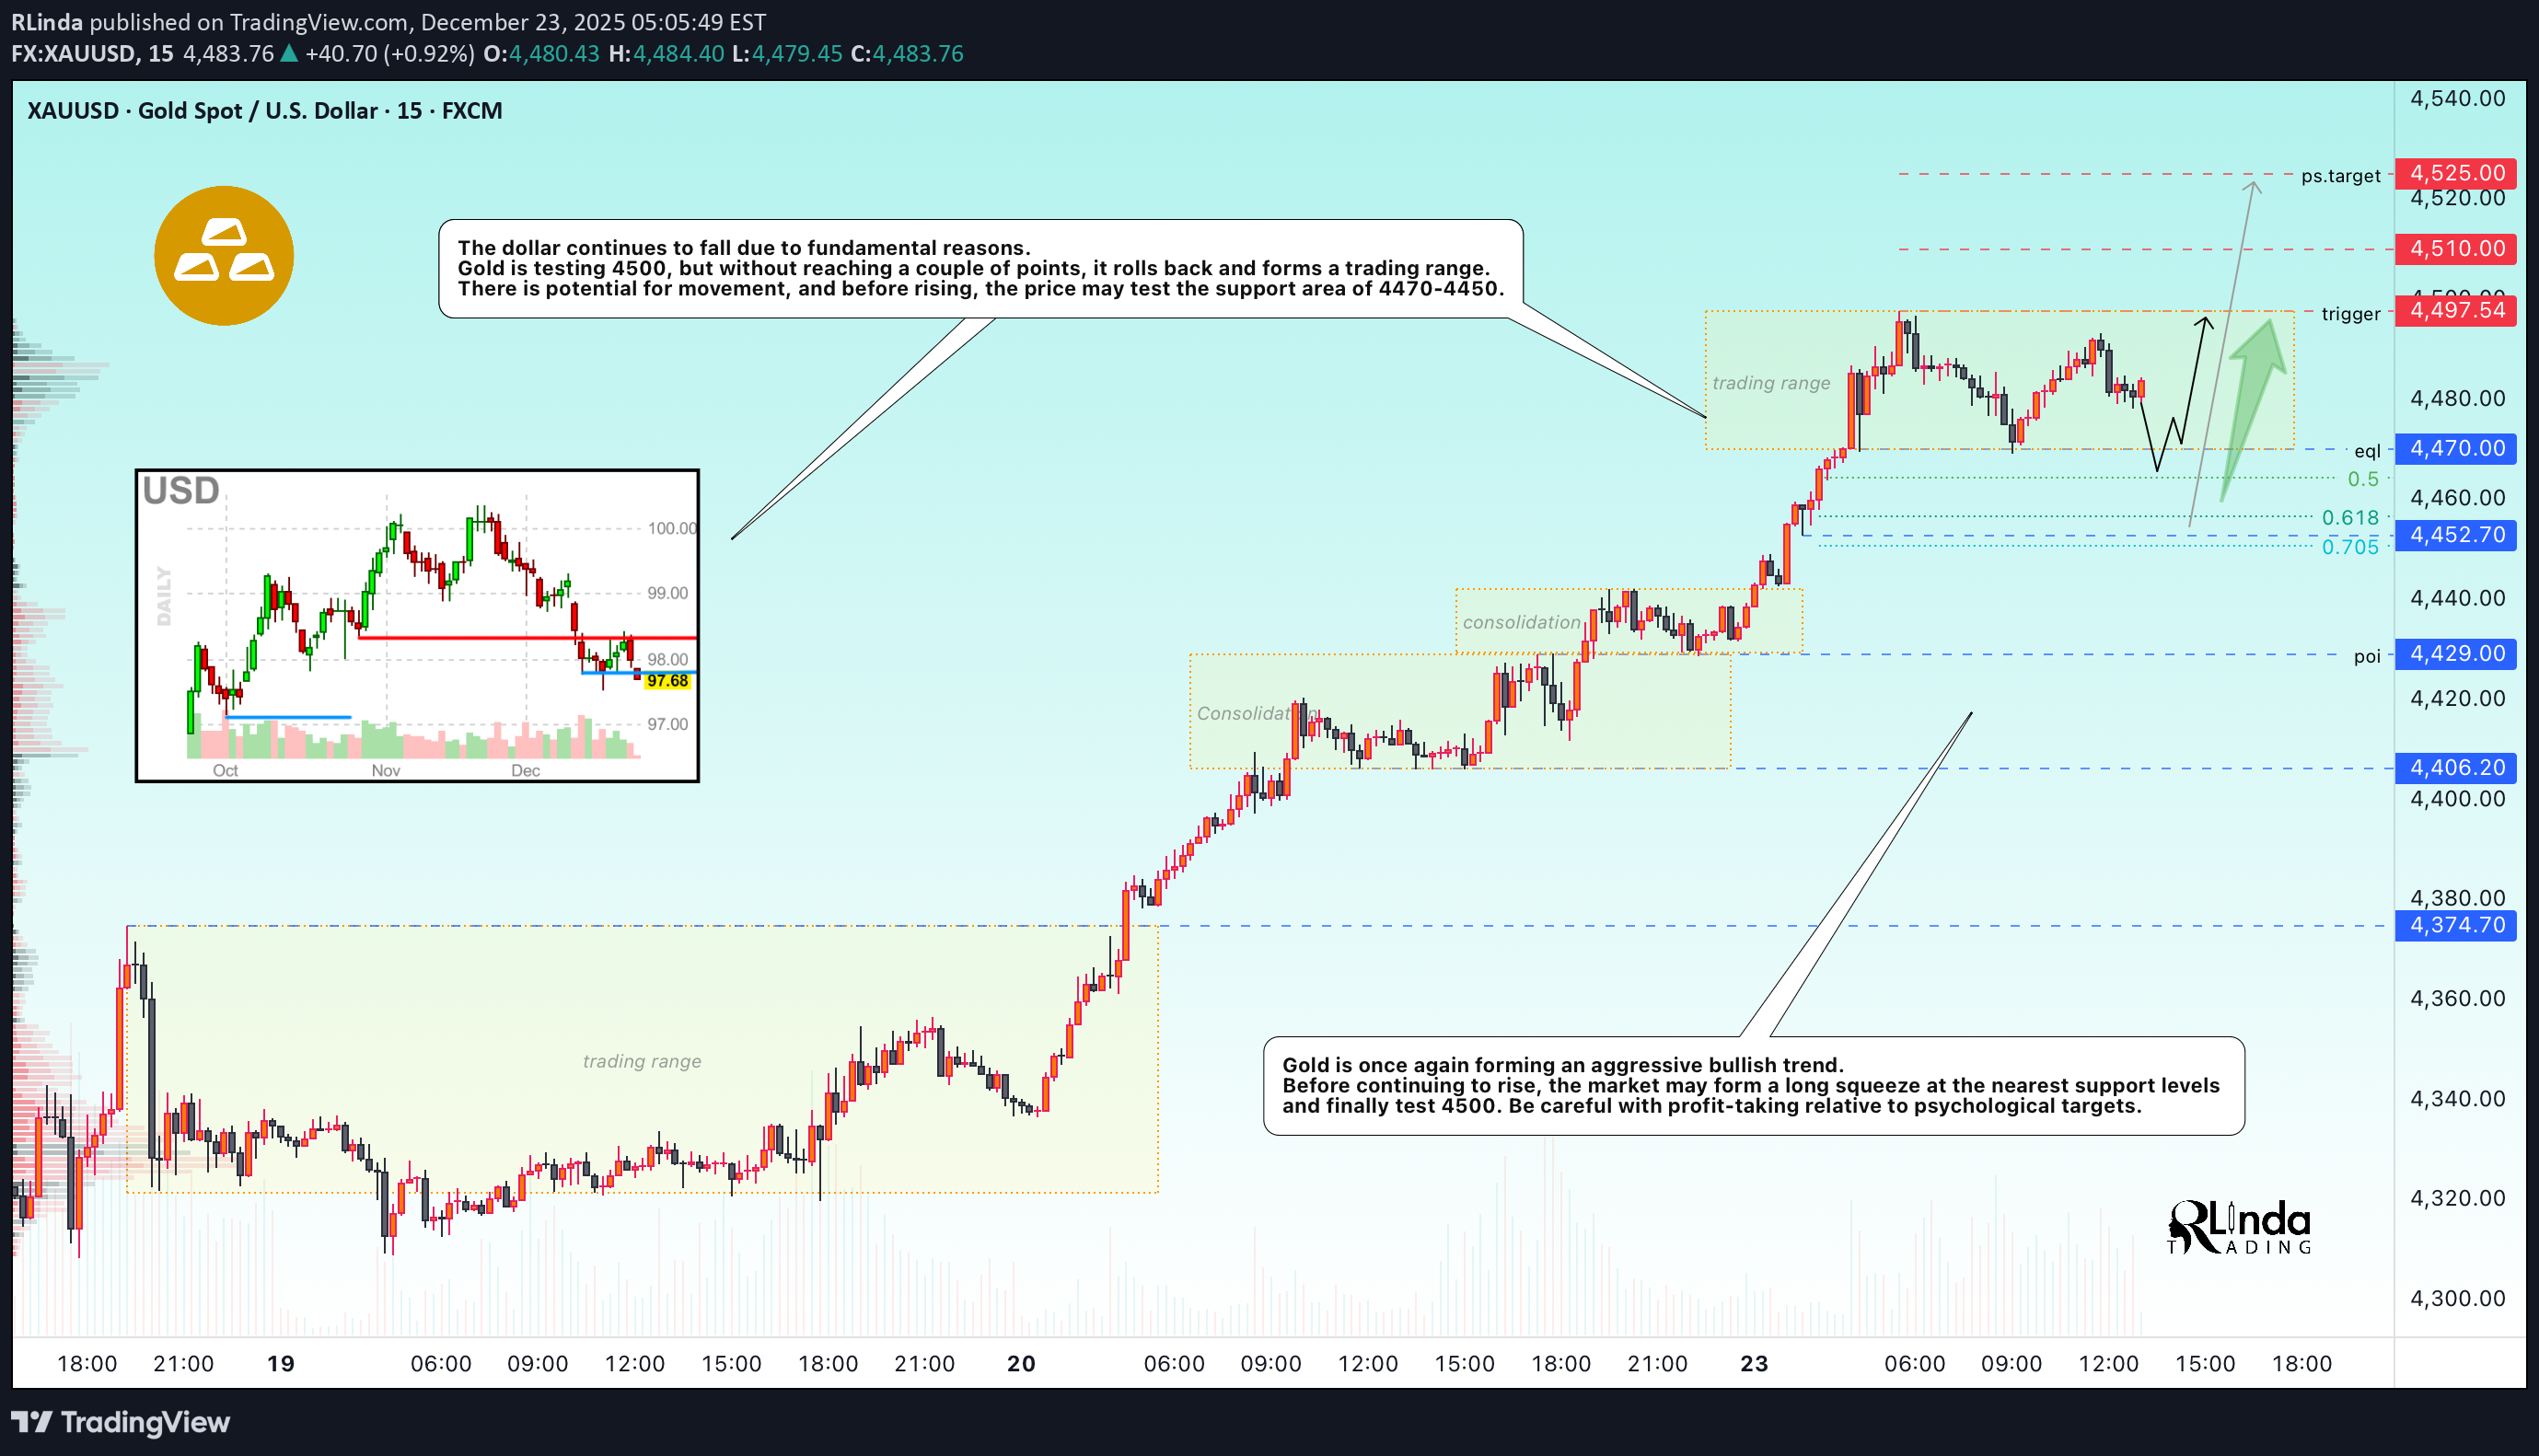
XAUUSD continues its aggressive rally. The price has reached a new high of 4497.5, leaving a small gap of $2.5 to 4500 (insurance against profit-taking???). A retest of support could renew interest in buying... Statements by US Treasury Secretary Bentsen about a possible transition to inflation targeting (instead of a fixed target of 2%) undermine confidence in the Fed's long-term policy. • The escalation of US sanctions against Venezuela (detention of tankers) and continued tensions in Ukraine and the Middle East are boosting demand for defensive assets. Today, US GDP data for the third quarter and durable goods orders are expected. Speeches by Fed members may cause increased volatility amid low liquidity (end of the year). The upward trend in gold continues, but in order to continue growing, the market may switch to liquidity hunting mode and form retests of support levels... Resistance levels: 4497.5, 4500, 4510 Support levels: 4470, 4460, 4450 The 4470 zone is a liquidity pool; a retest or long squeeze could resume the rally. However, I do not rule out that, against the backdrop of the news, gold may test 4460 - 4450 before continuing to grow. In the current situation, all attention is focused on the range of 4470 - 4500. Best regards, R. Linda!
RLinda
GOLD - We've updated ATH. What's next? A correction?
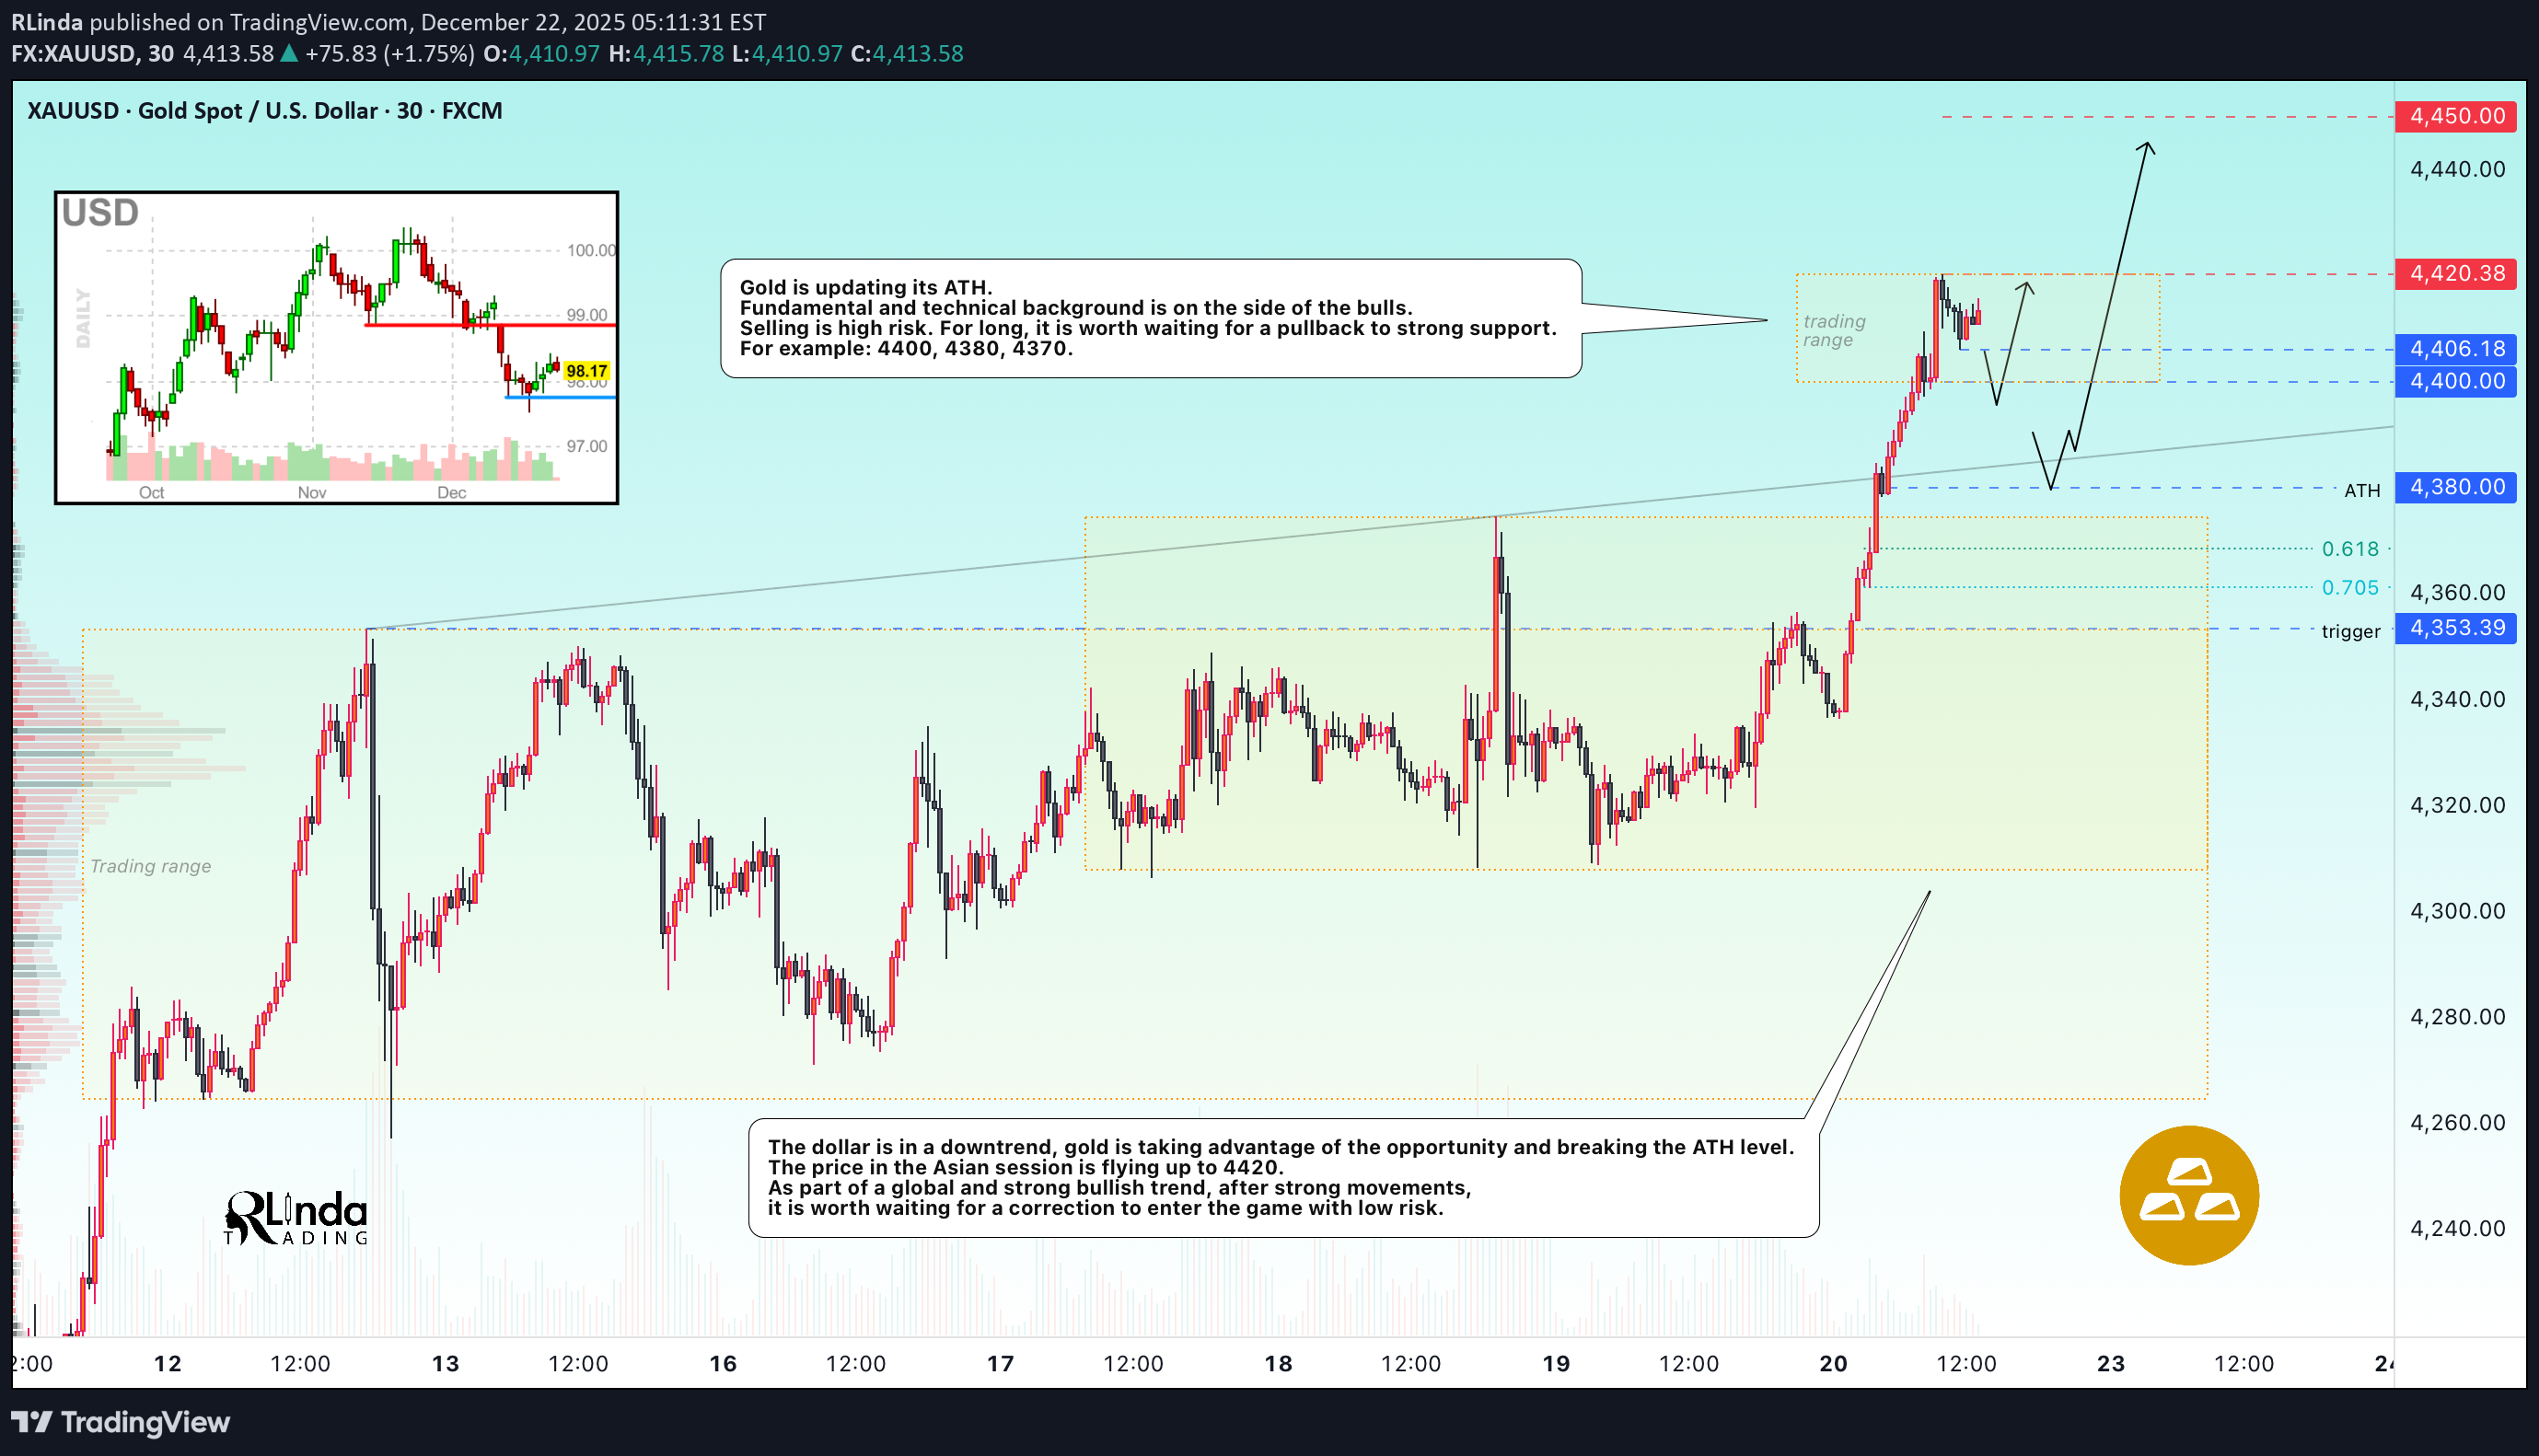
XAUUSD hit a new all-time high, approaching $4,425, for a bunch of reasons, one of which is increased interest in hedging against geopolitical risks... Fundamental situation: The US has increased sanctions pressure on Venezuela. Israel is considering options for attacking Iran's nuclear program. Russia-Ukraine negotiations show no progress. Weak US data (inflation and employment) have reinforced expectations of two Fed rate cuts in 2026. On Tuesday, US GDP data for the third quarter and durable goods orders are expected, as well as speeches by Fed members, which may adjust short-term dynamics. The combination of geopolitical uncertainty and soft monetary policy continues to support the upward trend. Resistance levels: 4420 Support levels: 4406, 4400, 4380 Any correction is likely to be limited as long as the current fundamental background remains unchanged. However, when entering the market, it is necessary to take into account the level of risk. Buying in the high zone is high risk. We are waiting for a pullback or correction to the indicated zone before making any decisions. Best regards, R. Linda!
RLinda
APTUSDT - Correction and liquidity capture before the fall
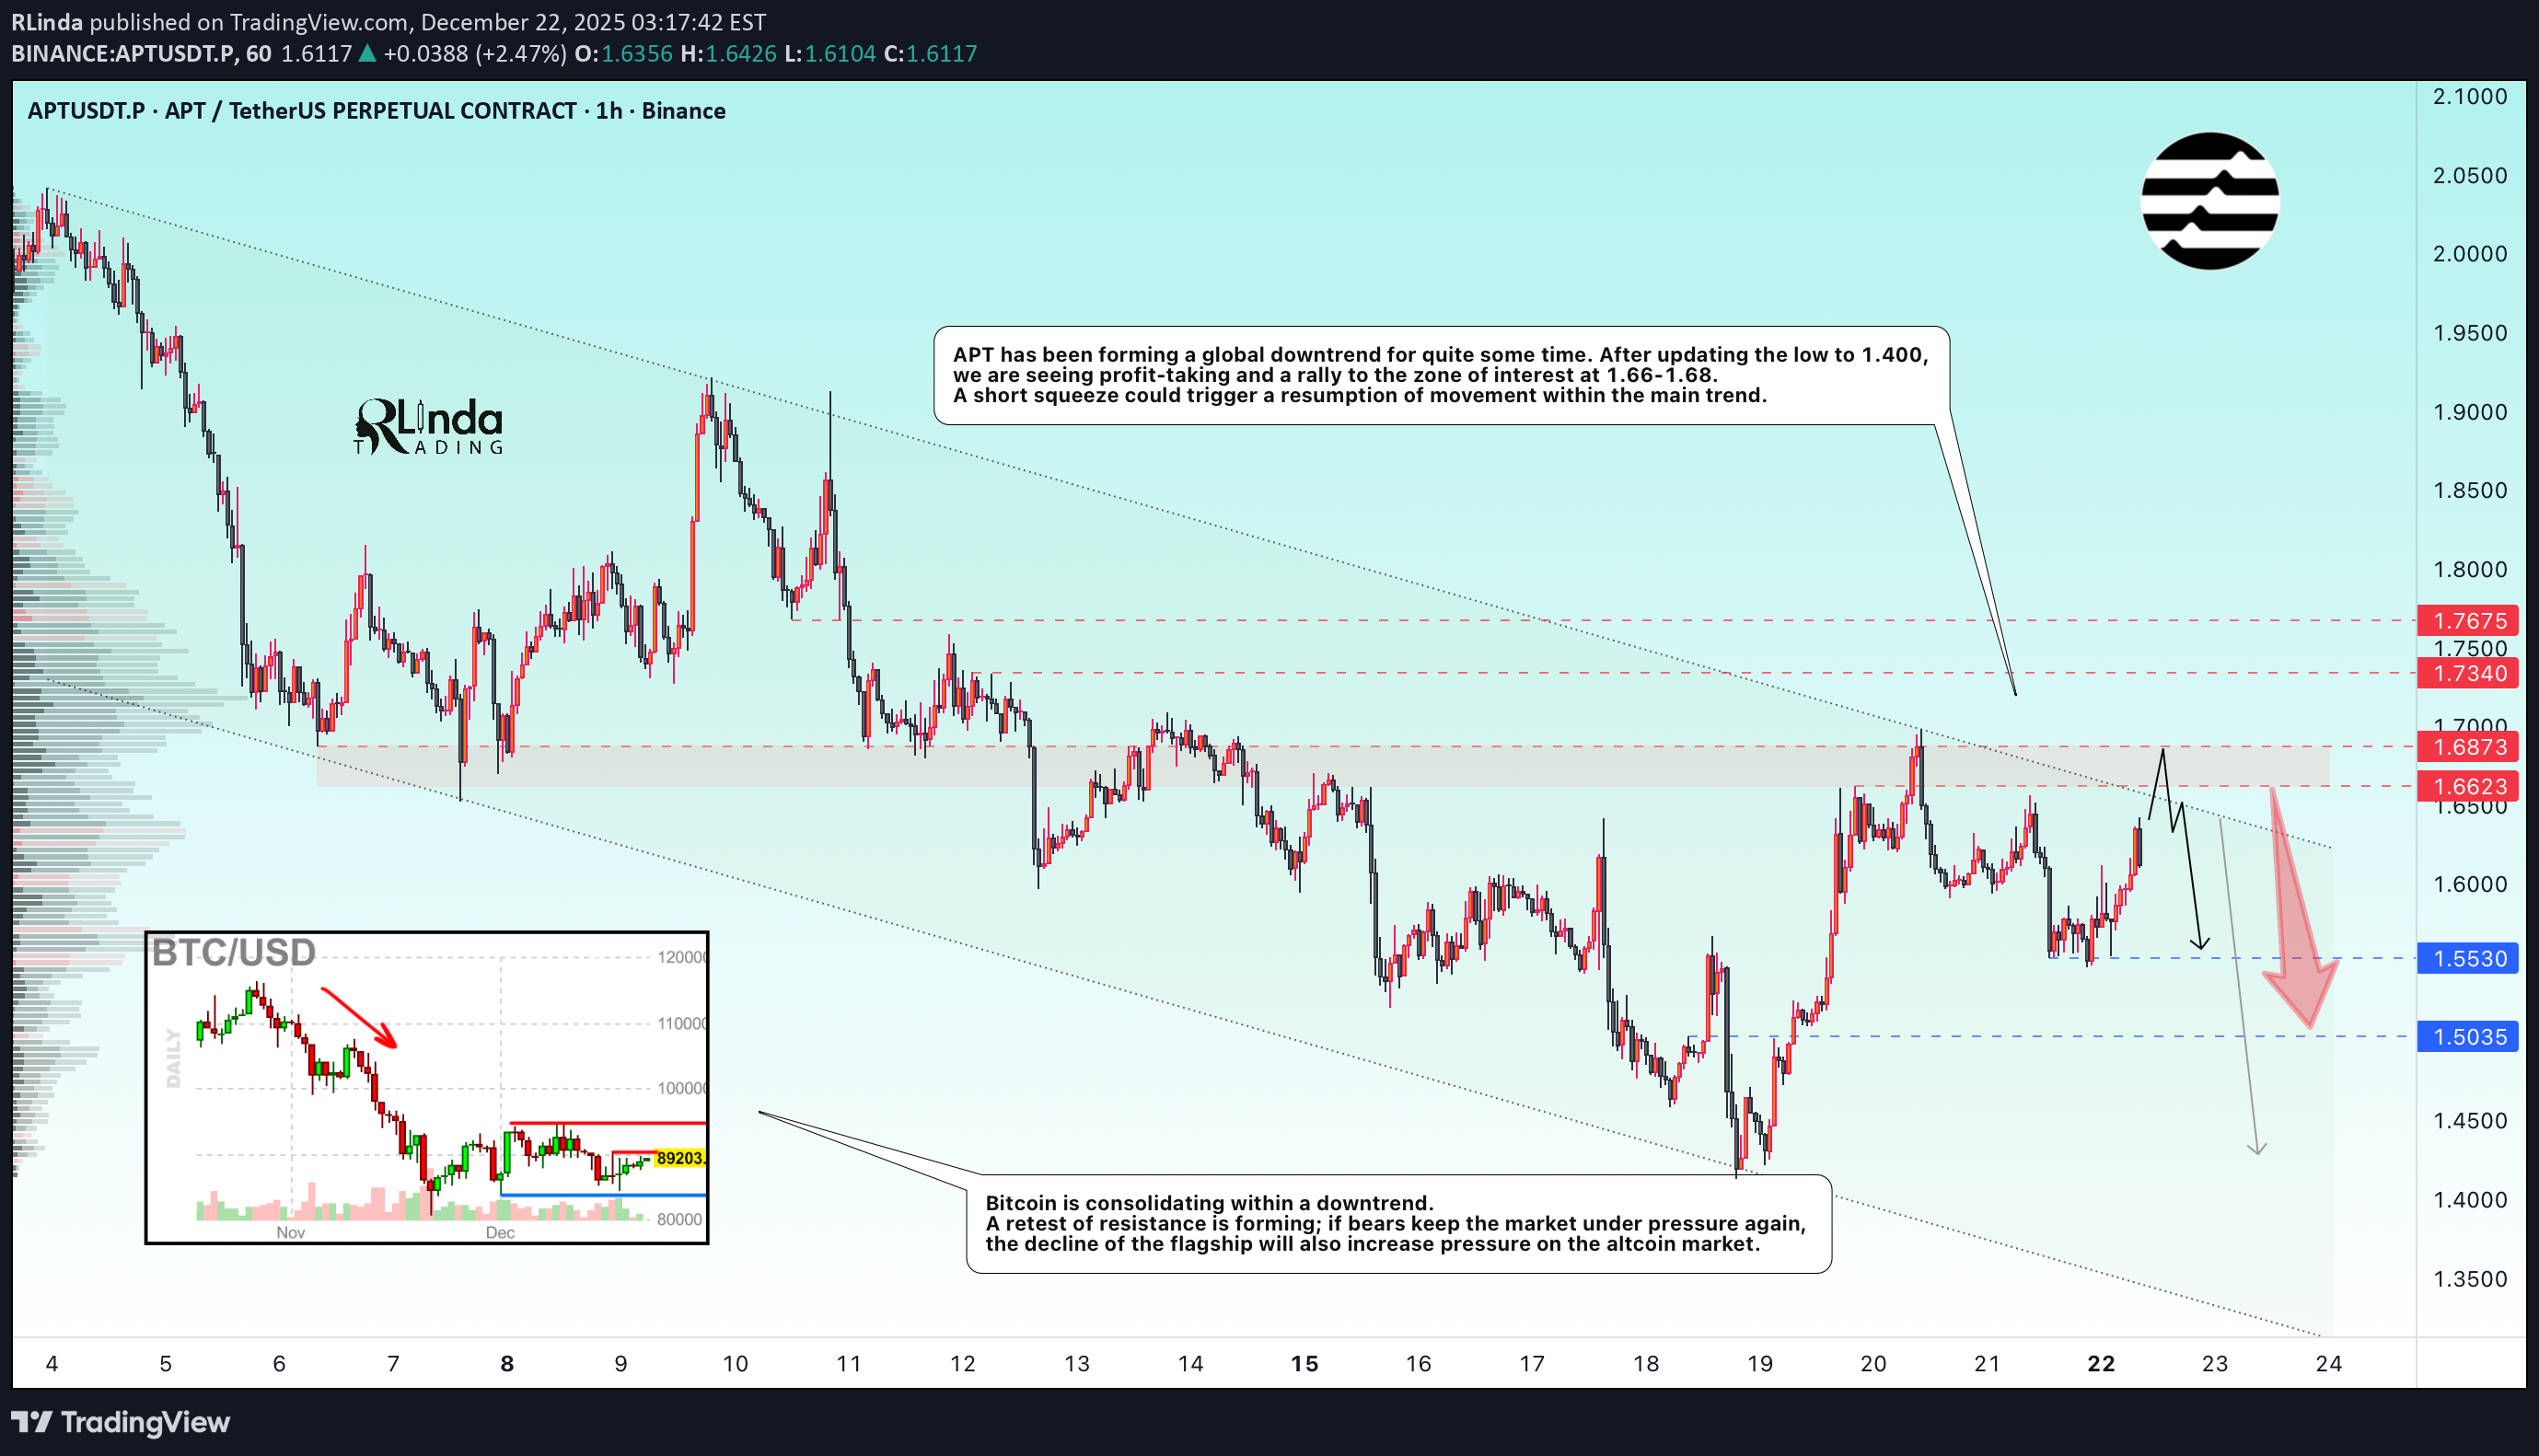
APTUSDT.P is making a countertrend move towards the zone of interest 1.66 - 1.68. Global and local trends are downward, and bearish pressure may do its job... Bitcoin is consolidating within a downward trend. A retest of resistance is forming; if bears keep the market under pressure again, the decline of the flagship will also increase pressure on the altcoin market. APT has been forming a global downward trend for quite some time. After updating the low to 1.400, we are seeing profit-taking and a rally to the zone of interest 1.66 - 1.68. A short squeeze could trigger a resumption of movement within the main trend. Resistance levels: 1.6623, 1.6873, 1.734 Support levels: 1.553, 1.5035 A retest of the specified resistance zone and the absence of bullish momentum could give us a false breakout, which in turn could trigger a reversal of the local downward movement... Best regards, R. Linda!
RLinda
بیت کوین در دام نقدینگی: آیا دستکاریها به سقوط بزرگ نزدیک است؟
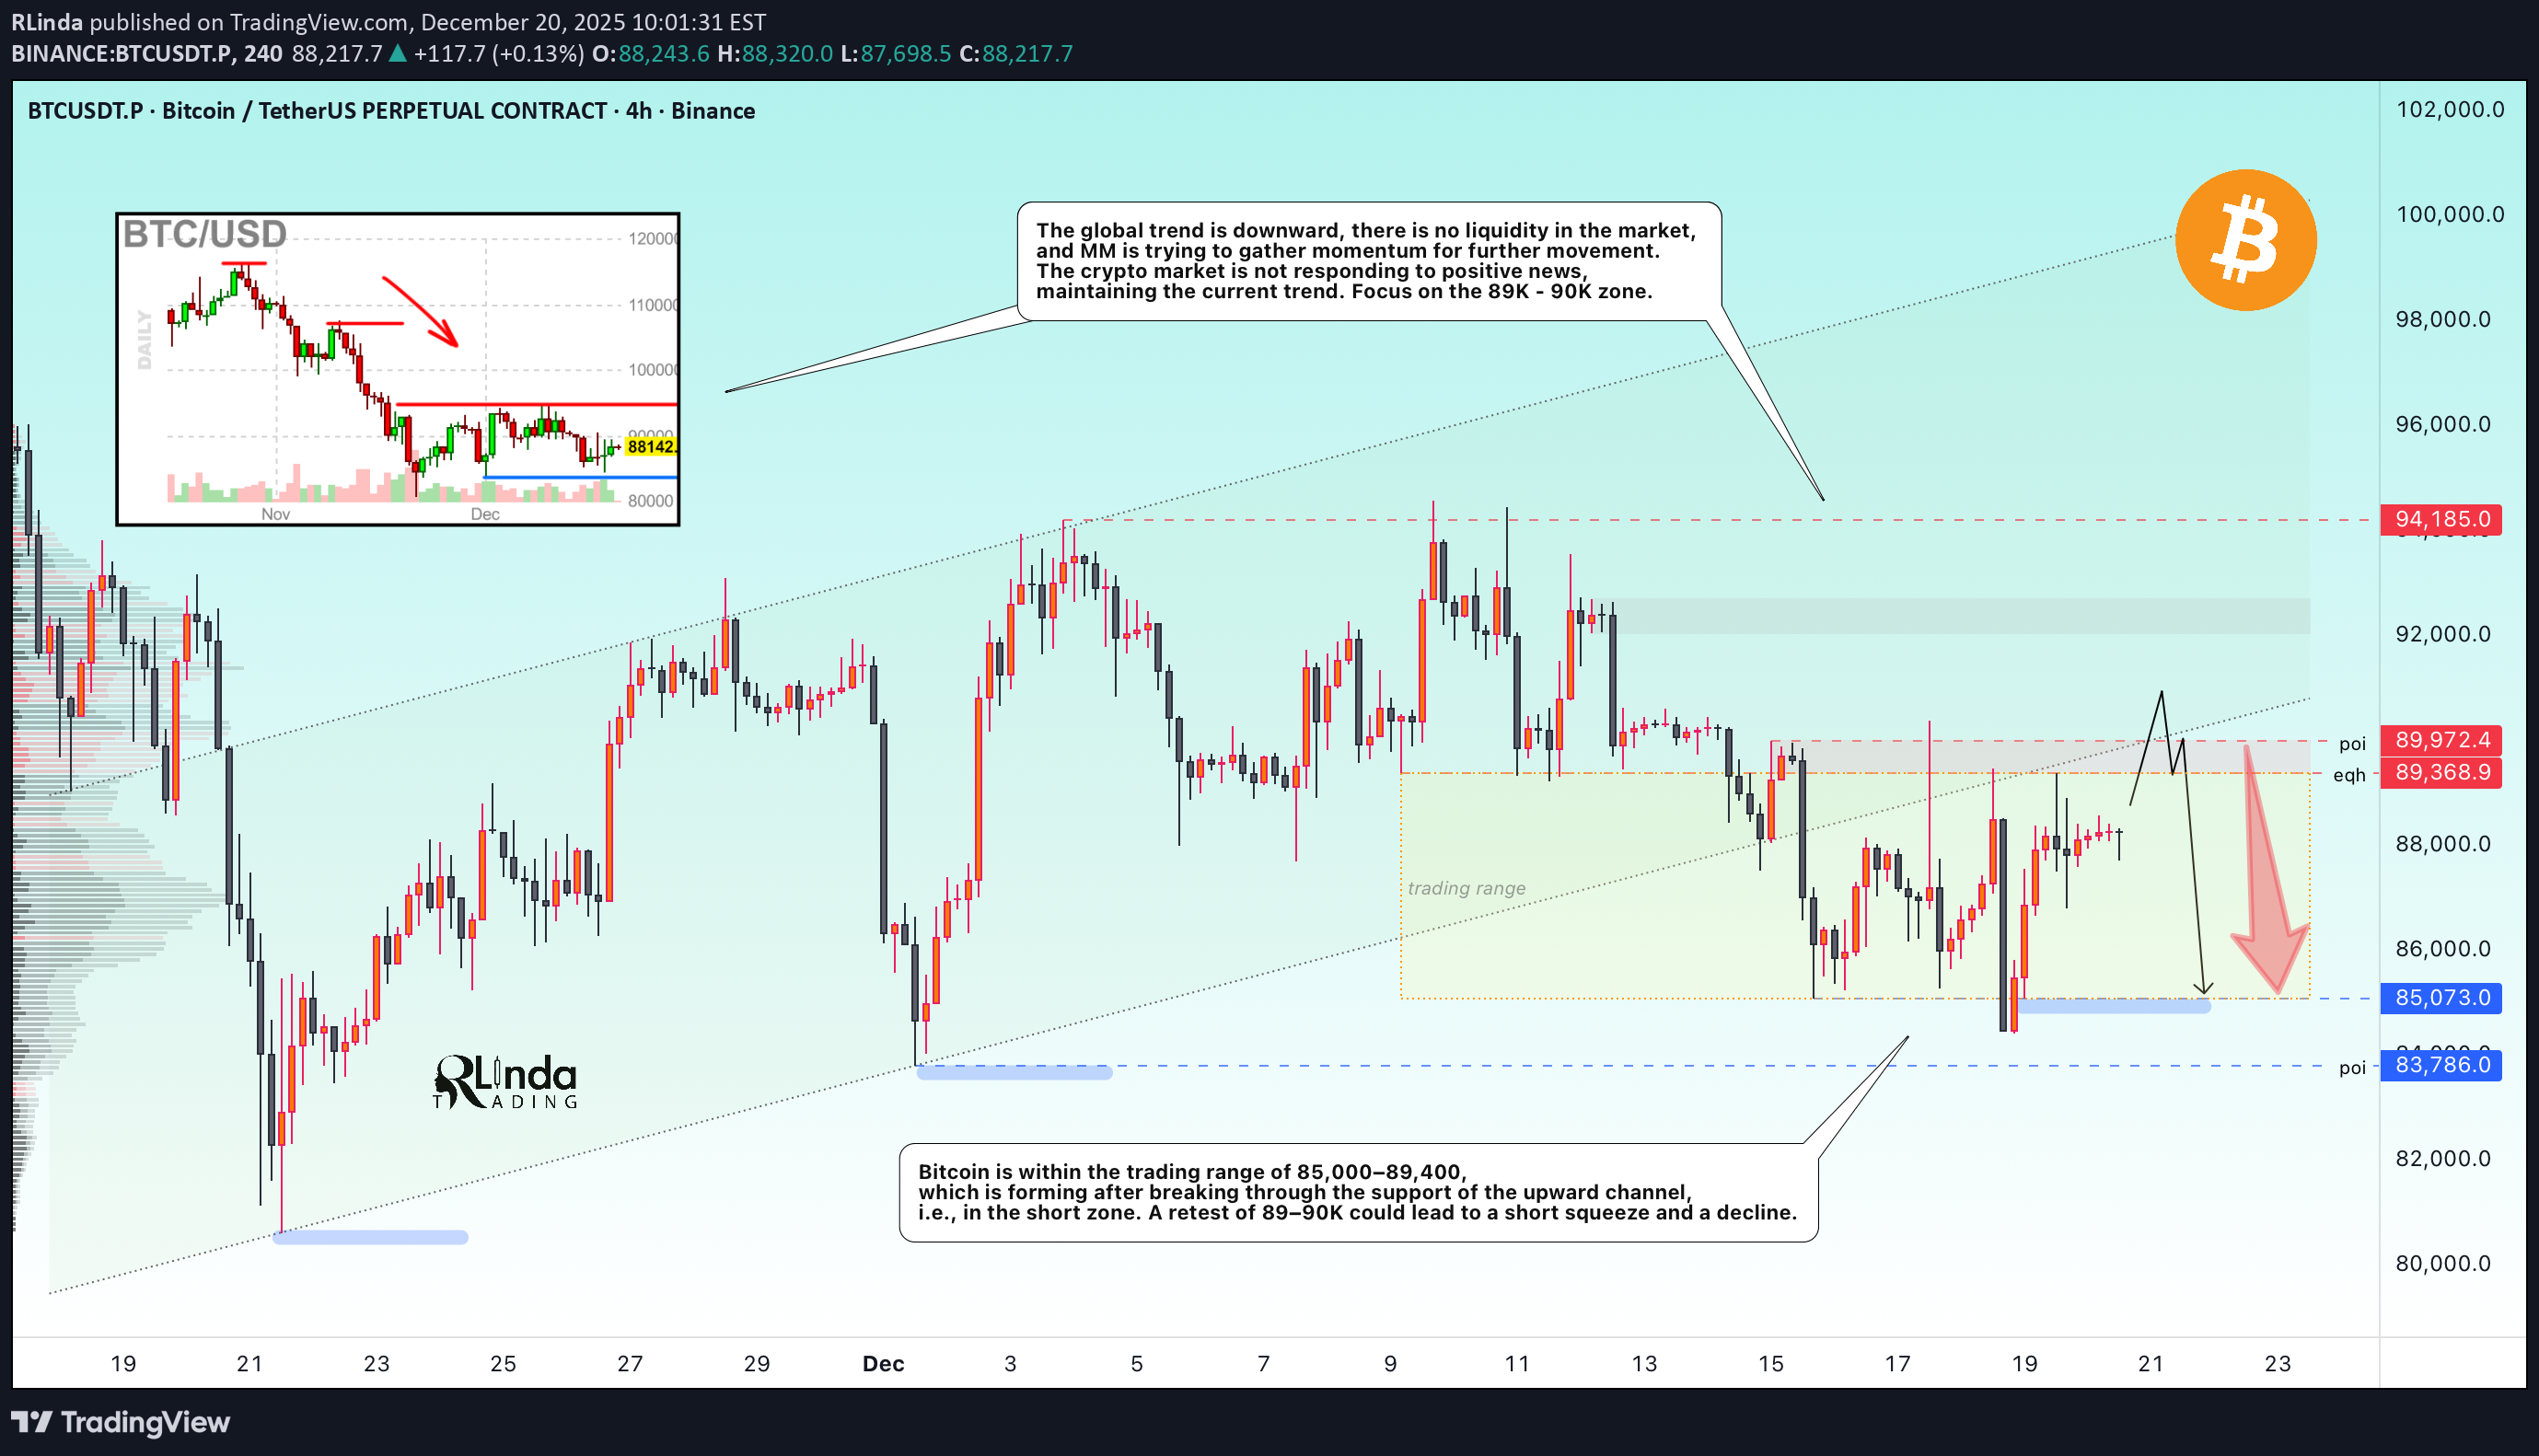
BTCUSDT.P is stuck in the range of 85K - 90K. There is no liquidity in the market, but at the same time, the downward trend continues... Earlier, we discussed such a nuance as the breakdown of support for the upward local trend. The global trend is bearish, and this nuance generally indicates a weak market. In addition to this, there is no liquidity in the market: there has been no inflow of funds into the cryptocurrency market in the last few weeks, hence the current manipulations that have been taking place over the last few days. (A low-liquidity instrument is easy to control...) Technically, Bitcoin is within the trading range of 85,000-89,400, which is formed after the breakout of the support of the upward channel, i.e., in the short zone. A retest of 89-90K could lead to a short squeeze and a fall. Resistance levels: 89,400, 89,900, 90,600 Support levels: 85,000, 83,800 A short squeeze and liquidity capture relative to the specified resistance zone could trigger a further decline, provided that bears keep the market near the previously broken boundary of the upward line... Sincerely, R. Linda!
RLinda
GOLD - Consolidation amid a bullish trend. To ATH?

XAUUSD , after retesting its ATH (to the 4375 zone), is falling amid weak US inflation data. The dollar is strengthening, but despite this, gold is in a bullish trend. US inflation (CPI) for November was lower than expected, but Trump's statements about the future “dovish” Fed chair are limiting the decline in gold. The market continues to expect the Fed to ease policy in 2026. Today, data on the US consumer confidence index will be released. Short-term pressure remains, but the fundamental background does not allow us to talk about a trend reversal. The market structure is bullish, but there is a magnet zone below: 4310 - 4300. MM is likely to test it before moving towards ATH and updating highs... Resistance levels: 4330, 4353, 4375 Support levels: 4308, 4300, 4291 The dollar is forming a temporary correction due to fundamental factors. A weak dollar will support gold... The 4308-4300 zone is a liquidity pool, and the market may test this area amid the dollar correction. A long squeeze could bring the market back to growth. Best regards, R. Linda!
RLinda
سولانا (SOL) در حال اصلاح خلاف روند: آیا خرسها مقاومت ۱۲۸.۹ را حفظ میکنند؟
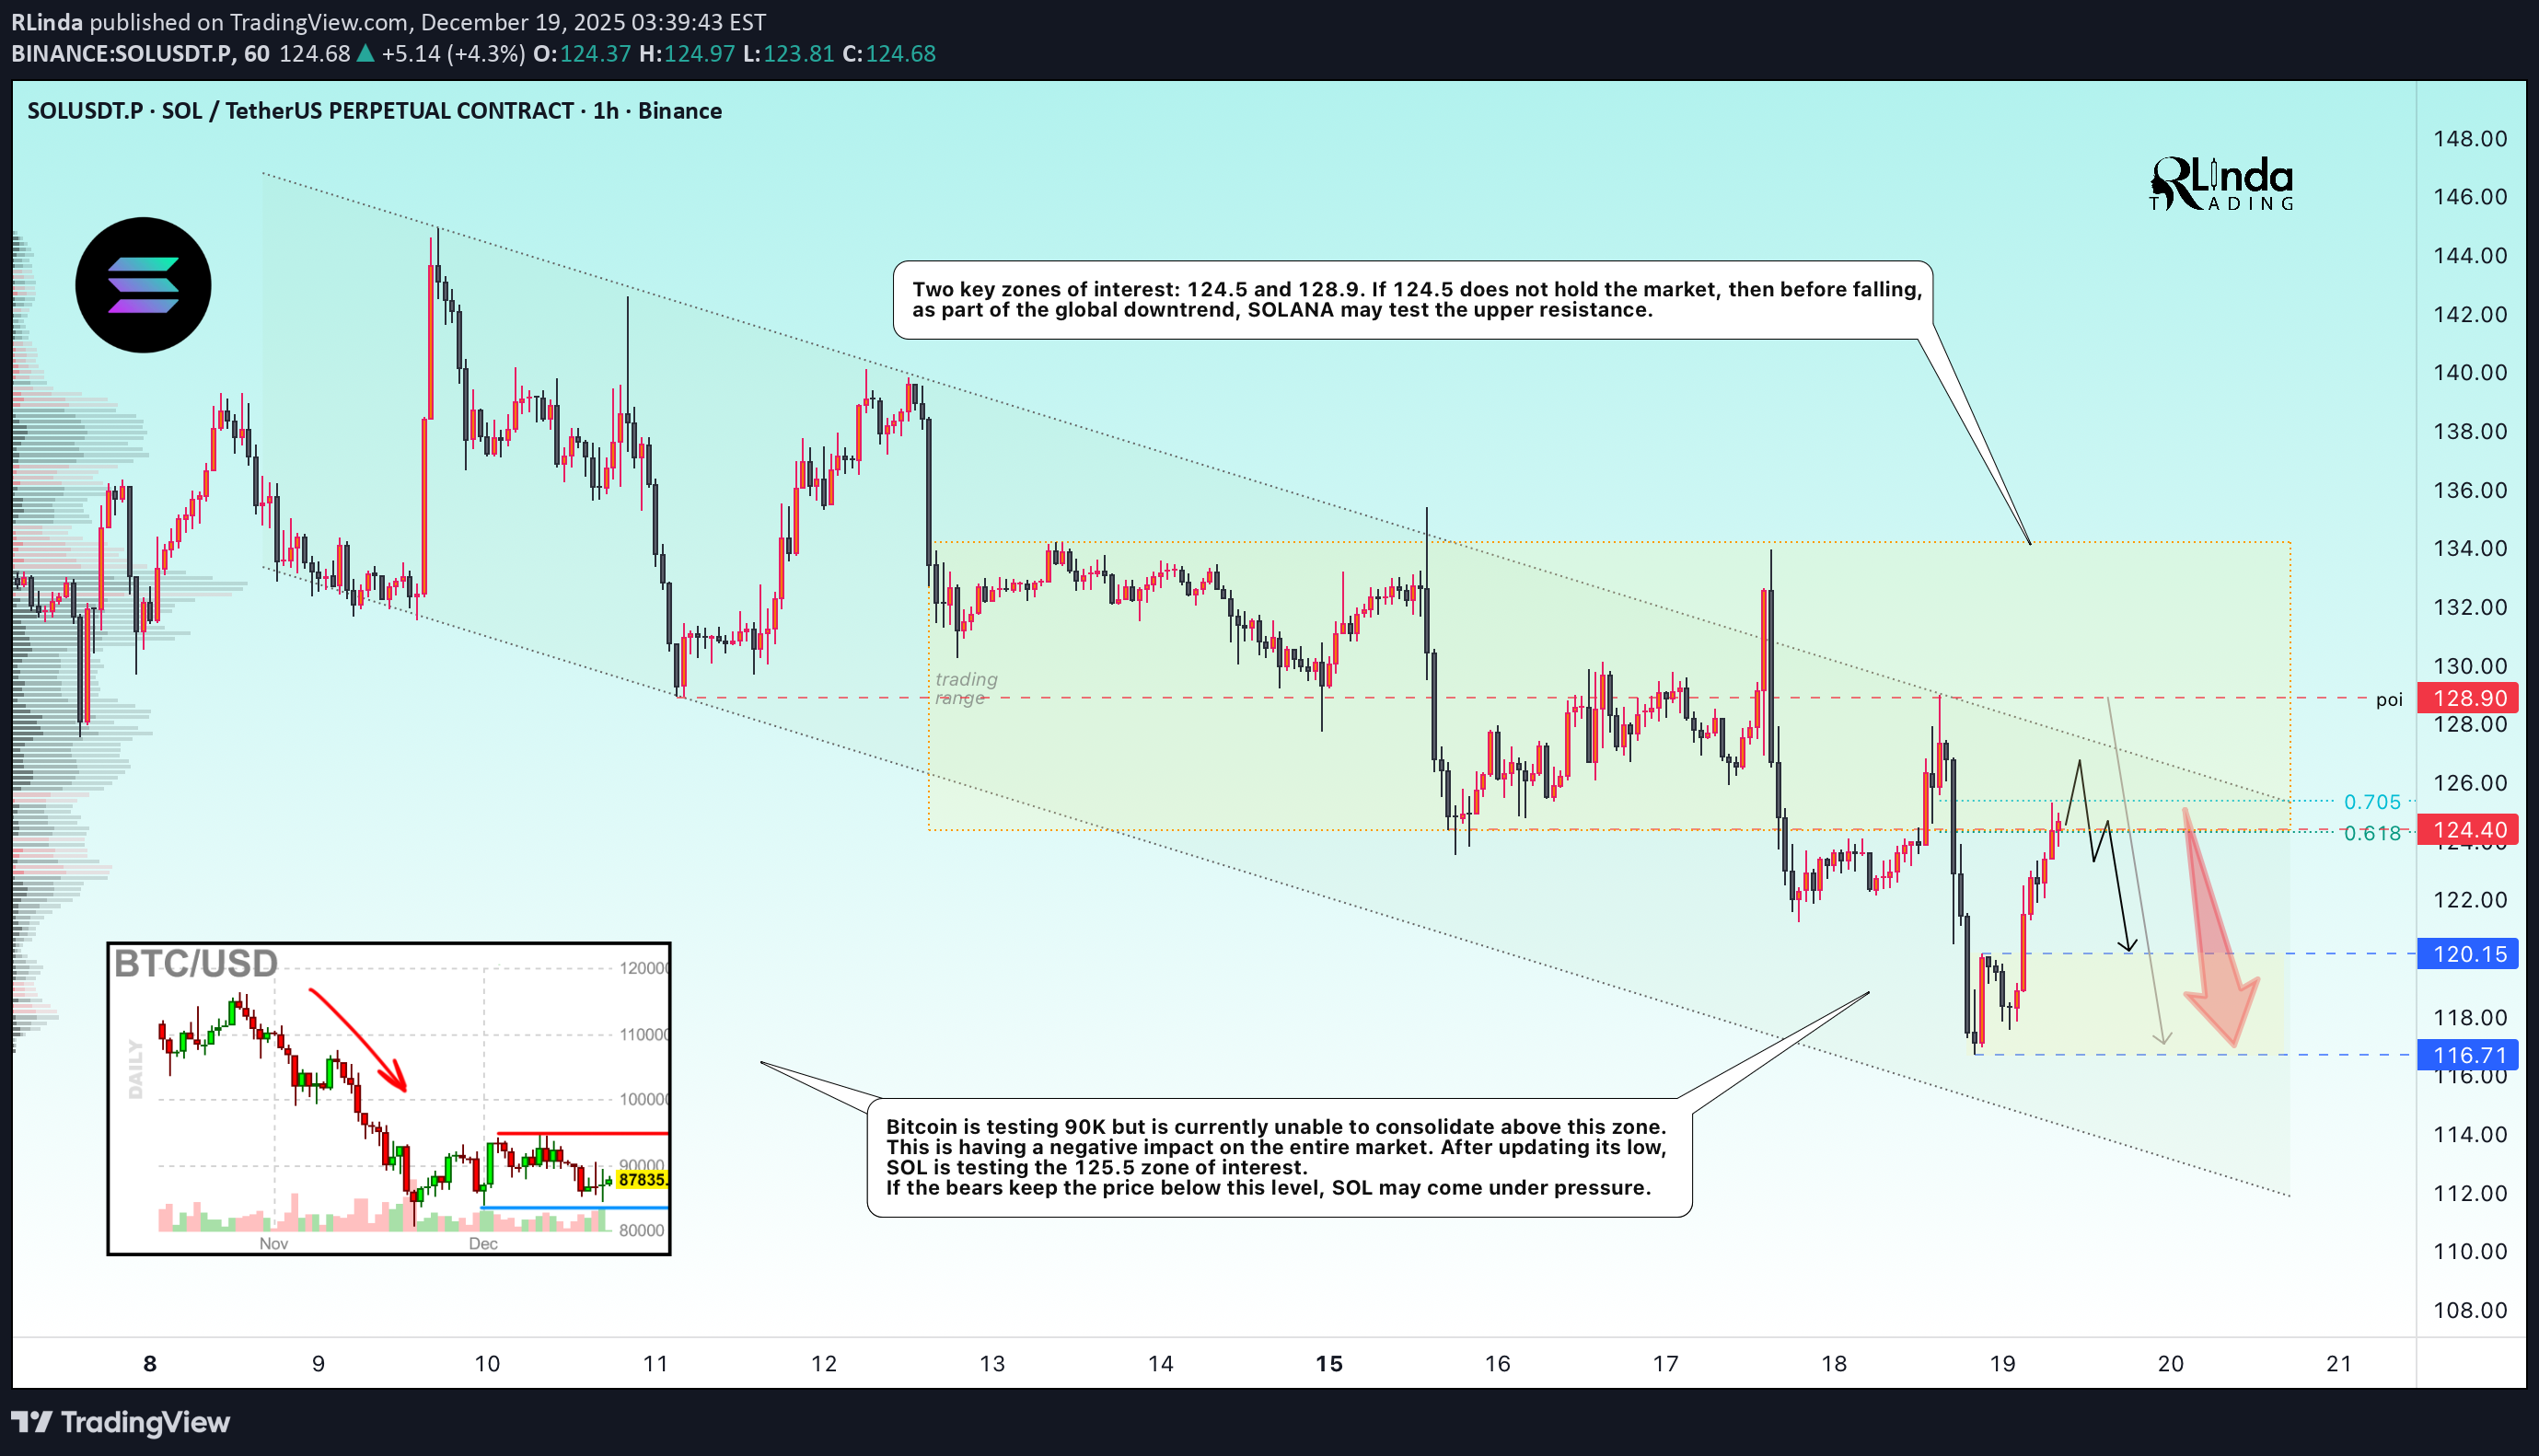
SOLUSDT , after updating its low, is forming a correction to the resistance conglomerate, but will the bears be able to hold back the upward movement? Bitcoin is testing 90K but is currently unable to consolidate above this zone. This is having a negative impact on the entire market. SOL is testing the 125.5 zone of interest after updating its low. If the bears keep the price below this level, SOL may come under pressure. Two key areas of interest: 124.5 and 128.9. If 124.5 does not hold the market, then before falling, within the global downtrend, SOLANA may test the upper resistance. Resistance levels: 124.5, 128.9 Support levels: 120.15, 116.7 Global and local trends are downward. At the moment, a countertrend correction is forming, which may be stopped in the indicated areas. A false breakout could trigger a decline. Best regards, R. Linda!
Disclaimer
Any content and materials included in Sahmeto's website and official communication channels are a compilation of personal opinions and analyses and are not binding. They do not constitute any recommendation for buying, selling, entering or exiting the stock market and cryptocurrency market. Also, all news and analyses included in the website and channels are merely republished information from official and unofficial domestic and foreign sources, and it is obvious that users of the said content are responsible for following up and ensuring the authenticity and accuracy of the materials. Therefore, while disclaiming responsibility, it is declared that the responsibility for any decision-making, action, and potential profit and loss in the capital market and cryptocurrency market lies with the trader.