
ElProfessoreXBT
@t_ElProfessoreXBT

What symbols does the trader recommend buying?
Purchase History
پیام های تریدر
Filter
$APT
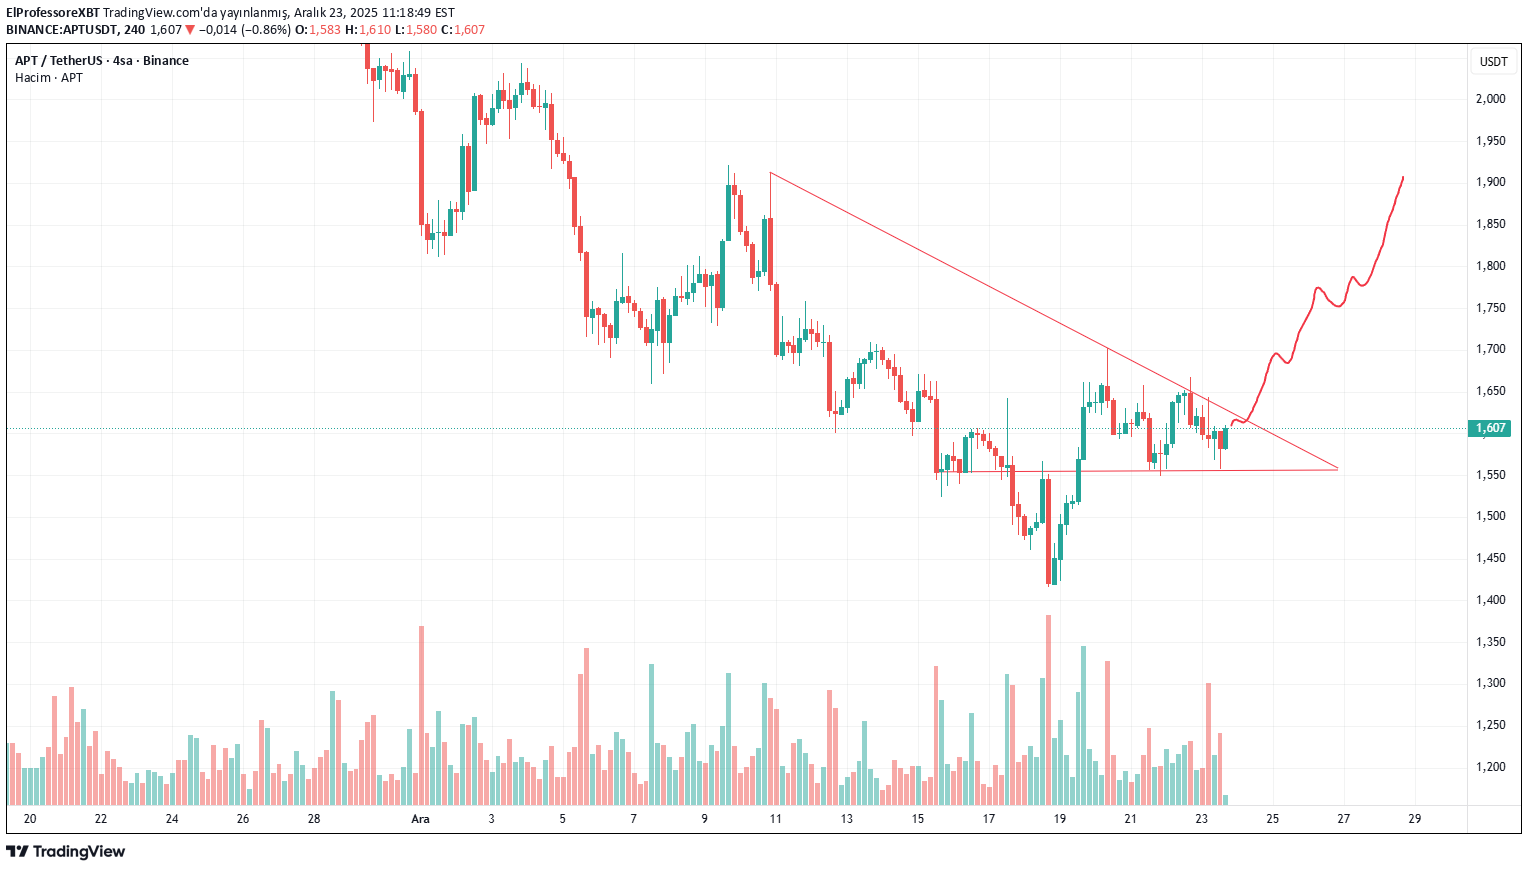
Price has been trading under a descending trendline for a prolonged period, but recent price action shows a clear loss of bearish momentum. The market is now compressing near the trendline while holding a horizontal support base, forming a classic descending triangle / compression structure. This type of structure often precedes a volatility expansion. As long as price continues to hold above the horizontal support, the probability favors a bullish breakout rather than further downside. A confirmed break and close above the descending trendline would signal a trend shift, opening the door for a strong recovery move toward the upper resistance zones. The projected path suggests higher highs and higher lows once the breakout is validated. Invalidation occurs only if price loses the support base with strong selling pressure. Until then, structure remains constructive, and patience is key while price builds energy for the next move.
$CRV X= mrprofessoreXBT
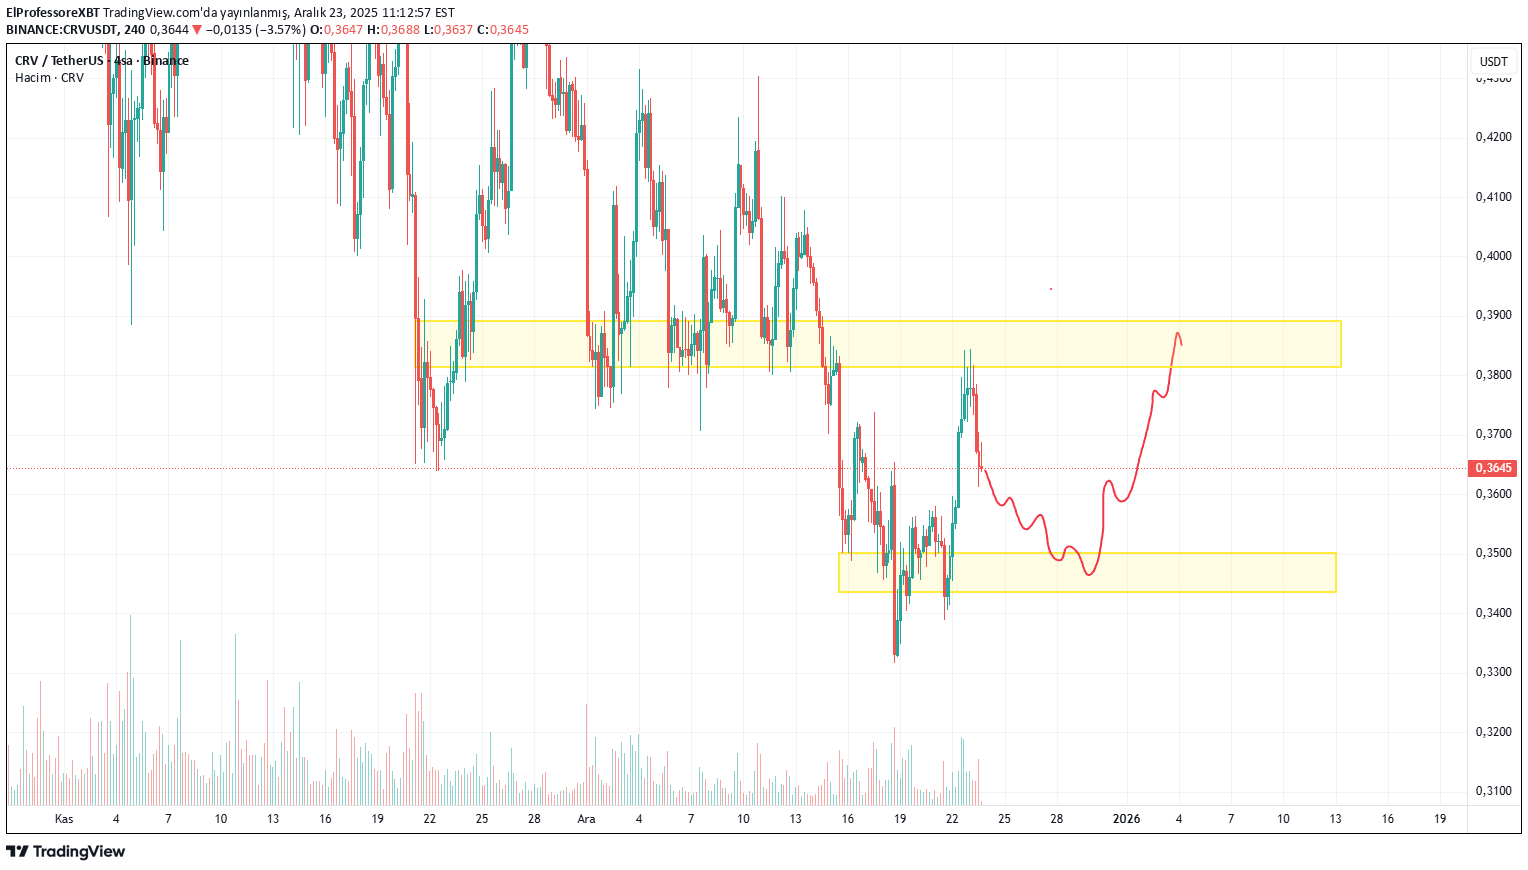
Price is currently consolidating inside a well-defined demand zone, which has already proven to be a strong reaction area in the past. After the sharp sell-off, downside momentum is clearly losing strength, and the market is now forming a base structure rather than continuing the dump. As long as this lower support zone holds, I expect range consolidation first, followed by a gradual push toward the upper supply area. The projected move suggests a potential recovery leg, with higher lows forming inside the range — a typical sign of accumulation. A clean breakout and hold above the mid-range level would likely open the door for a move toward the upper resistance zone, where sellers may step in again. Until that happens, this remains a support-based bullish scenario, invalidated only if the price loses the demand area with strong volume. Patience is key here — structure looks constructive as long as support is respected.
$ETH for more follow my X @mrprofessoreXBT

I’ve been away for a while and out of the charts, but after taking another look at Ethereum, the structure is starting to become clearer. Price has pulled back into a major support zone, right below the descending trendline. The reaction from this area suggests selling pressure is weakening and buyers are slowly stepping in. As long as this support holds, I expect downside to remain limited. In the current scenario: If price continues to hold above this support, A trendline break followed by a relief rally looks likely, With upside targets toward the previously left liquidity and resistance areas. Even if we see some short-term choppiness, my overall expectation is a gradual recovery from the bottom. This bullish scenario remains valid as long as the key support is not lost. This is my personal technical view, not financial advice.
$MOODENG
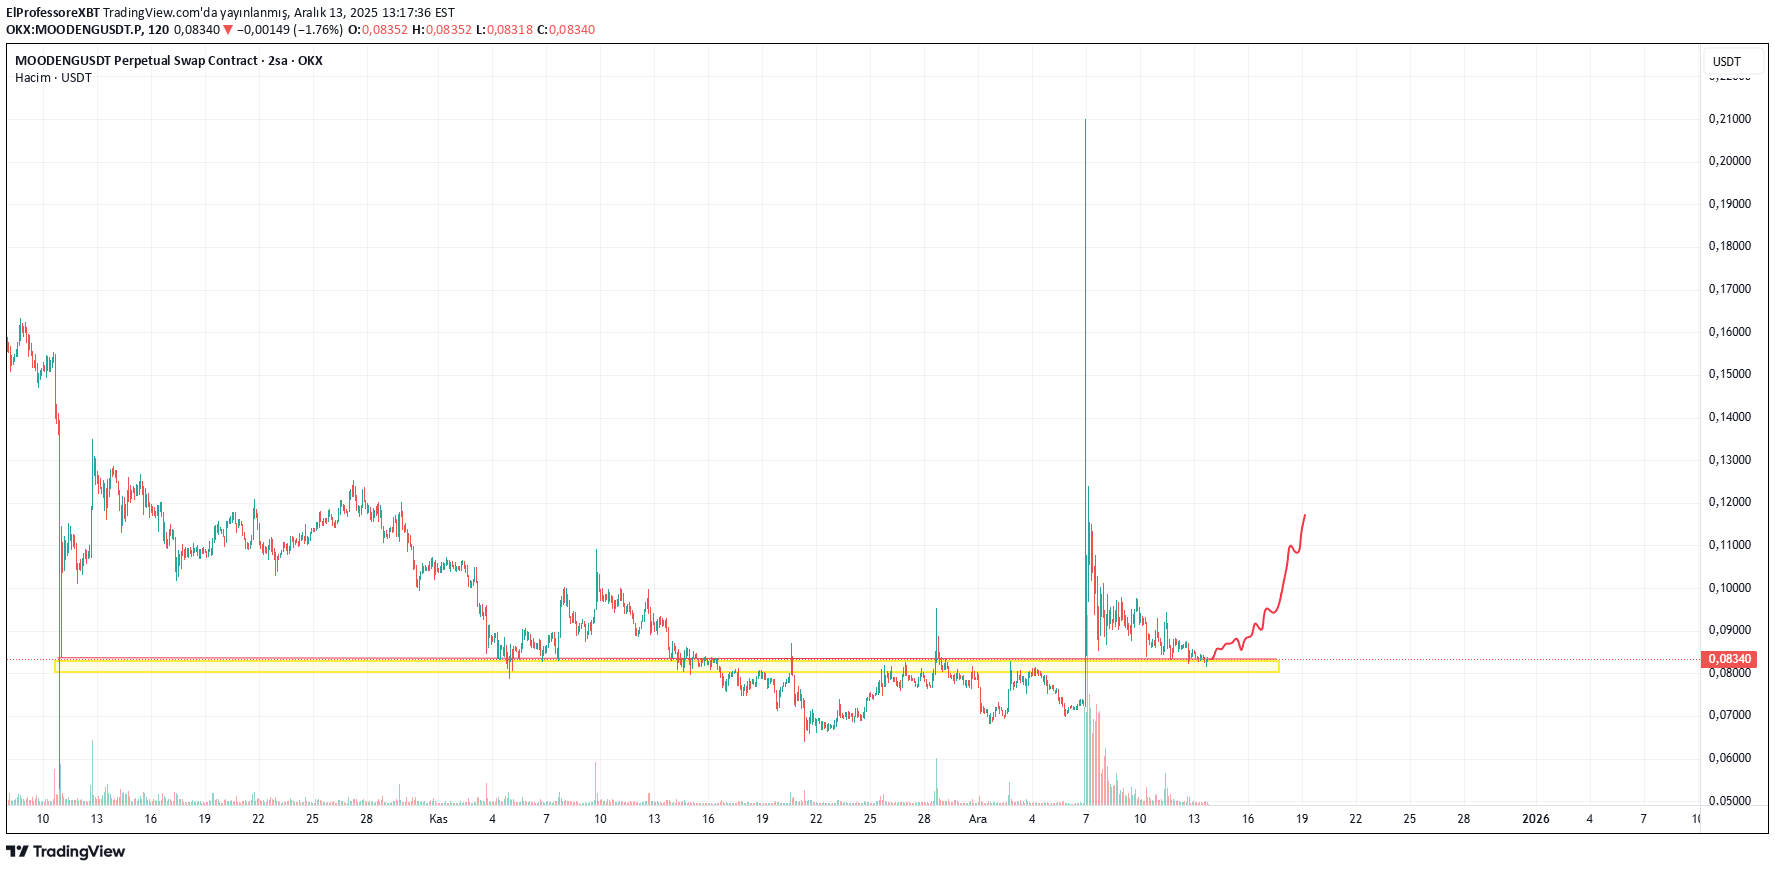
MOODENG — classic scam pump behavior, exactly as expected. After the initial hype-driven spike, price dumped hard and is now trying to fake strength around a weak support area. Low trust structure, high volatility, and obvious liquidity grabs. Any bounce here looks more like a temporary relief / exit pump rather than sustainable upside. Trade carefully — this is the kind of move where late buyers usually pay the price.
$ZEN
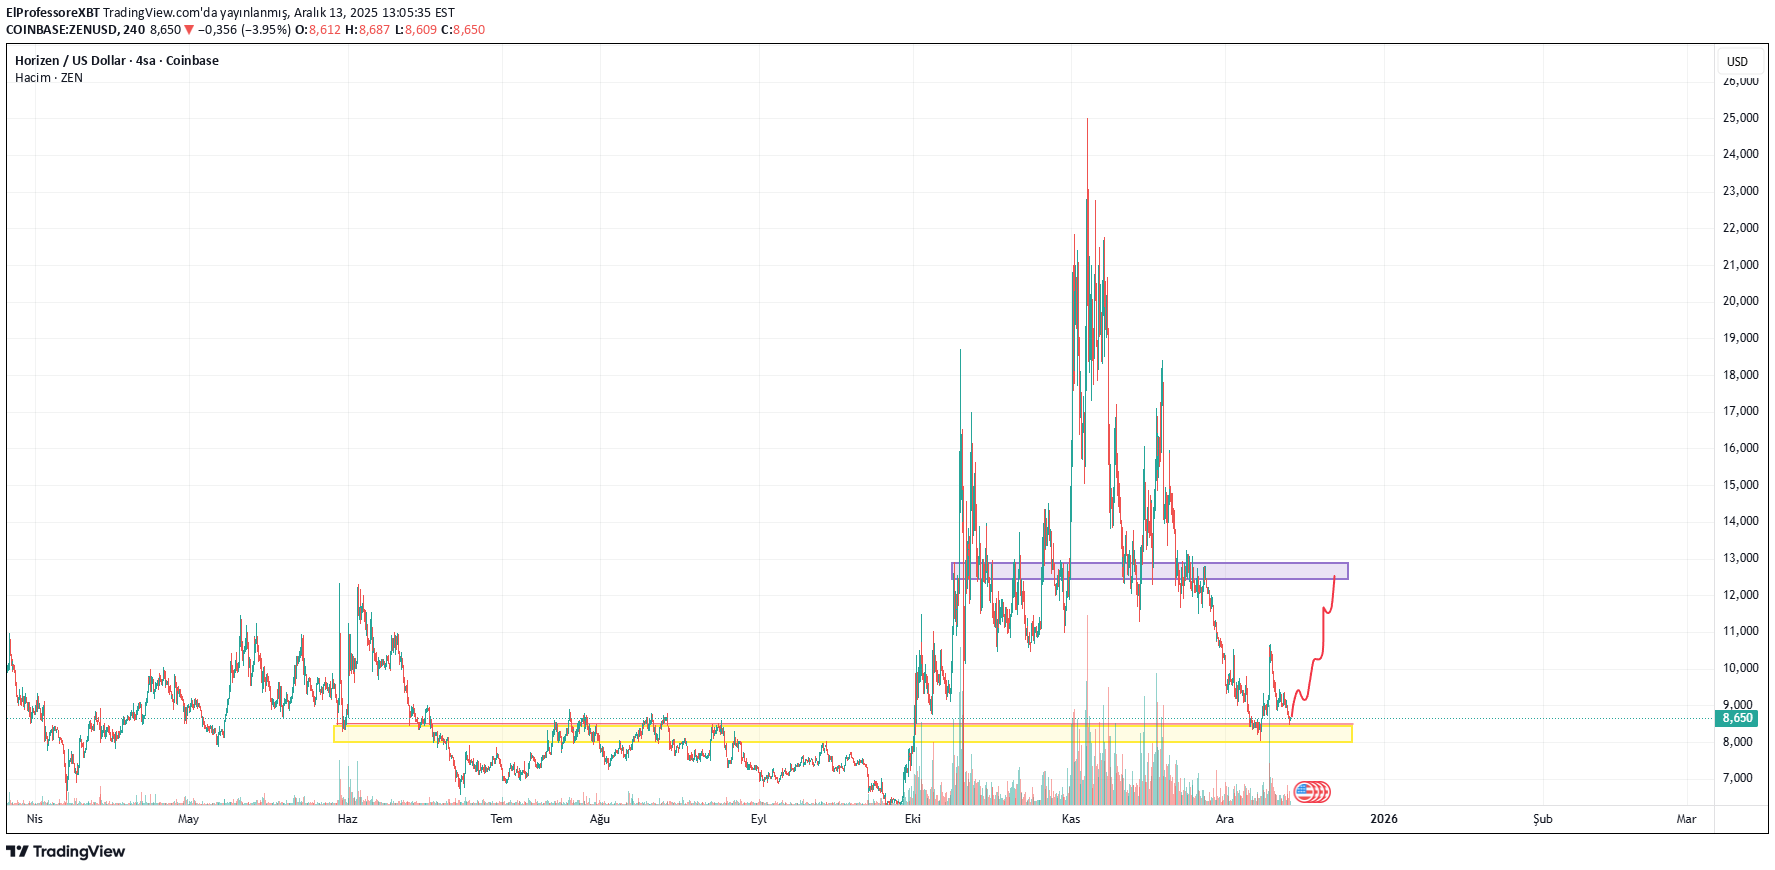
ZEN has pulled back to a major support zone after a strong upside impulse. This area previously acted as a key demand level, and price reaction here suggests buyers are stepping in again. If support holds, a relief rally toward the prior resistance zone is likely. Overall structure remains constructive as long as this base is defended.
$CRV
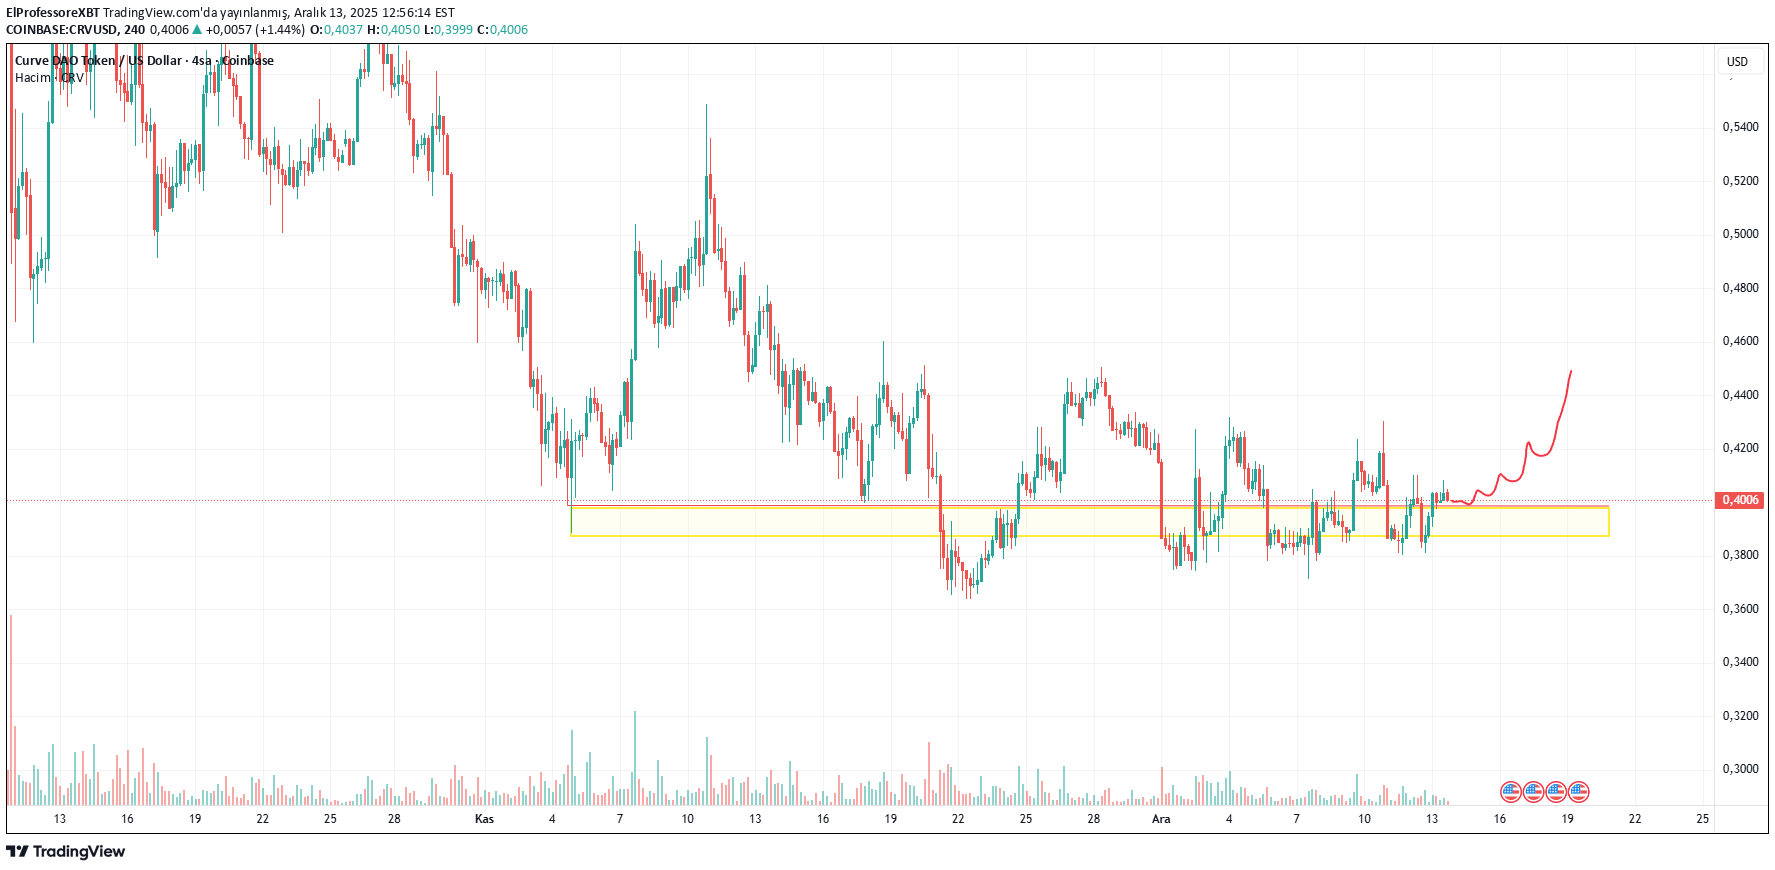
CRV is holding firmly above a well-defined demand zone after a prolonged consolidation. Price is building a base with higher lows, suggesting accumulation. A confirmed breakout above the range could trigger a momentum move toward the upper resistance levels. As long as support holds, the bias remains bullish.
$ETH
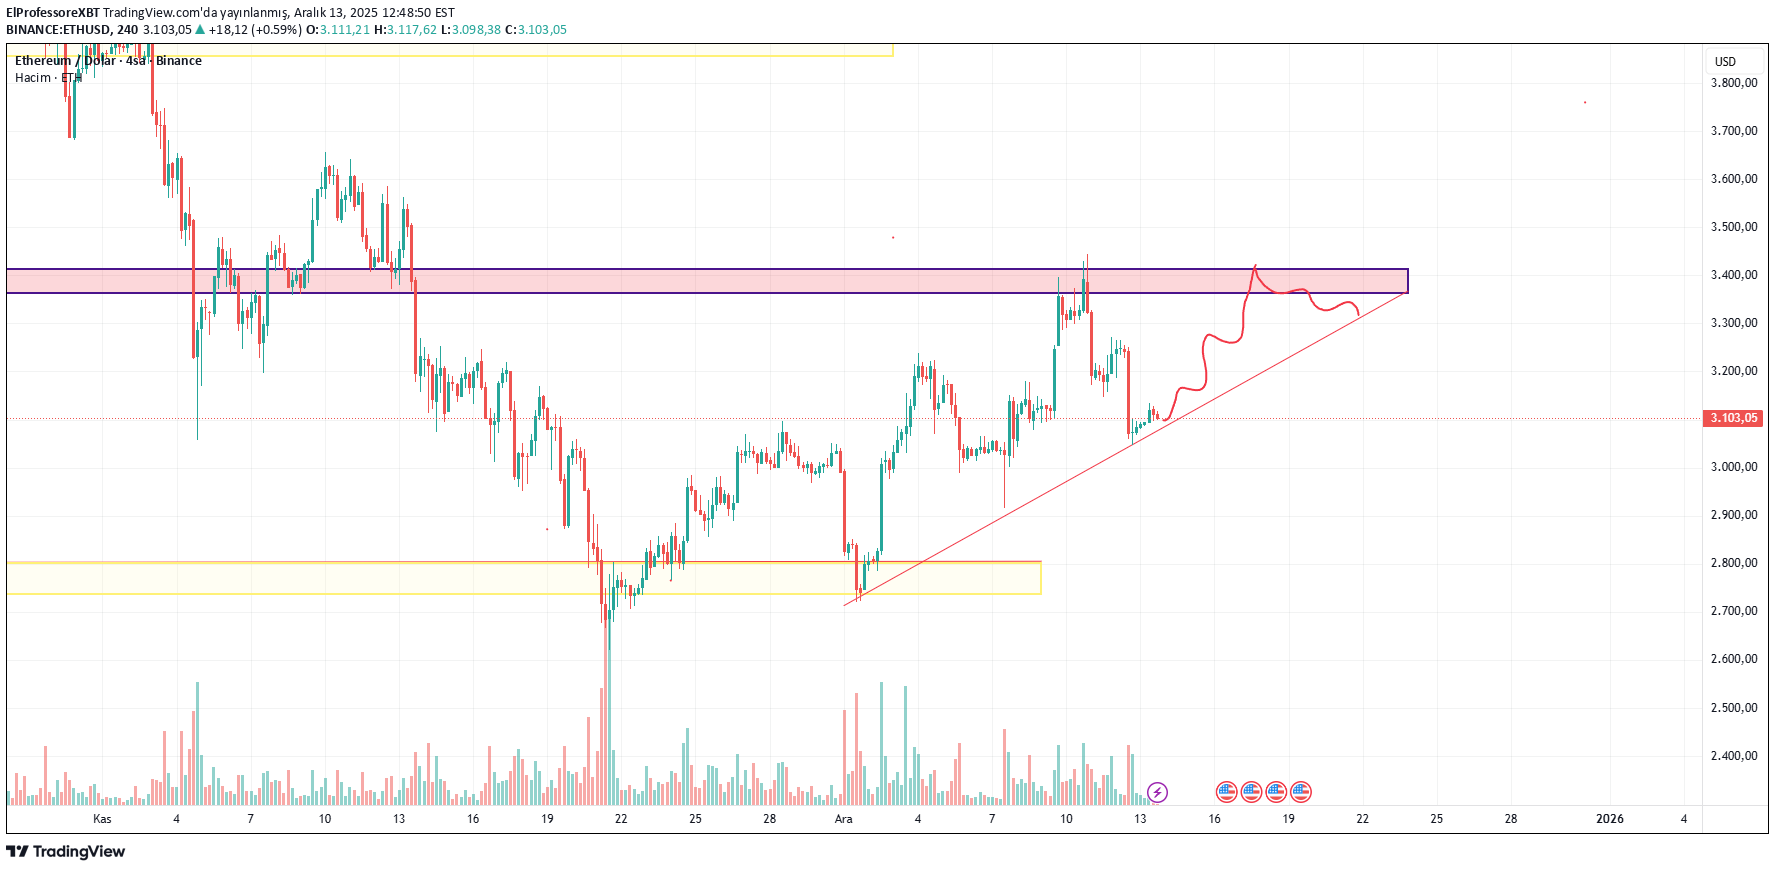
Ethereum has reclaimed the rising trendline after breaking the previous downtrend, which is a constructive sign. Price is currently consolidating above the trendline, suggesting buyers are still in control. The highlighted zone above acts as a key resistance area. A clean breakout and acceptance above this zone could open the door for a continuation toward higher levels, following the projected bullish path. As long as ETH holds above the rising trendline and does not lose the ~3,100 area, the bias remains bullish. A rejection from resistance may lead to a short-term pullback, but dips toward the trend
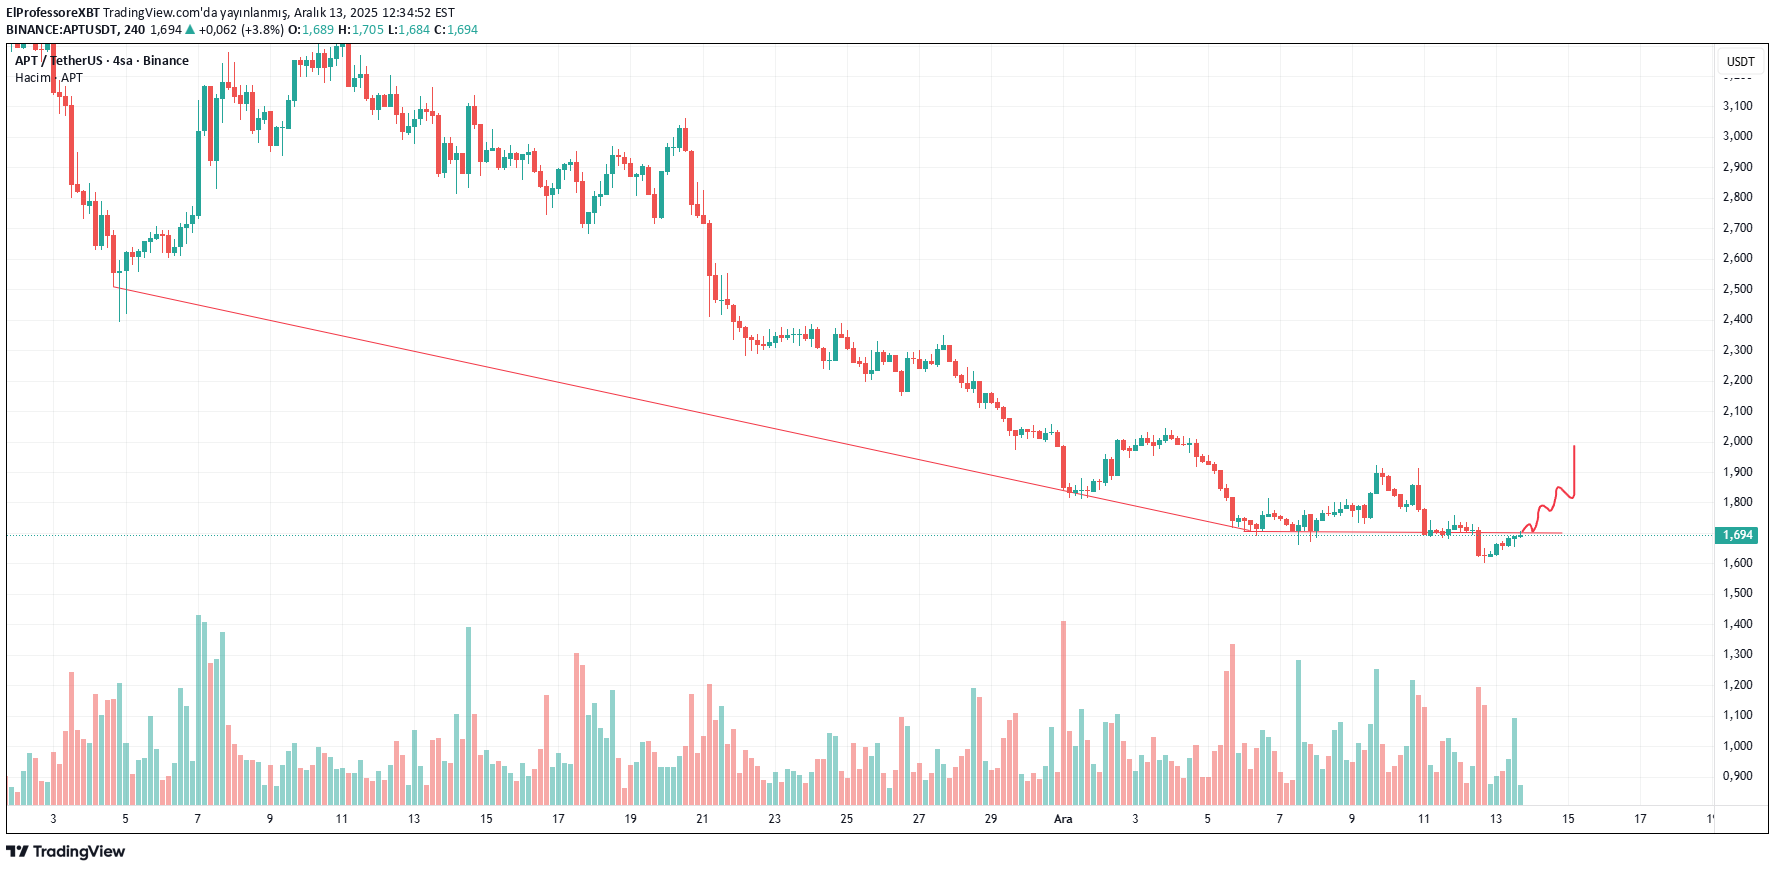
تحلیل تکنیکال APT: آیا پایان ریزش نزدیک است؟ (اهداف جدید قیمت)
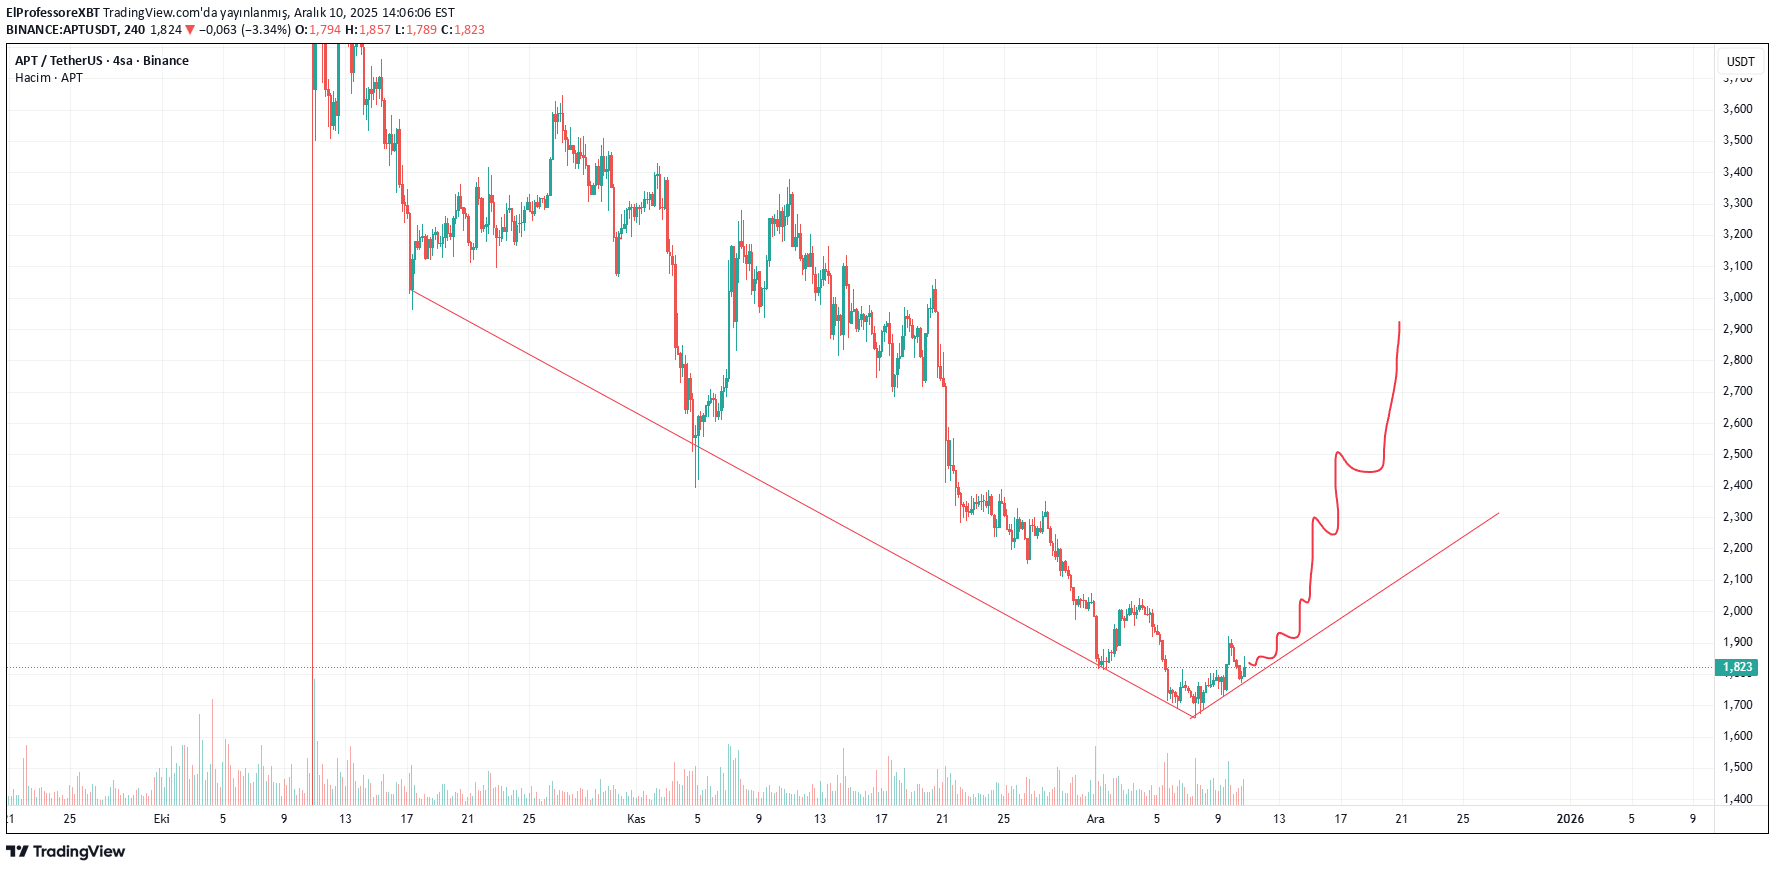
**“After a long and aggressive downtrend, the price has finally broken out of the descending trendline and is now forming a clean higher-low structure. This early shift in market structure suggests that bearish momentum is weakening, while buyers are starting to regain control. If the current higher-low trend continues to hold, a gradual move toward the 2.20 – 2.40 region looks likely, followed by a potential extension toward 2.70+. As always, confirmation is key — but the breakout combined with rising momentum makes this an important reversal area to watch.”**
Disclaimer
Any content and materials included in Sahmeto's website and official communication channels are a compilation of personal opinions and analyses and are not binding. They do not constitute any recommendation for buying, selling, entering or exiting the stock market and cryptocurrency market. Also, all news and analyses included in the website and channels are merely republished information from official and unofficial domestic and foreign sources, and it is obvious that users of the said content are responsible for following up and ensuring the authenticity and accuracy of the materials. Therefore, while disclaiming responsibility, it is declared that the responsibility for any decision-making, action, and potential profit and loss in the capital market and cryptocurrency market lies with the trader.