Technical analysis by vf_investment about Symbol APT: Buy recommendation (12/6/2025)

vf_investment
صعود انفجاری APT در راه است؟ سیگنال طلایی واگرایی صعودی در نمودار روزانه!
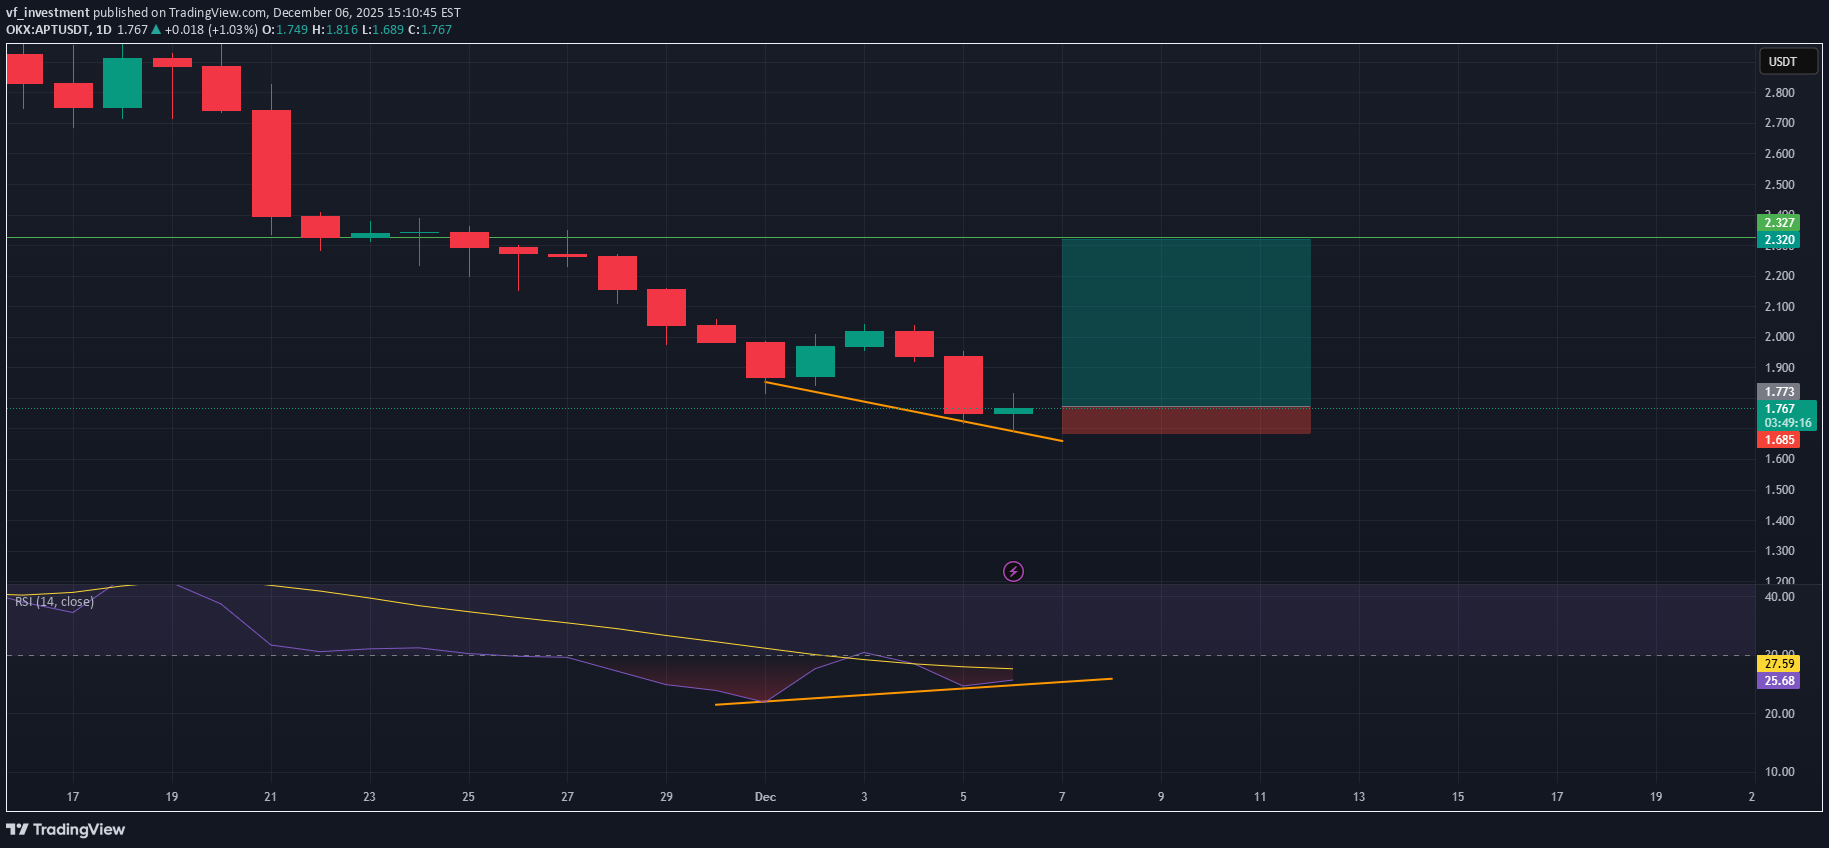
APT has been in a sustained downtrend, forming a series of lower lows on the daily chart. However, the recent price action shows a bullish divergence between price and RSI: 1. Bullish Divergence Price has made a lower low. RSI has made a higher low. This suggests weakening bearish momentum and a potential reversal or relief bounce. Both swing lows on the chart and RSI lows are highlighted and connected, confirming the divergence pattern. 2. Entry Zone The long entry is positioned just above the most recent candle after divergence confirmation. Price is currently trading near support created by the descending trendline. 3. Stop-Loss Stop-loss is set slightly below the recent swing low. This protects the position in case bearish continuation invalidates the divergence. 4. Take-Profit Target The take-profit region is placed near a previous resistance zone around 2.32–2.33 USDT, which aligns with a prior consolidation area. This provides a favorable risk-to-reward ratio. 5. Concept Behind the Trade Bullish divergence indicates sellers are losing strength. Daily timeframe divergences often lead to strong corrective moves. The setup is structured as a trend-exhaustion reversal attempt, aiming to capture a bounce back toward higher resistance.