
vf_investment
@t_vf_investment

What symbols does the trader recommend buying?
Purchase History
پیام های تریدر
Filter
vf_investment
صعود انفجاری APT در راه است؟ سیگنال طلایی واگرایی صعودی در نمودار روزانه!
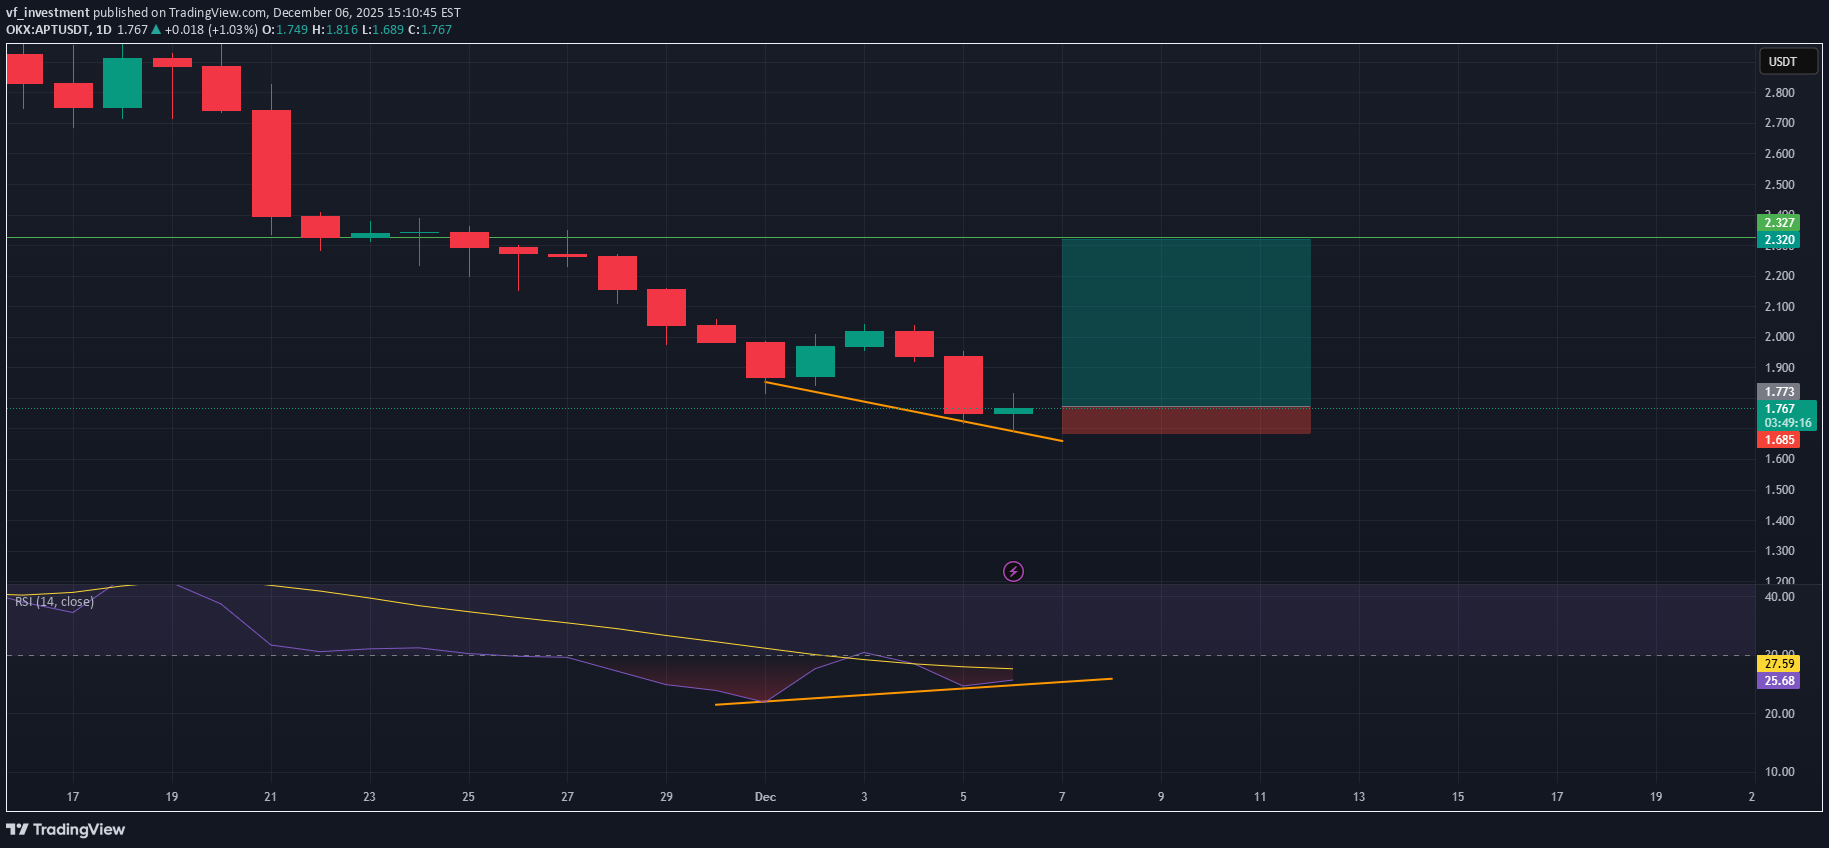
APT has been in a sustained downtrend, forming a series of lower lows on the daily chart. However, the recent price action shows a bullish divergence between price and RSI: 1. Bullish Divergence Price has made a lower low. RSI has made a higher low. This suggests weakening bearish momentum and a potential reversal or relief bounce. Both swing lows on the chart and RSI lows are highlighted and connected, confirming the divergence pattern. 2. Entry Zone The long entry is positioned just above the most recent candle after divergence confirmation. Price is currently trading near support created by the descending trendline. 3. Stop-Loss Stop-loss is set slightly below the recent swing low. This protects the position in case bearish continuation invalidates the divergence. 4. Take-Profit Target The take-profit region is placed near a previous resistance zone around 2.32–2.33 USDT, which aligns with a prior consolidation area. This provides a favorable risk-to-reward ratio. 5. Concept Behind the Trade Bullish divergence indicates sellers are losing strength. Daily timeframe divergences often lead to strong corrective moves. The setup is structured as a trend-exhaustion reversal attempt, aiming to capture a bounce back toward higher resistance.
vf_investment
خرید NEAR/USDT: سیگنال انفجاری صعودی بر اساس واگرایی مخفی!
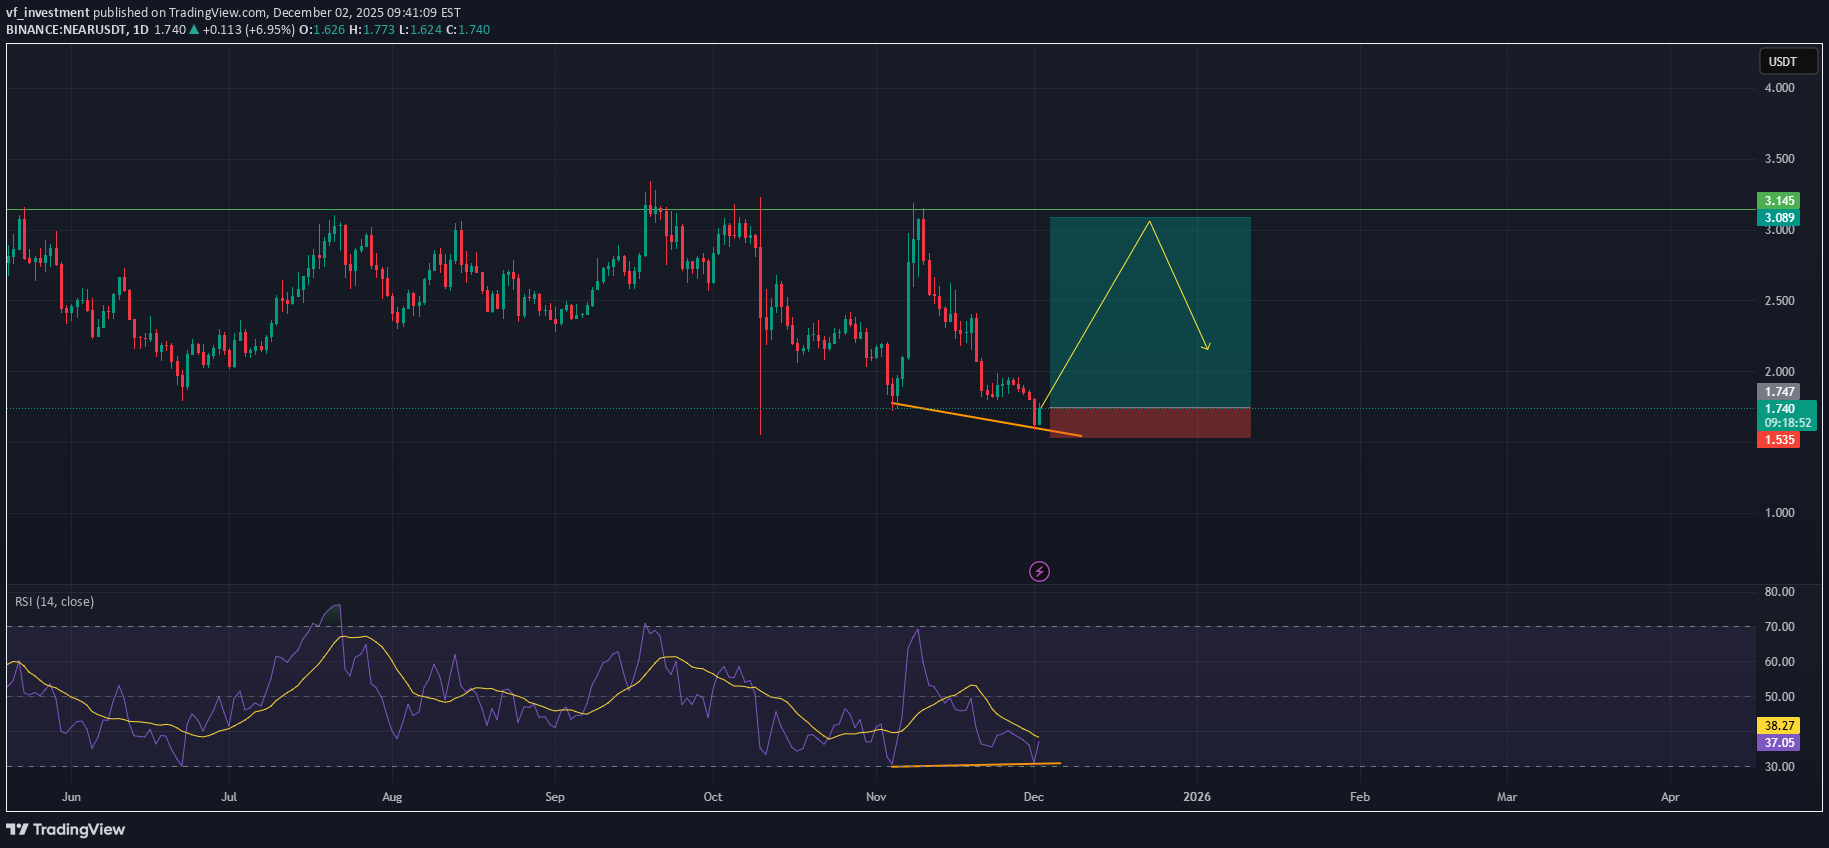
hi traders This trading idea is based on the Daily chart for the NEAR/USDT pair, identifying a strong reversal signal suggesting a significant bounce from a key support zone. Key Technical Observations Bullish Divergence: A clear Bullish Divergence has been established between the price and the Relative Strength Index (RSI). Price Action (Top Panel): The price is making lower lows (descending orange trendline), indicating continued selling pressure. RSI (Bottom Panel): The RSI is making higher lows (ascending orange trendline), suggesting that the downward momentum and selling strength are weakening despite the price continuing to drop. Interpretation: This divergence is a high-probability signal that the downtrend is exhausted and a reversal is imminent. Entry Zone at Key Support: The current price is near the critical psychological and structural support level around $1.76 to $1.80. The red box marks a tight risk area below this support. Trading Strategy Trade Bias: Long (Buy) Entry Zone: The green buy box indicates the entry range around the current price, with the ideal execution being within the $1.76 - $1.85 area, as the divergence confirms the potential bottom. Stop-Loss (Red Zone): A Daily close below the structural low at $1.530 would invalidate the bullish divergence pattern and confirm a further breakdown. Target: The green target box aims for the previous resistance zone and local swing high at $3.145 (marked by the green horizontal line). This target offers a substantial Risk/Reward ratio. Summary NEAR/USDT is presenting a powerful reversal setup on the Daily timeframe. The confirmed Bullish Divergence indicates that sellers are losing control, making the current price a high-probability accumulation zone before a projected bounce toward the $3.145 resistance level.
vf_investment
تحلیل تکنیکال اتریوم: آیا الگوی سر و شانه معکوس، جهش ۶۰ درصدی را رقم میزند؟
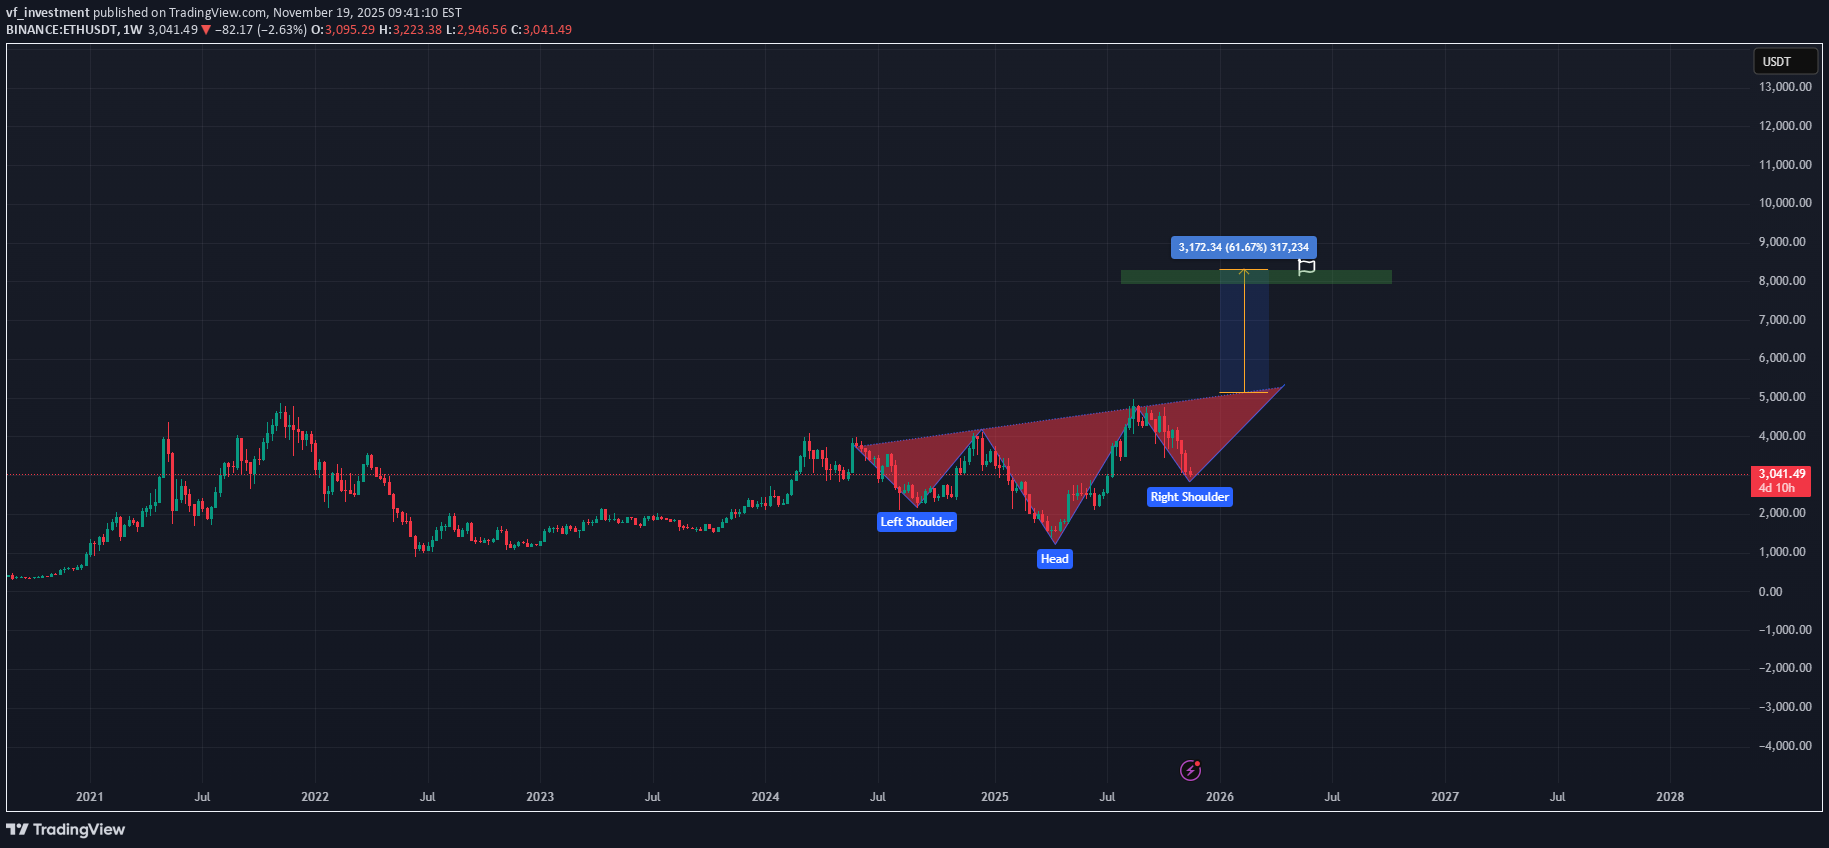
hi Traders On the weekly chart, Ethereum (ETH/USDT) appears to be developing a potential inverted Head and Shoulders pattern, which is traditionally viewed as a bullish reversal formation. Pattern Structure Left Shoulder: Formed during the earlier corrective phase. Head: A deeper swing low marking capitulation before recovery. Right Shoulder: Currently forming, with price pushing back toward the neckline. Neckline & Breakout Zone Price is approaching the neckline resistance, which aligns with a multi-year structural level. A confirmed weekly close above this neckline would signal a potential breakout. Measured Move Target Using the height of the head relative to the neckline, the projected upside target sits approximately 60% above the breakout level, aligning with the highlighted green target zone on the chart. Bullish Confirmation A breakout would be confirmed by: A strong weekly close above the neckline Increased volume Retest of the neckline turning into support (optional but ideal) Key Notes The pattern is not confirmed until the neckline breaks. Weekly patterns carry more reliability but also require patience. As always, risk management remains essential.
vf_investment
سقف کانال صعودی اپل کجاست؟ ریسک اصلاح قیمت بزرگ در راه است؟

hi traders, AAPL is trading within a well-defined long-term ascending channel. Price is currently approaching the upper boundary of this channel, where it has historically faced resistance. Trend Structure: The broader trend remains bullish, with higher highs and higher lows consistently forming within the channel. Current Position: Price is nearing the upper trendline resistance, suggesting a potential exhaustion point for the current upward move. RSI: The monthly RSI is approaching overbought territory, indicating that upward momentum may be slowing and increasing the probability of a pullback. Potential Scenario: A rejection from the channel’s upper boundary could trigger a corrective move. The projected path shows price pulling back toward the midline or even the lower boundary of the channel, aligning with historical behavior. 🎯 Trading Idea: Watch for signs of rejection or bearish reversal patterns at the upper trendline. If confirmed, a medium-term corrective move toward the lower channel boundary could provide a high-probability buying opportunity in line with the long-term uptrend. ⚠️ Risk Note: This idea is based on technical structure only. Always consider macro factors, earnings, and risk management before entering a position.
vf_investment
سیگنال صعودی ICP/USDT: شکست روند نزولی بلندمدت و هدفهای بزرگ!
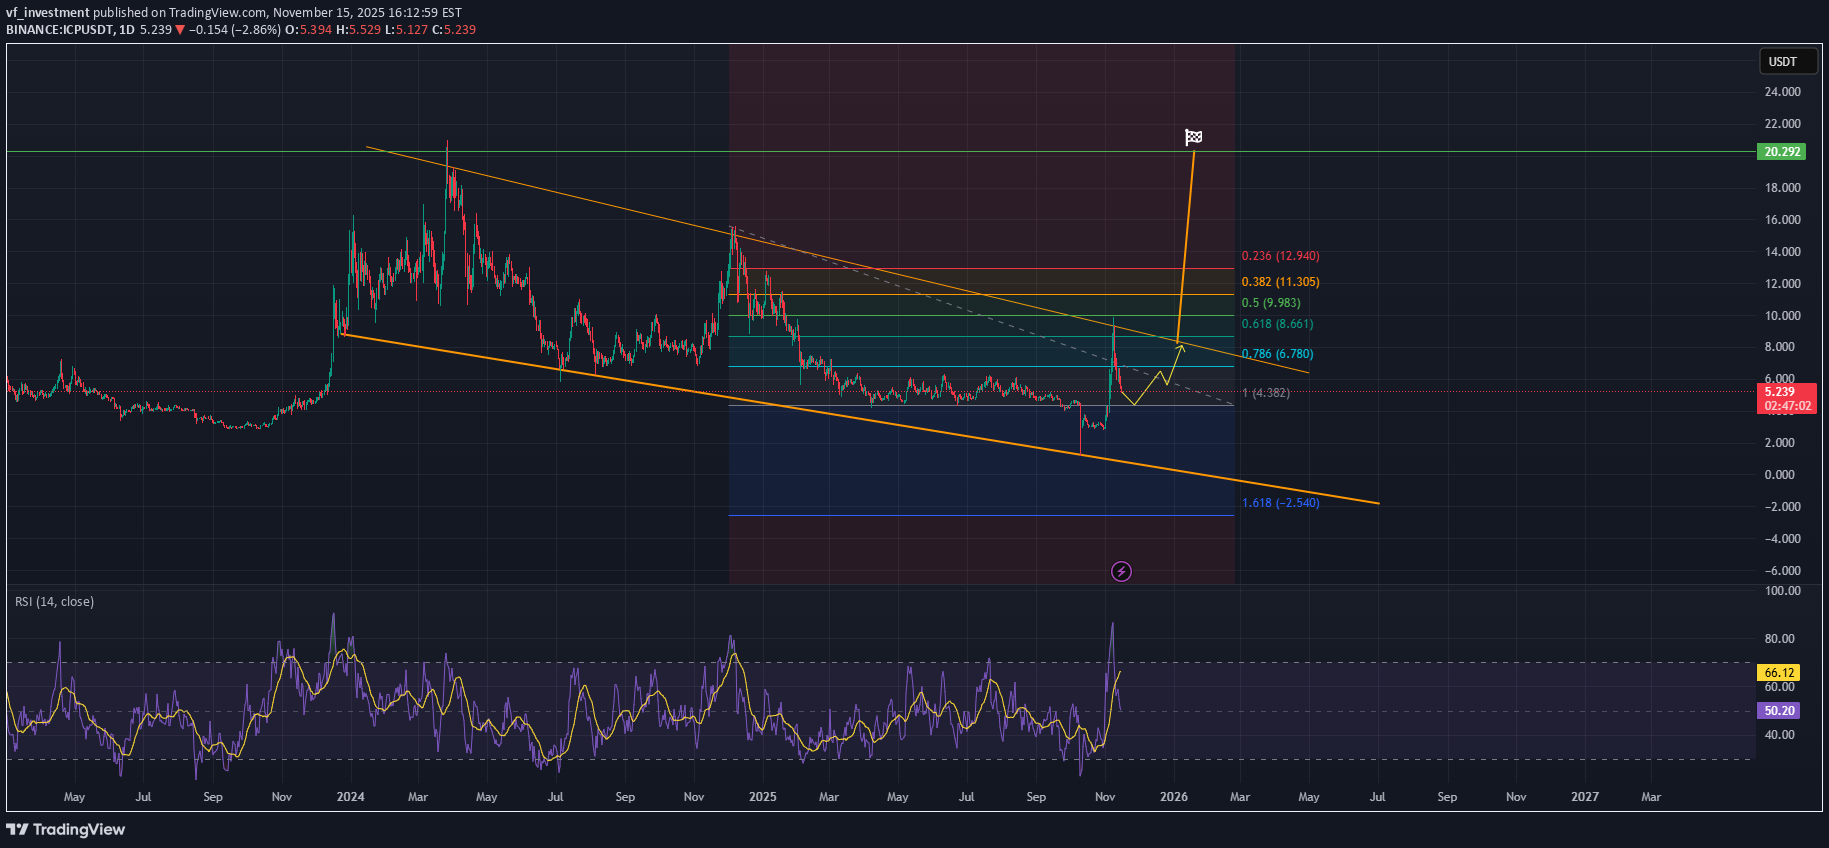
hi traders Here is the trading idea description for ICP/USDT based on the provided Daily chart. 🚀 Trading Idea: Long ICP/USDT Continuation Trade This idea identifies a breakout from a long-term downtrend and sets up a continuation trade based on the expectation of further upside momentum. Key Technical Setup Downtrend Breakout: The price has successfully broken above the multi-month descending trendline (marked by the top orange line), which contained the price action throughout 2024 and 2025. This breakout signals a significant shift in market structure from bearish to bullish. Impulse Move and Retest: The recent sharp vertical movement (impulse) was followed by a healthy pullback, which found support near the 0.786 Fibonacci Retracement level (around $7.80). This retest confirms that the previous resistance has turned into new support. Momentum: The RSI (14) is holding in the bullish territory (currently at 66.12), indicating that momentum is strong and favors continuation. Trading Strategy Trade Bias: Long (Buy) Entry: The trade is designed to enter a long position at $4.25. (Note: Based on the current chart, this entry is below the recent breakout structure and acts as a strong, long-term accumulation point or aggressive limit entry, perhaps aiming to catch a much deeper retest that has not yet occurred.) Target 1 (Conservative): The first target aims for the 2024 local highs around $17.50, which is a psychological and structural resistance level. Target 2 (Aggressive): The final target is the green horizontal line at $20.79, aiming to capture a full vertical extension of the preceding rally. Invalidation/Stop-Loss: A Daily close and failure to hold below the major low of the recent consolidation (around the 1.0 Fib level or the bottom orange trendline) would invalidate the bullish thesis. Summary ICP/USDT has confirmed a structural reversal by breaking its long-term downtrend channel. The continuation trade is now set up, aiming for a significant rally toward the $17 and $20 targets, following the strong momentum demonstrated in the recent impulse move.
vf_investment
الگوی سر و شانه معکوس پولساز در دات کوین (DOT): منتظر جهش ۲۸ درصدی باشید!
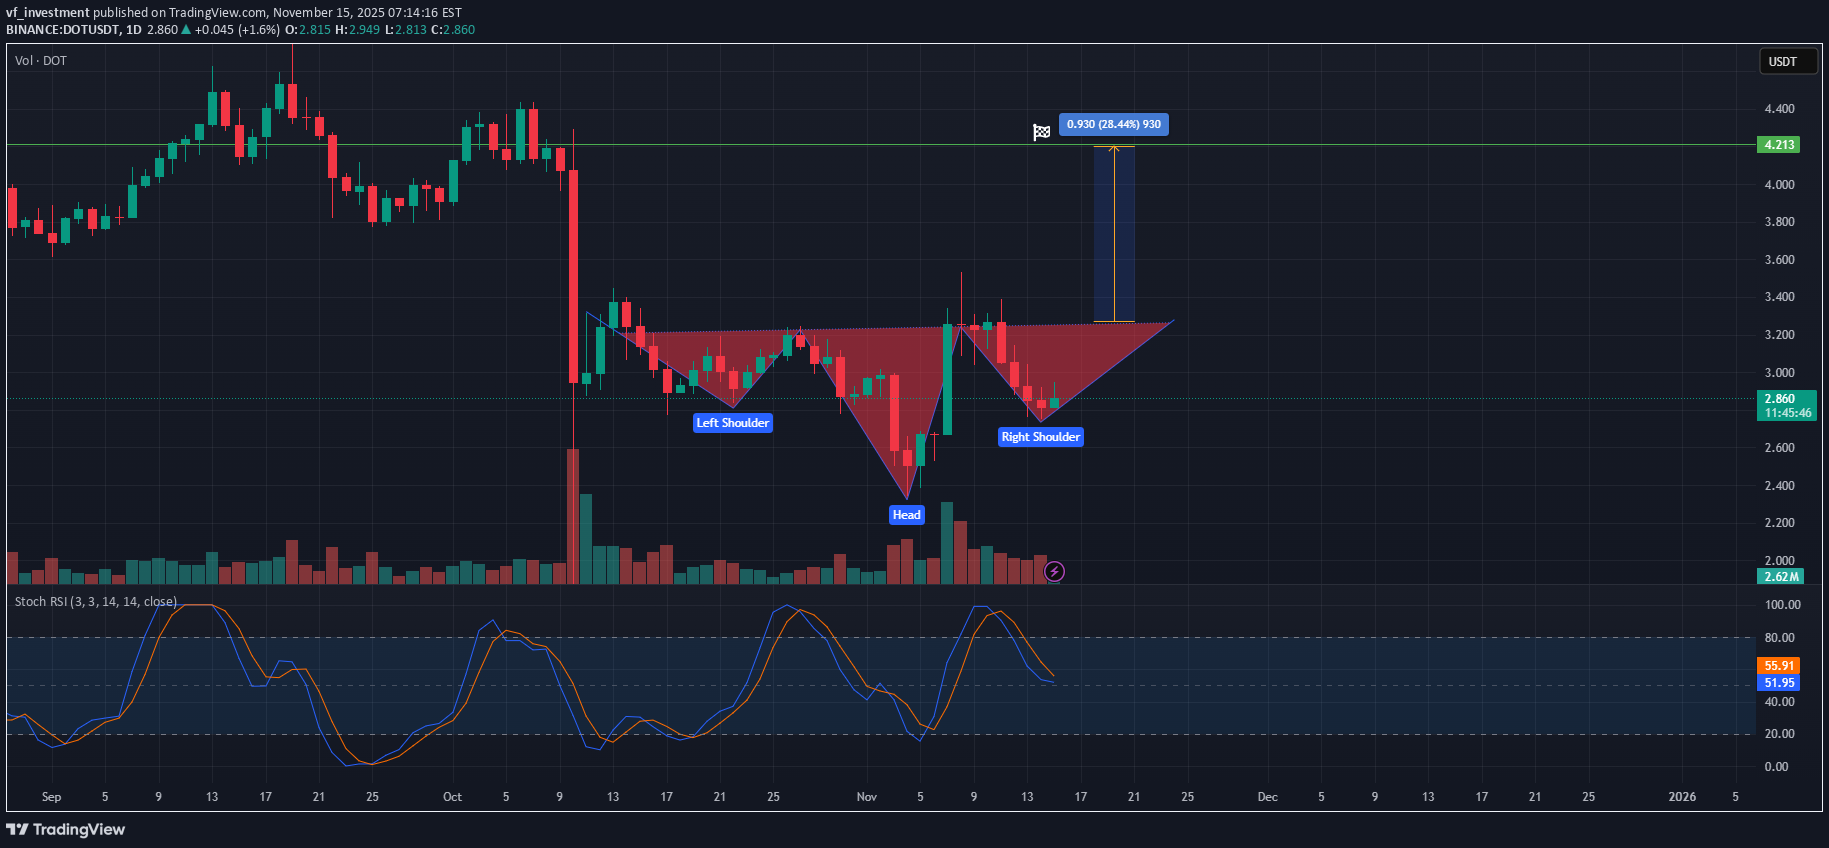
hi traders, DOT is currently forming a bullish inverted head and shoulders pattern on the daily chart, suggesting a potential medium-term trend reversal to the upside. Left Shoulder: Price declines and rebounds, creating the first swing low. Head: A deeper sell-off forms the lowest point of the structure before buyers step back in. Right Shoulder: Price is now developing the right shoulder, with higher lows indicating strengthening bullish momentum. The neckline resistance sits slightly above the current price. A confirmed daily close above the neckline would complete the pattern and trigger a potential breakout. The projected target, measured from the head to the neckline and extended upward from the breakout point, suggests an approximate 28% upside move, with the target area around 4.21 USDT. The Stochastic RSI is currently in mid-range and curling upward, providing additional momentum support for a potential bullish breakout. Trading Plan Considerations: Entry: Upon a decisive breakout and daily close above the neckline. Target: ~4.21 USDT (pattern completion target). Invalidation: Breakdown below the right shoulder low would invalidate this setup.
vf_investment
آلگوراند (ALGO/USDT) در آستانه انفجار قیمتی: راز مثلث نزولی و هدف ۶۱۸ دلاری!
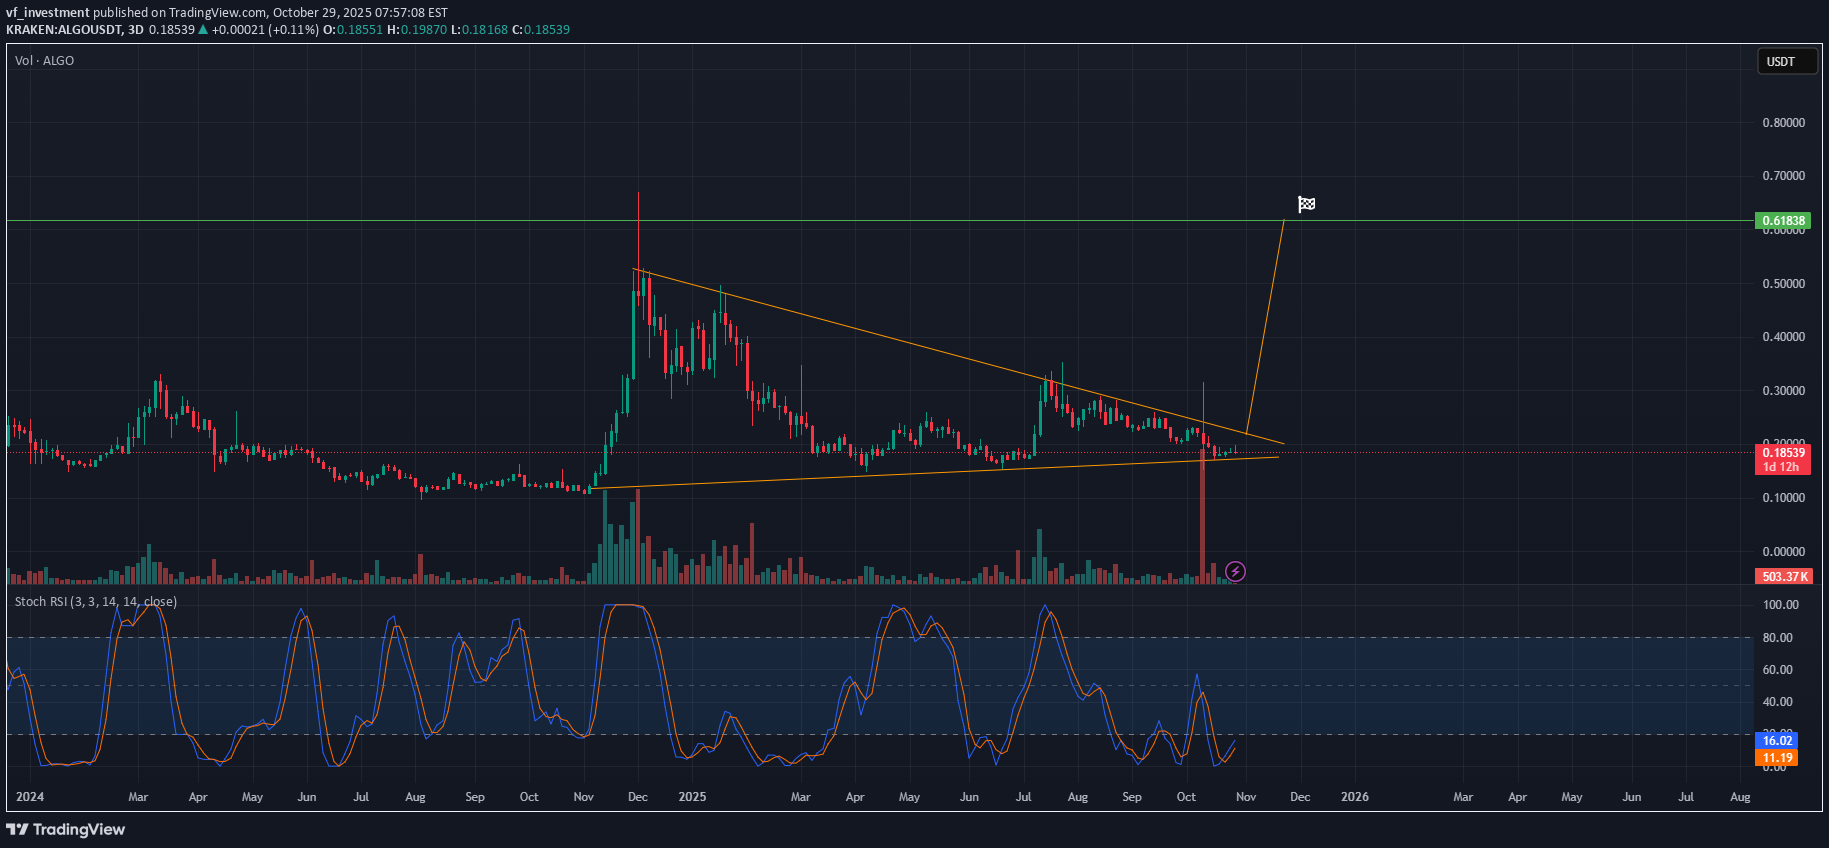
hi traders, The chart shows ALGO/USDT forming a descending triangle pattern over the past year, with a series of lower highs and a relatively flat support line around the $0.18–$0.19 level. The price is currently near the apex of the triangle, suggesting a potential breakout point is approaching. Key observations: Support line: Around $0.18, tested multiple times since early 2025. Resistance trendline: Descending from the December 2024 high, forming lower highs. Volume: Noticeable spikes coincide with price movements, suggesting increasing interest around key breakout levels. Stochastic RSI: Currently in the oversold region (around 11–16), indicating a potential upward momentum reversal in the near term. Trading idea: If ALGO breaks above the descending resistance line with strong volume, the next target is projected near $0.618, as marked on the chart. This suggests a significant upside potential from the current levels, aligning with the breakout strategy. Traders might consider entering near the support or upon confirmation of a breakout, with stop-losses placed just below the support line to manage risk. Summary: ALGO/USDT is in a consolidation phase within a descending triangle. A breakout to the upside is anticipated, supported by oversold Stochastic RSI levels, with a projected target around $0.618. Risk management should be applied near the $0.18 support level.
vf_investment
BTCUSDT Monthly Outlook
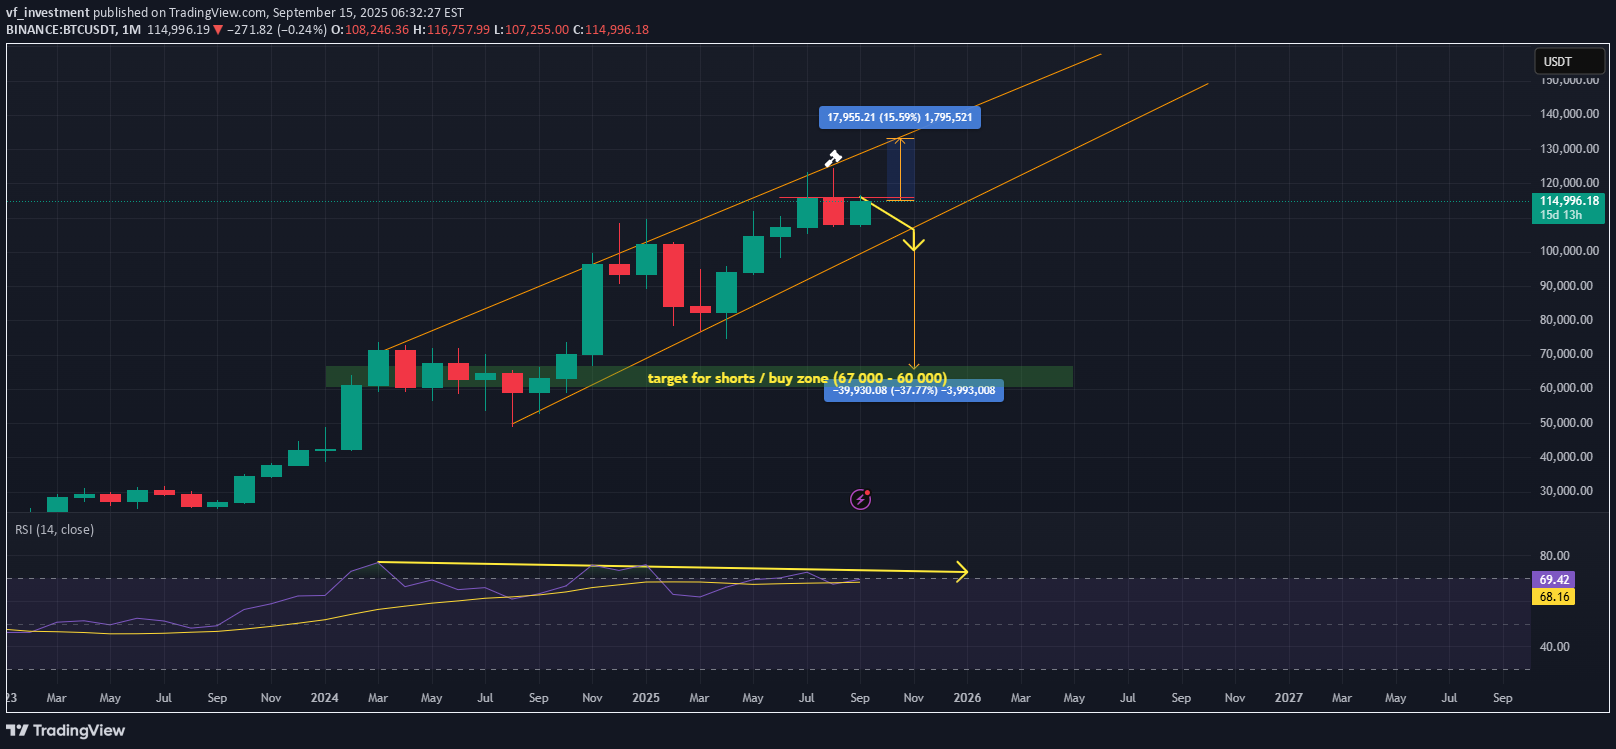
hi Traders, On the monthly time frame, BTCUSDT is forming a bearish rising wedge pattern, which typically signals that upside momentum is limited and a breakdown is likely sooner or later. While price action is still holding within the wedge, the structure suggests exhaustion on the higher end of the channel. The chart highlights a potential accumulation zone for long-term investors between $67,000 and $60,000. This range could serve as a strong buy zone in case of a deeper correction once the wedge breaks down, offering favorable risk-to-reward opportunities for strategic positioning. Until then, upside appears capped, and investors should be prepared for volatility as the market approaches the wedge’s apex. Are you buying now or waiting for lows?
vf_investment
ALGOUSDT (Weekly) – Channel Uptrend with Mid-Term Target
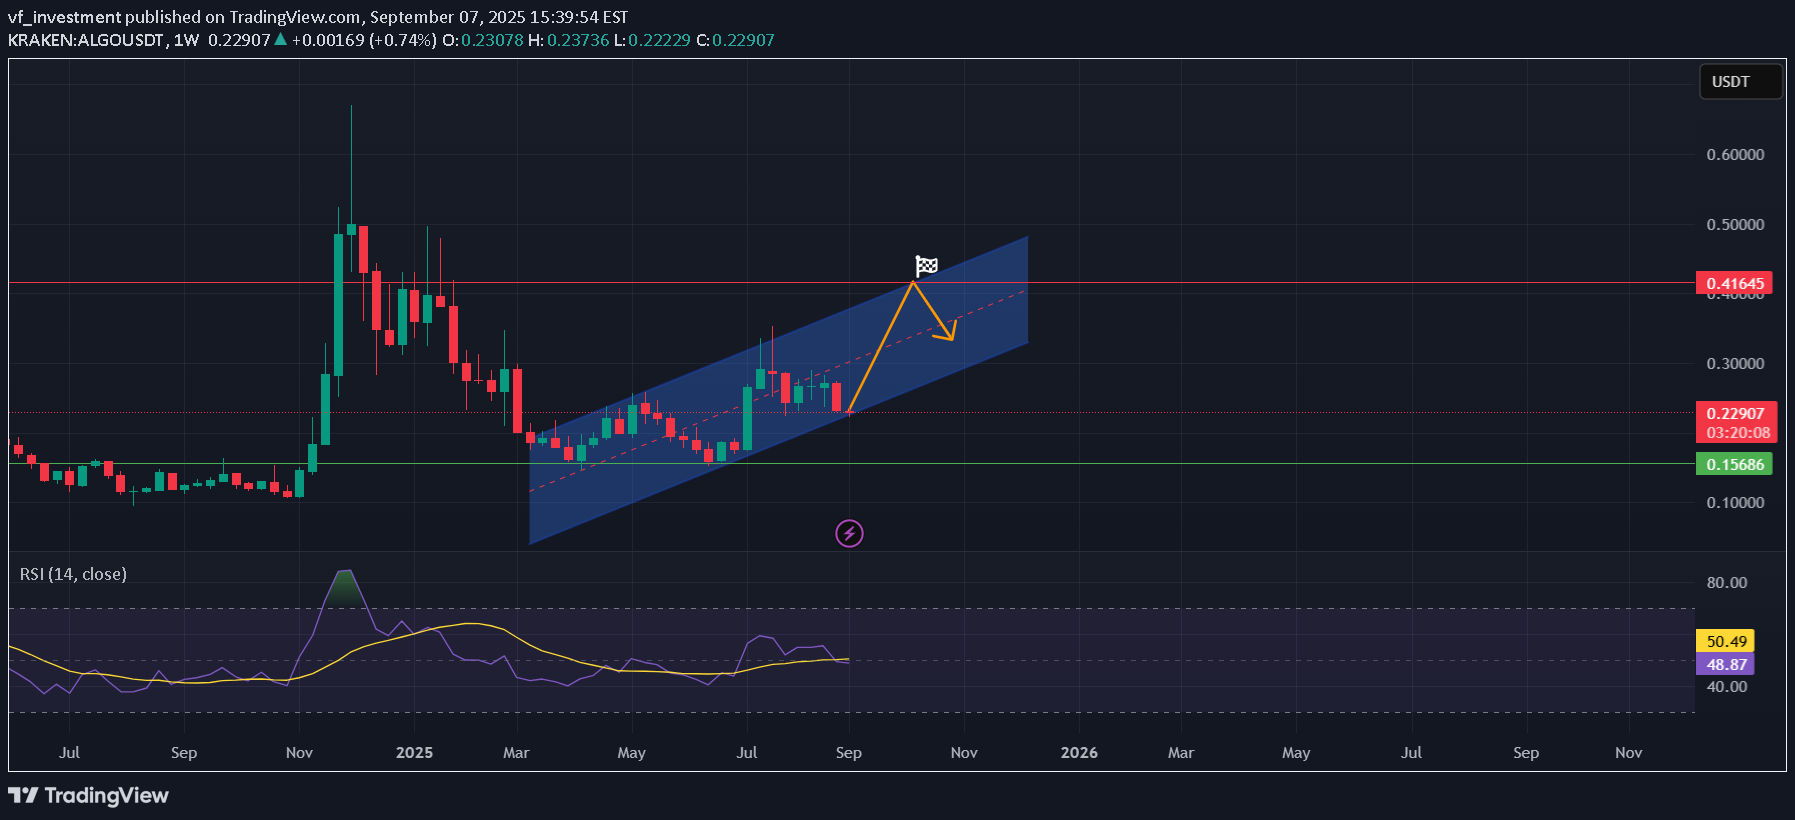
hi traders Let's have a look at Algorand on the weekly time frame. To be honest, it's not what most traders expected as there's not much going on. After reaching 0,60ish high in December 2024, the price was in a strong downtrend but it's clear that it bottomed out in April 2025, but since then it's been a very steady but slow uptrend. 📊 Chart Overview Current Price: $0.229 Major Support: $0.156 Major Resistance: $0.416 Price is trading inside a rising channel structure since early 2025. 🔎 Technical Analysis Ascending Channel Price has been respecting both the lower and upper bounds of the rising channel. Trend Continuation As long as ALGO holds above $0.156 (key weekly support), the trend bias remains bullish inside the channel. RSI Status Weekly RSI around 49–50, sitting at neutral levels. No clear divergence, leaving room for further momentum in either direction. 🎯 Price Targets First Target: $0.30–0.32 (mid-channel resistance zone). Final Target: $0.41–0.42 (major resistance & channel top). ⚠️ Risk Management Stop-loss: Below $0.156 (breakdown of weekly channel support). Risk/Reward: ~1:2.5 toward $0.41 resistance. 📈 Trading Idea ALGO is currently consolidating inside a weekly ascending channel, showing steady higher lows. A bounce from current levels could drive price toward the $0.41 target zone, with interim resistance around $0.30. Failure to hold $0.156 support would invalidate the bullish setup.
vf_investment
Filecoin will surprise everyone
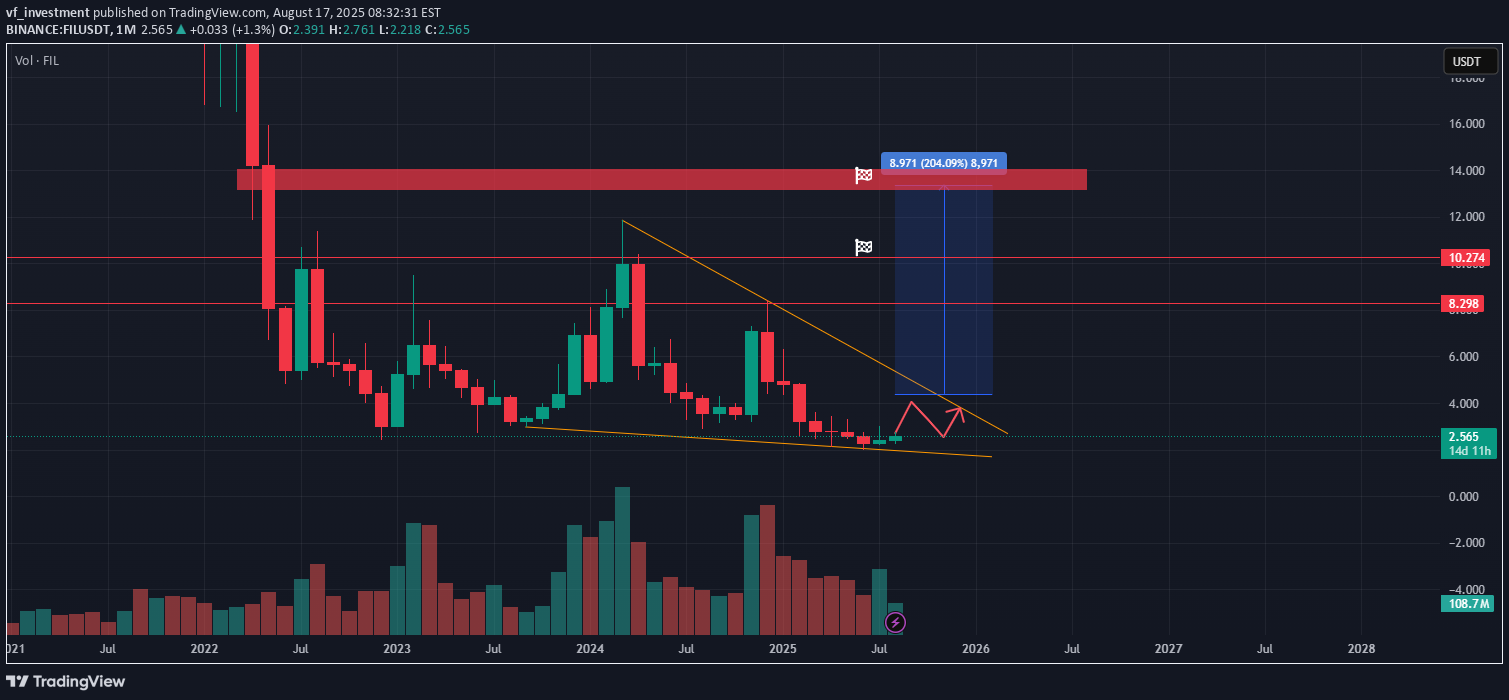
hi traders Filecoin is not a very popular coin, but it will change soon. Entry Zone: Current levels around $2.56 represent a strong accumulation area. Pattern: Price has been consolidating within a long-term falling wedge, showing reduced volatility and volume compression – a classic setup for a breakout. Upside Potential: A breakout from this structure could target the $8.30 and later $10.27 zone. Final target: 13,400-14$ Psychological Factor: Market sentiment is still heavily bearish, which means buying now is buying cheap. Historically, such levels have preceded strong rallies. Volume: Noticeable accumulation spikes suggest smart money interest. Short-Term Path: Expect some sideways action and minor pullbacks before a potential sharp breakout. Filecoin is severely undervalued at current levels and may surprise everyone in the coming months with a strong upside move. This is a high-risk/high-reward setup, but the risk/reward ratio is favorable for long-term investors and swing traders.
Disclaimer
Any content and materials included in Sahmeto's website and official communication channels are a compilation of personal opinions and analyses and are not binding. They do not constitute any recommendation for buying, selling, entering or exiting the stock market and cryptocurrency market. Also, all news and analyses included in the website and channels are merely republished information from official and unofficial domestic and foreign sources, and it is obvious that users of the said content are responsible for following up and ensuring the authenticity and accuracy of the materials. Therefore, while disclaiming responsibility, it is declared that the responsibility for any decision-making, action, and potential profit and loss in the capital market and cryptocurrency market lies with the trader.