
without_worries
@t_without_worries

Ne tavsiye etmek istersiniz?
önceki makale
پیام های تریدر
filtre
without_worries
Bitcoin Gaussian channel vs Strategy's leveraged long flywheel
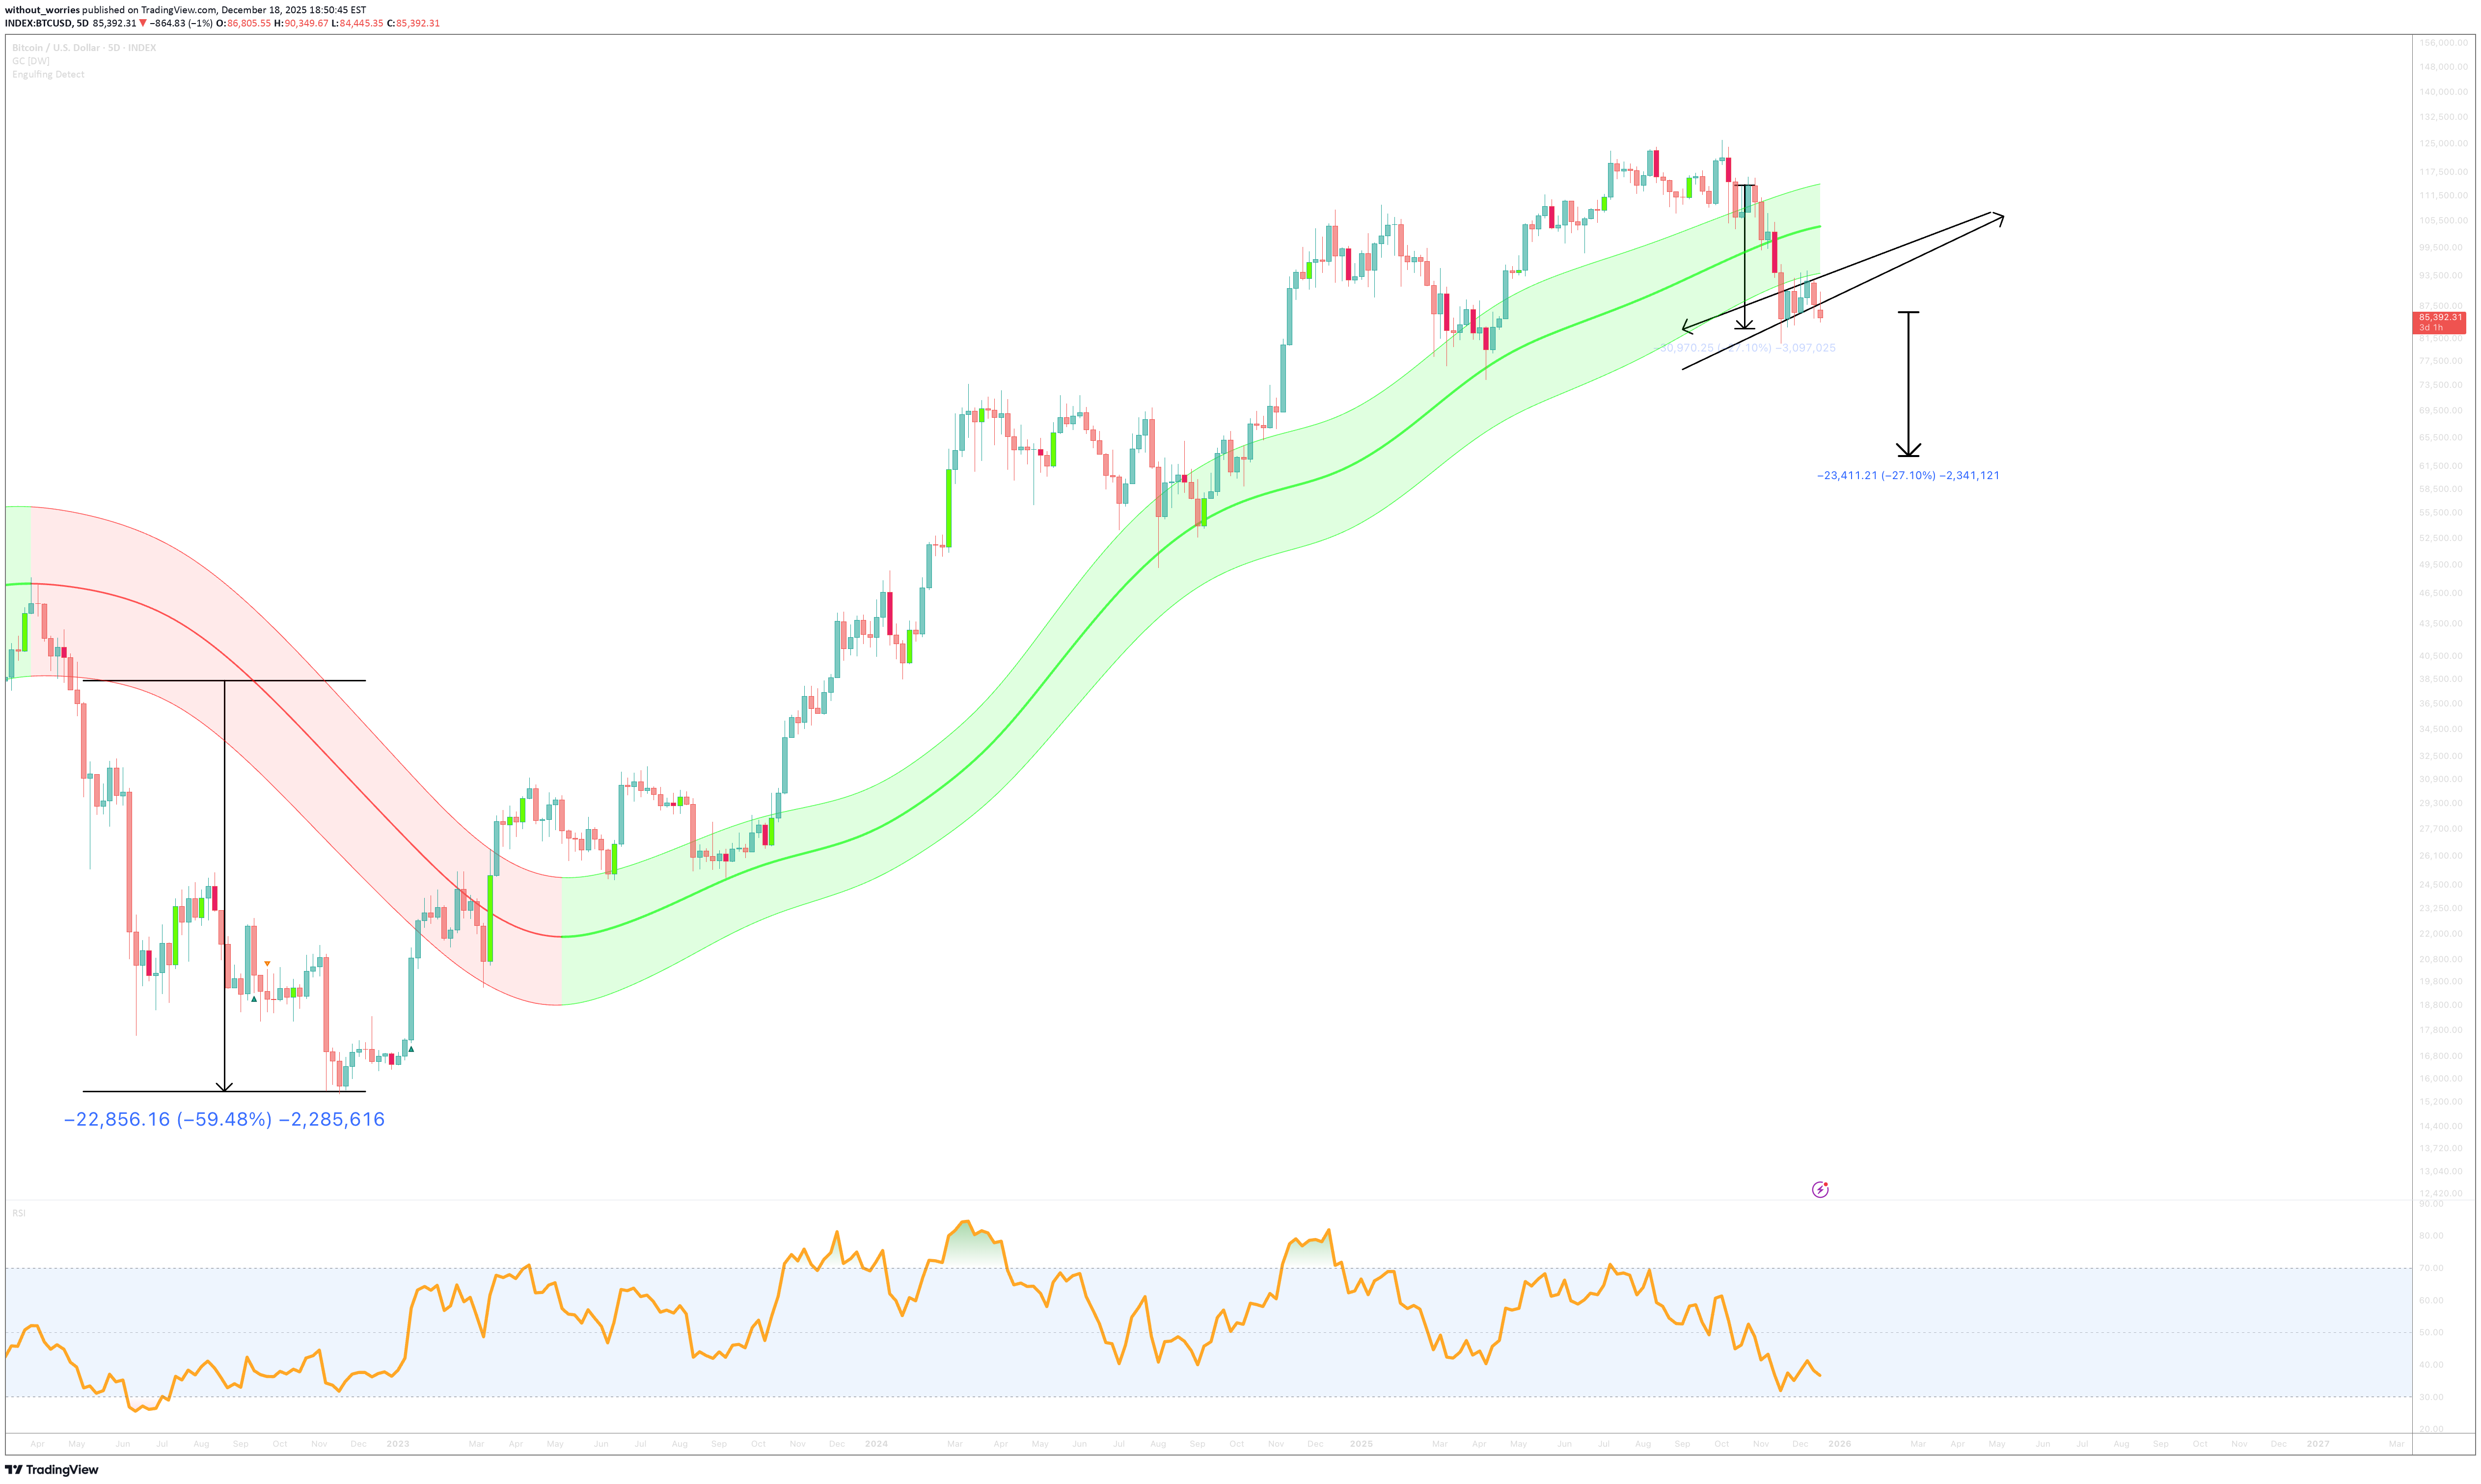
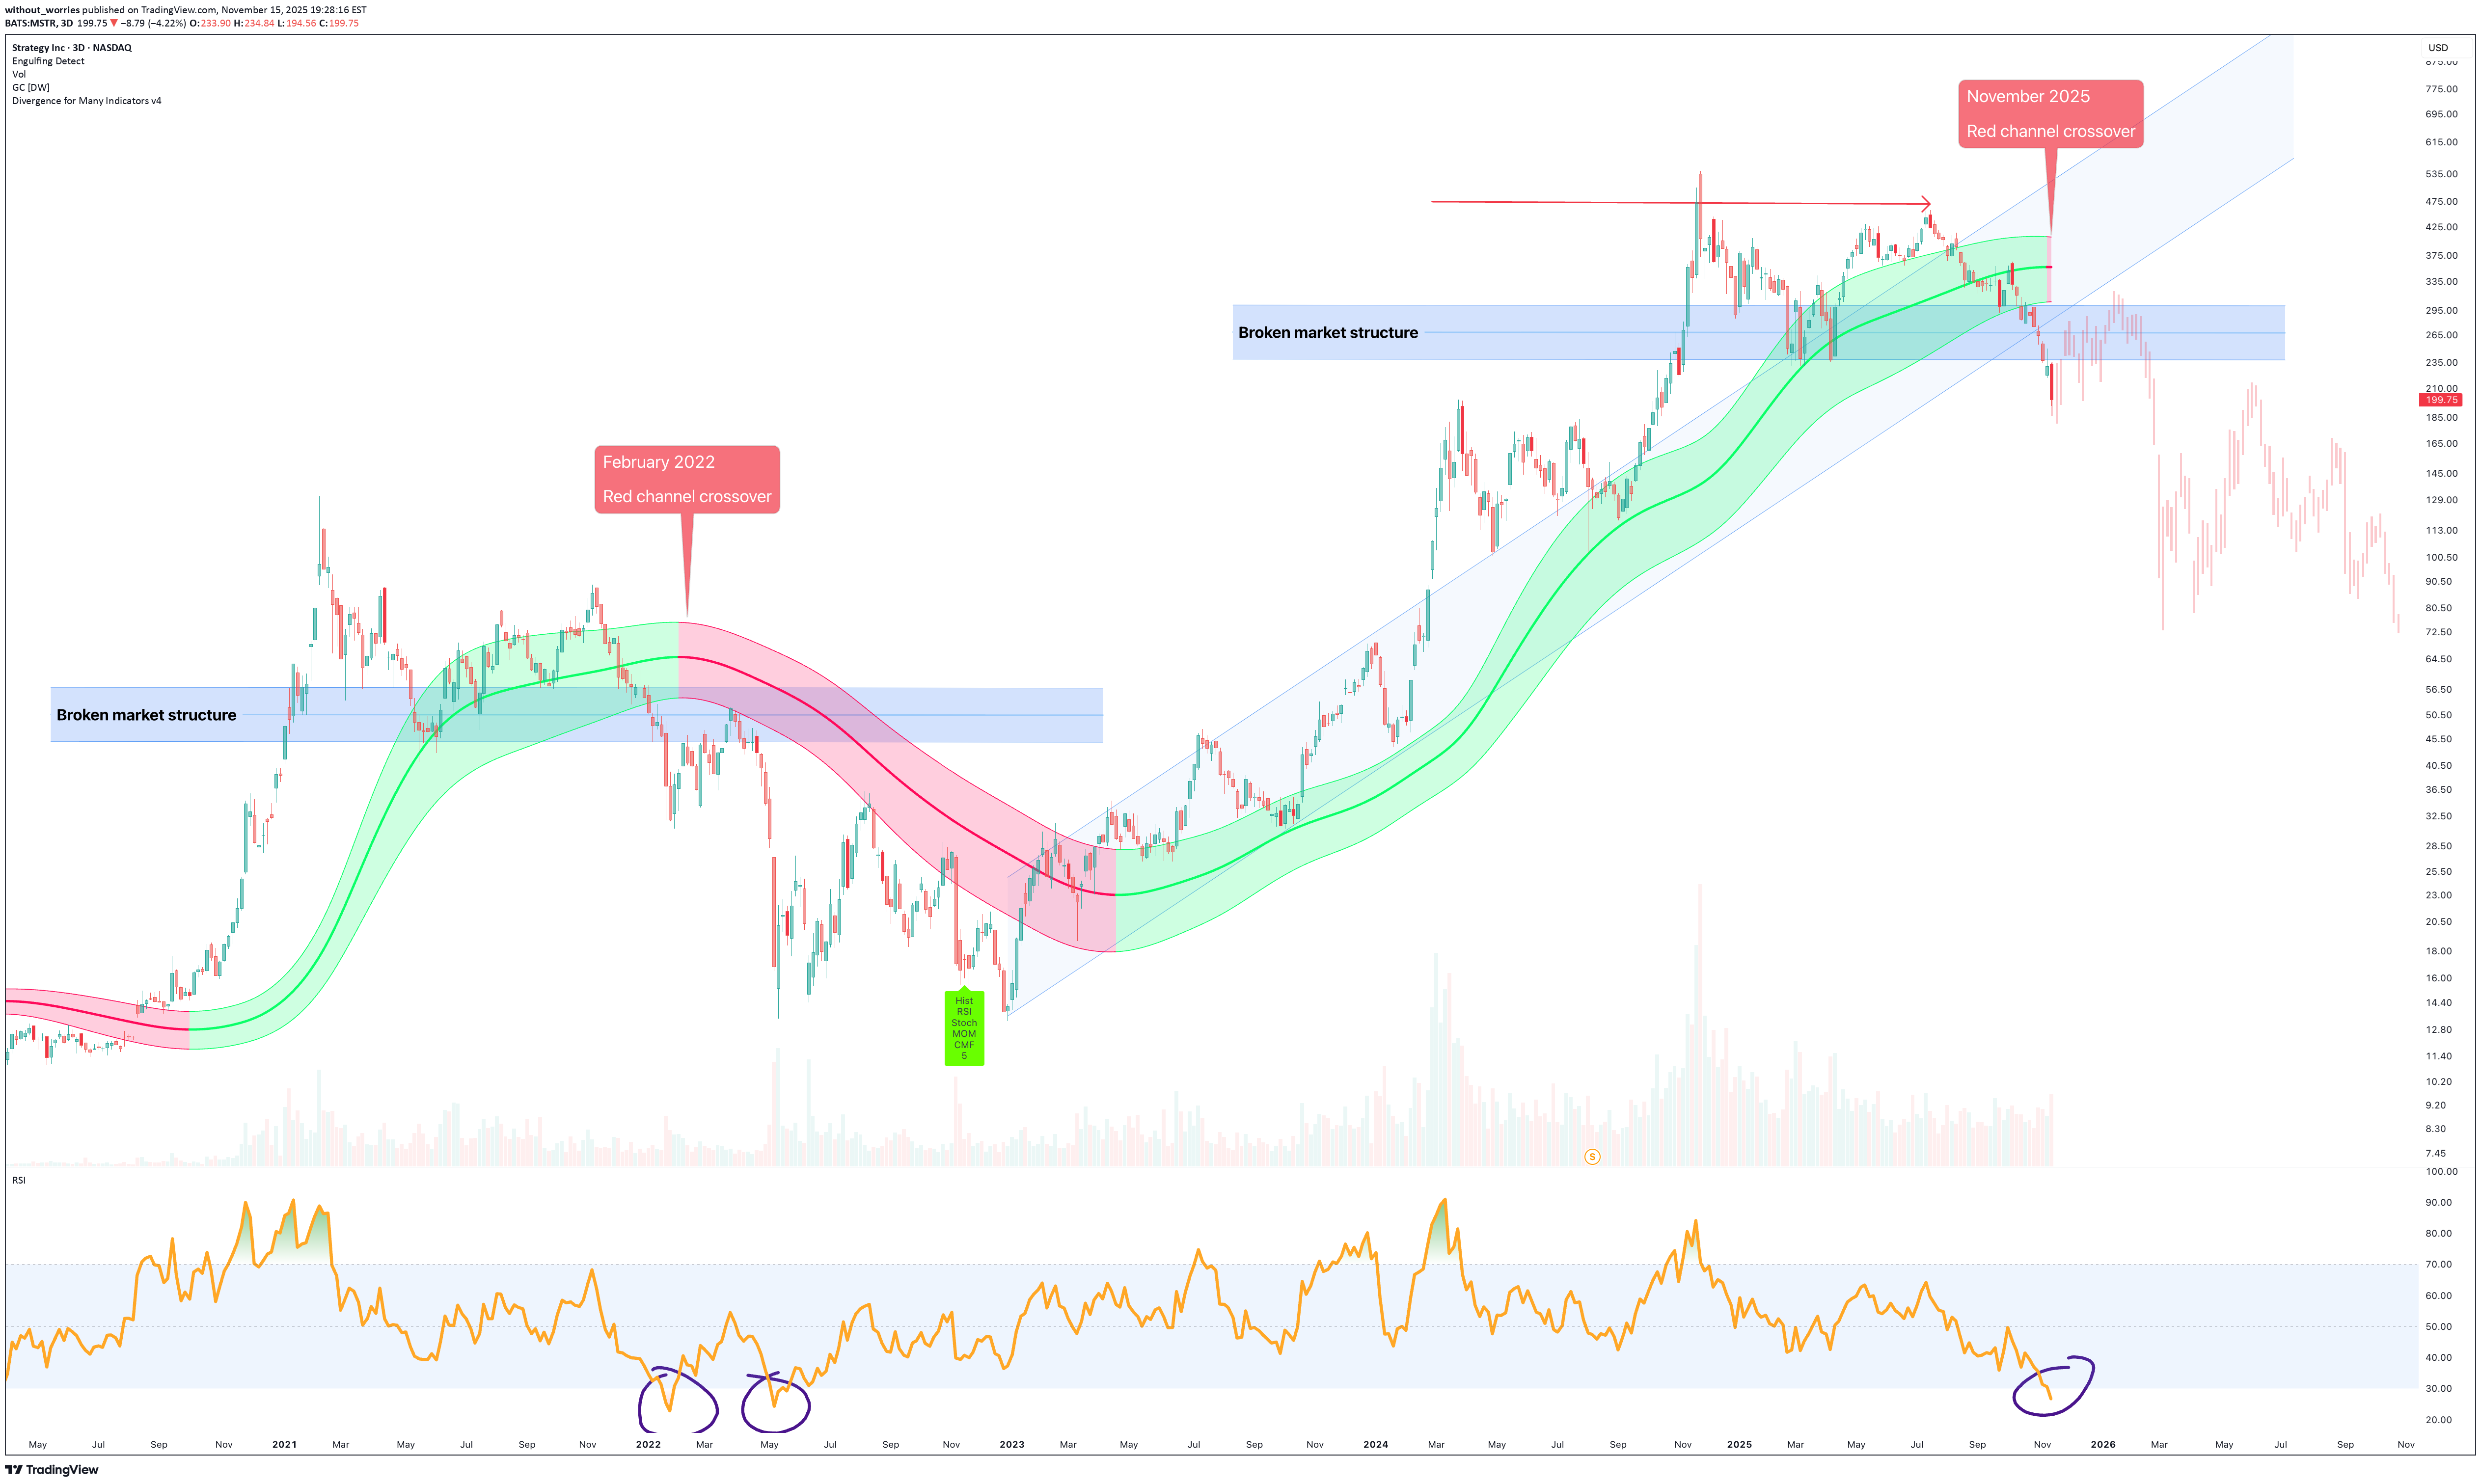
For most of the bull run price rode the Gaussian channel like a moving runway: pullbacks tagged the mid-band, buyers defended, trend continued. The last swing changed that. We got a clean displacement down through the 5 day channel and now BTC is compressing under/inside the band in what resembles a rising wedge attempt. That’s not “game over” by itself, but it is the same kind of “regime change” that historically turns smooth uptrends into ugly, time wasting corrections. The key observation When BTC is above the Gaussian channel and the slope is positive (green), risk markets treat the move like it’s “funded.” When BTC closes below the channel, the market starts acting like credit just tightened. That matters because Strategy’s risk isn’t a magical liquidation button. It’s a financing loop. BTC trending up? Then MSTR tends to trade rich, capital raises are easier, more BTC bought and the flywheel spins faster. So much win. BTC trend breaks? MSTR multiple compresses, capital raises get expensive, obligations become louder, flywheel develops square edges. So BTC closing below the channel is the chart equivalent of Strategy hearing the banker clear his throat. 5 day historical closes below the Gaussian channel Price structure: what the wedge is really saying Right now, the market is doing the classic “I’ll bounce… but not with conviction” behaviour. You must have noticed every time price action climbs surely and slowly it is hammered down in one swift 10 minute $5-10k sell off. That's not retail. That's someone who knows the fan and back of a dogs bum after a huge curry are about to meet. 50-60% corrections are typical once Gaussian channel resistance is confirmed. That's in addition to the already made 30% correction from $126k. A confirmation takes price action down to the $36k area. Why this matters specifically for Strategy Think of Strategy as a trader who doesn’t get auto liquidated, but does have: scheduled obligations (interest + preferred dividends), a reputation trade (mNAV / “BTC proxy premium”), and a dependency on market windows to refinance or raise. When BTC is trending cleanly, the market ignores the obligations. When BTC breaks trend, the obligations become the plot. So the risk isn’t “Strategy must sell tomorrow.” The risk is: BTC drawdown + MSTR premium compression = less flexibility = fewer “nice options” = higher chance they choose an “ugly option” (dilution, costly financing, or BTC sales) In other words: a BTC regime flip turns Strategy’s bold bet into a test of liquidity optics. Scenarios to watch 1) Bear continuation (base case if price stays under the channel) Price fails to reclaim the Gaussian channel (especially the mid/upper band). Wedge support breaks, downside expansion develops. Target zone: low $60Ks Narrative match: Strategy’s flywheel slows, market starts pricing the balance sheet like it matters again. 2) Bull save BTC reclaims the channel and holds it (not a wick, a candle body close and follow through) with a break above wedge resistance and converts it into support. Then the “forced selling” fear premium fades fast. Narrative match: financing window reopens, reflexivity returns. Closing thoughts The Gaussian channel isn't a crystal ball; it's a mood monitor for the market. And right now, it's showing a shift from "euphoric greed" to "nervous sweating." Price has been kicked out of its smooth uptrend and is now flopping around below the channel like a fish on the dock. That's not a healthy pullback; it's a regime change. For Michael Saylor and MicroStrategy (MSTR), this isn't about a magic liquidation threshold. It's about oxygen. Their entire leveraged long flywheel requires the high-octane fuel of a bullish trend. BTC closing below this channel is the equivalent of the engine starting to sputter. The obligations don't disappear; they just get a lot louder when the music stops. Ww Disclaimer =================================================================== Let's be brutally honest here. This is an observation, not an instruction manual. I'm connecting dots on a chart and speculating about corporate finance like an armchair quarterback. I am not a registered financial advisor, and this is absolutely not financial advice. Trading and investing, especially in volatile assets like Bitcoin and related equities (like MSTR), is a fantastic way to incinerate capital. You can and likely will lose money. The models (Gaussian channels, wedges) are just pretty stories we tell about past price movements. The market has a PhD in humbling overconfident analysts. MicroStrategy is a complex entity with liabilities, strategies, and management decisions that are entirely opaque to us on the outside. This flywheel theory is a simplification. The company could have plans, hedges, or lines of credit we know nothing about. Or it could be closer to the edge than anyone realises. We. Don't. Know. Do your own research! Now, if you'll excuse me, I need to go check if my own portfolio is obeying its Gaussian channels. Spoiler: it is, awesome.
without_worries
A continued crash to $45k for Bitcoin? - December 2025
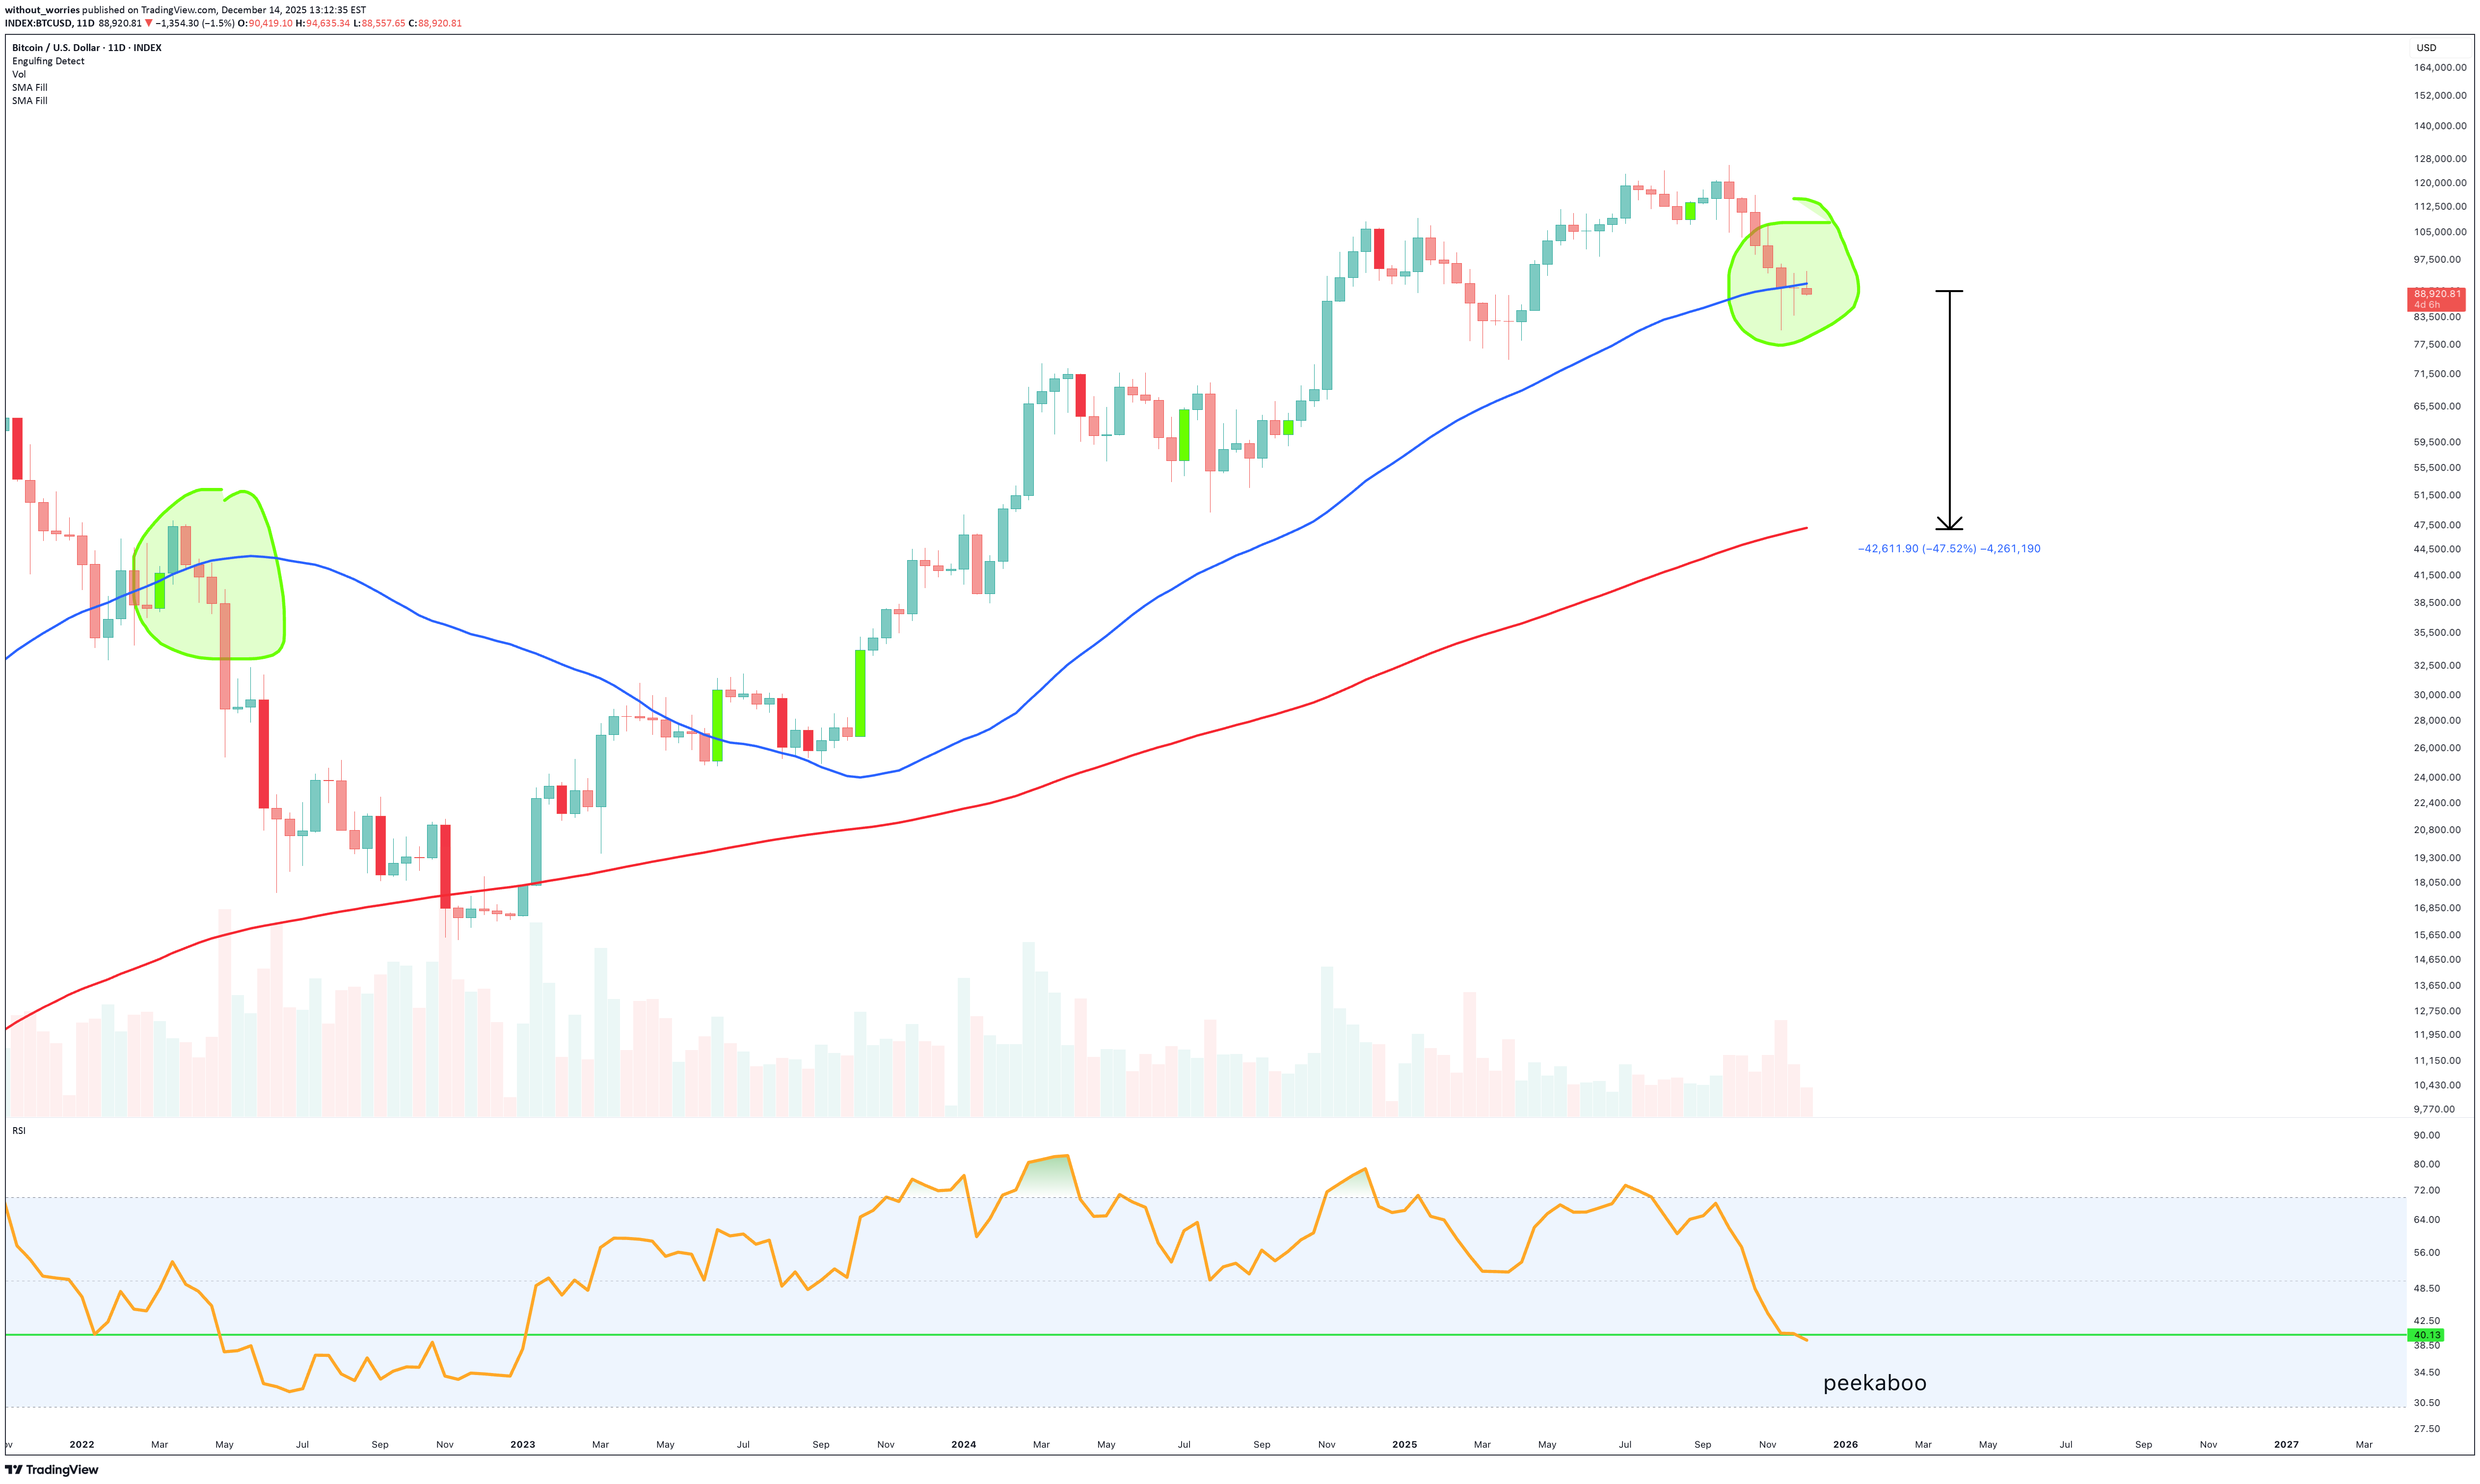
Bitcoin'ın 11 günlük 50SMA altındaki mevcut mum gövdesi baskısını durdurmak için 5 günü var. Bitcoin'in tüm tarihi boyunca bu seviyenin altına yakın bir mum gövdesi, 11 günlük 200SMA'nın testi anlamına geliyordu. Bu kadar basit. Asla yanlış sinyal değildir. İşte tüm tarihsel data noktaları: Tüm Bitcoin geçmişi boyunca 11 günlük grafikte 50SMA Şu anda mum Mezar Taşı DOJI olarak yazdırılıyor. 3 günlük grafiğe biraz daha yakınlaştığınızda fiyat hareketinin 200SMA'yı takip ettiğini görebilirsiniz. Varlığın ne olduğu önemli değil, bunu her gördüğünüzde bu bir zayıflık işaretidir. Sola bak. Varlık ne olursa olsun, genellikle tam bir çöküş takip eder. Fiyat hareketi sarhoş bir denizcinin limana dönüş yolunu bulması gibi sendelese bile. Fikir " Sırada Bitcoin 40-45 bin dolara düşüş mü var? – Ekim 2025 "Yaklaşık 120 bin dolar civarında yayınlanan bir açıklama piyasa yapısının kırılmasını çok açık bir şekilde ortaya koydu. Bu fikir aynı yapı kopuşunun devamıdır. Bu fikre karşı kin yağmaya devam ediyor. Piyasanın umurunda değil. Bu devamın doğrulanması halinde Micheal Saylor'a kredi verenler muhtemelen çok gergin olacaklar. Bana göre Stratejinin zorla tasfiyesi Bitcoin alanının başına gelebilecek en iyi şey olacaktır çünkü Temettüleri ödeyecek nakit bir yerden gelmeli ve bu da Bitcoin satmak anlamına geliyor. Zaten tükenmiş bir pazar yerinde. Etkileyicilerin "Black Rock" ile izleyicileri heyecanlandıran bu seferki gönderilerinizi panik satışıyla satın aldığını fark ettiniz. Sonuçlar Bunu bir TED Konuşması gibi süslemeyelim. Bitcoin'in tüm tarihi boyunca bir kez bile kaçınmadığı şeyi yapmaktan kaçınmak için beş günü var. Bu drama değil, bu istatistik, hopium'u mahveden sıkıcı türden. 11 günlük 50 SMA'nın altında teyit edilen bir mum gövdesi her zaman 11 günlük 200 SMA'nın test edilmesiyle sonuçlandı. İstisna yok. Hayır "evet ama bu sefer BlackRock...". Mumun ortasında ruhsal uyanış yok. Sadece yerçekimi yerçekiminin yaptığını yapıyor. Şu anda fiyat bir mezar taşı DOJI basıyor. İroni veya cenaze törenlerinden hoşlanmadığınız sürece, ismine rağmen yükseliş mumu değil. Piyasa yapısının kırılması aylar önce 120 bin dolar civarında, optimism zirveye ulaştığında ve lazer gözleri ve bağlı kuruluş bağlantıları olan insanlar tarafından sağduyunun susturulduğu dönemde tespit edilmişti. O zamandan bu yana fiyat hareketi, bozuk yapının yaptığının aynısını yaptı: eziyet, başarısızlık ve yuvarlanma. 45 bin dolara doğru bir move, yoktan var edilen bir tahmin değil, mevcut sinyalin doğrulanması durumunda mekanik bir sonuçtur. Eğer bu seviyeye ulaşılırsa, sizin tarafınızdan yüksek sesle, kamuoyuna ve tekrar tekrar yayınlanmasına rağmen, “siyah kuğu” olarak çerçevelenecektir. Saylor'ın durumuna gelince, kaldıraç her iki yönde de işe yarar. Borç verenler tedirgin oluyor. Zayıf bir piyasada zoraki bir satıcı, "BlackRock" koruyucu bir spell gibi kaç kez fısıldanırsa söylensin, asla yükselişe geçmez. Eğer bu çağlayan gerçekleşirse Bitcoin'u öldürmez. Etkileyicilere çok daha kötü bir şey yapacak: onları açığa çıkaracak. Ve açıkçası bu, bu pazarın yıllardır gördüğü en sağlıklı şey olabilir. Vay Sorumluluk reddi beyanı ============================================================== Bu finansal tavsiye değildir. Bu paniğe kapılmaya, altını satmaya veya yabancılara öfkeyle tweet atmaya yönelik bir çağrı değildir. Piyasalar herhangi bir tezi istediği zaman geçersiz kılabilir. Fiyat hareketi yapıyı yeniden kazanır ve önemli hareketli ortalamaların üzerinde kararlı bir şekilde kapanırsa bu görünüm değişir. Yanlış olduktan sonra bir grafiğe bağlılık mahkumiyet değil, sadece Wi-Fi bağlantısına karşı inatçılıktır. Kaldıraçla, duyguyla veya YouTube küçük resimlerinden ödünç aldığınız güvenle ticaret yapıyorsanız bunların hiçbiri sizi kurtaramaz. Olasılıklar, tarih ve yapıyla işlem yapıyorsanız, o zaman bu grafik her zaman yaptığını yapan şeydir, oysa insanlar yapmayacağını söylüyor. Gauss kanalı dışında aynı 11 günlük grafik üzerinde bu fikir hakkında daha fazla çalışma. Bu gerçeğin %100 başarı oranı vardır. Şöyle diyor: a) Fiyat hareketinin Gauss kanalı içindeki 11 günlük mum gövdesini kapattığı her seferde, fiyat hareketi kanalın tabanını test etti. b) Fiyat hareketinin Gauss kanalı içinde 11 günlük mum gövdesini kapattığı her seferde, fiyat hareketi Fibonacci %50 seviyesini test etti. Bu, eğer fiyat bu Cuma gününe kadar 95 bin doları toparlayamazsa, %100 olasılıkla fiyat hareketinin tuğla gibi 45 bin dolara düşeceği anlamına geliyor Biraz kripto satın alın, etkileyiciler bana bunun sizi zengin edeceğini söylüyor. Tam tersi olana kadar bu grafik bunu doğruladı. Yani mum gövdesi tarih boyunca olduğu gibi 11 günlük 50 SMA’nın üzerinde kapanıyor. Bunu Ocak ayının sonuna kadar bilemeyeceksiniz. Bu arada fiyat hareketi düşüş eğilimini doğruladı. Bunun 11 günlük bir grafik olduğunu unutmayın, fiyat hareketinin gelişmesi zaman alır. Bu ortaya çıktıkça ne beklenebilir: 1) Piyasa yapısına geri dönüş (soldaki son yeşil daireye bakın), yapıya geri dönüş, varlığa bakılmaksızın teyit üzerine alışılmadık bir durum değil. 2) Ralli, fiyat hareketini 100 bin dolardan 106 bin dolara, yani %20'ye çıkarır 3) Bu seviyede ticaret mevcut değildir. Bu piyasa yapısıdır. İnsanların %90'ı boğa olacak, ben tarafsız olacağım. Her zaman daha fazla onay bekleyin. 11 gün
without_worries
S&P 500 to 10,000 inside the next 4 years - December 2025
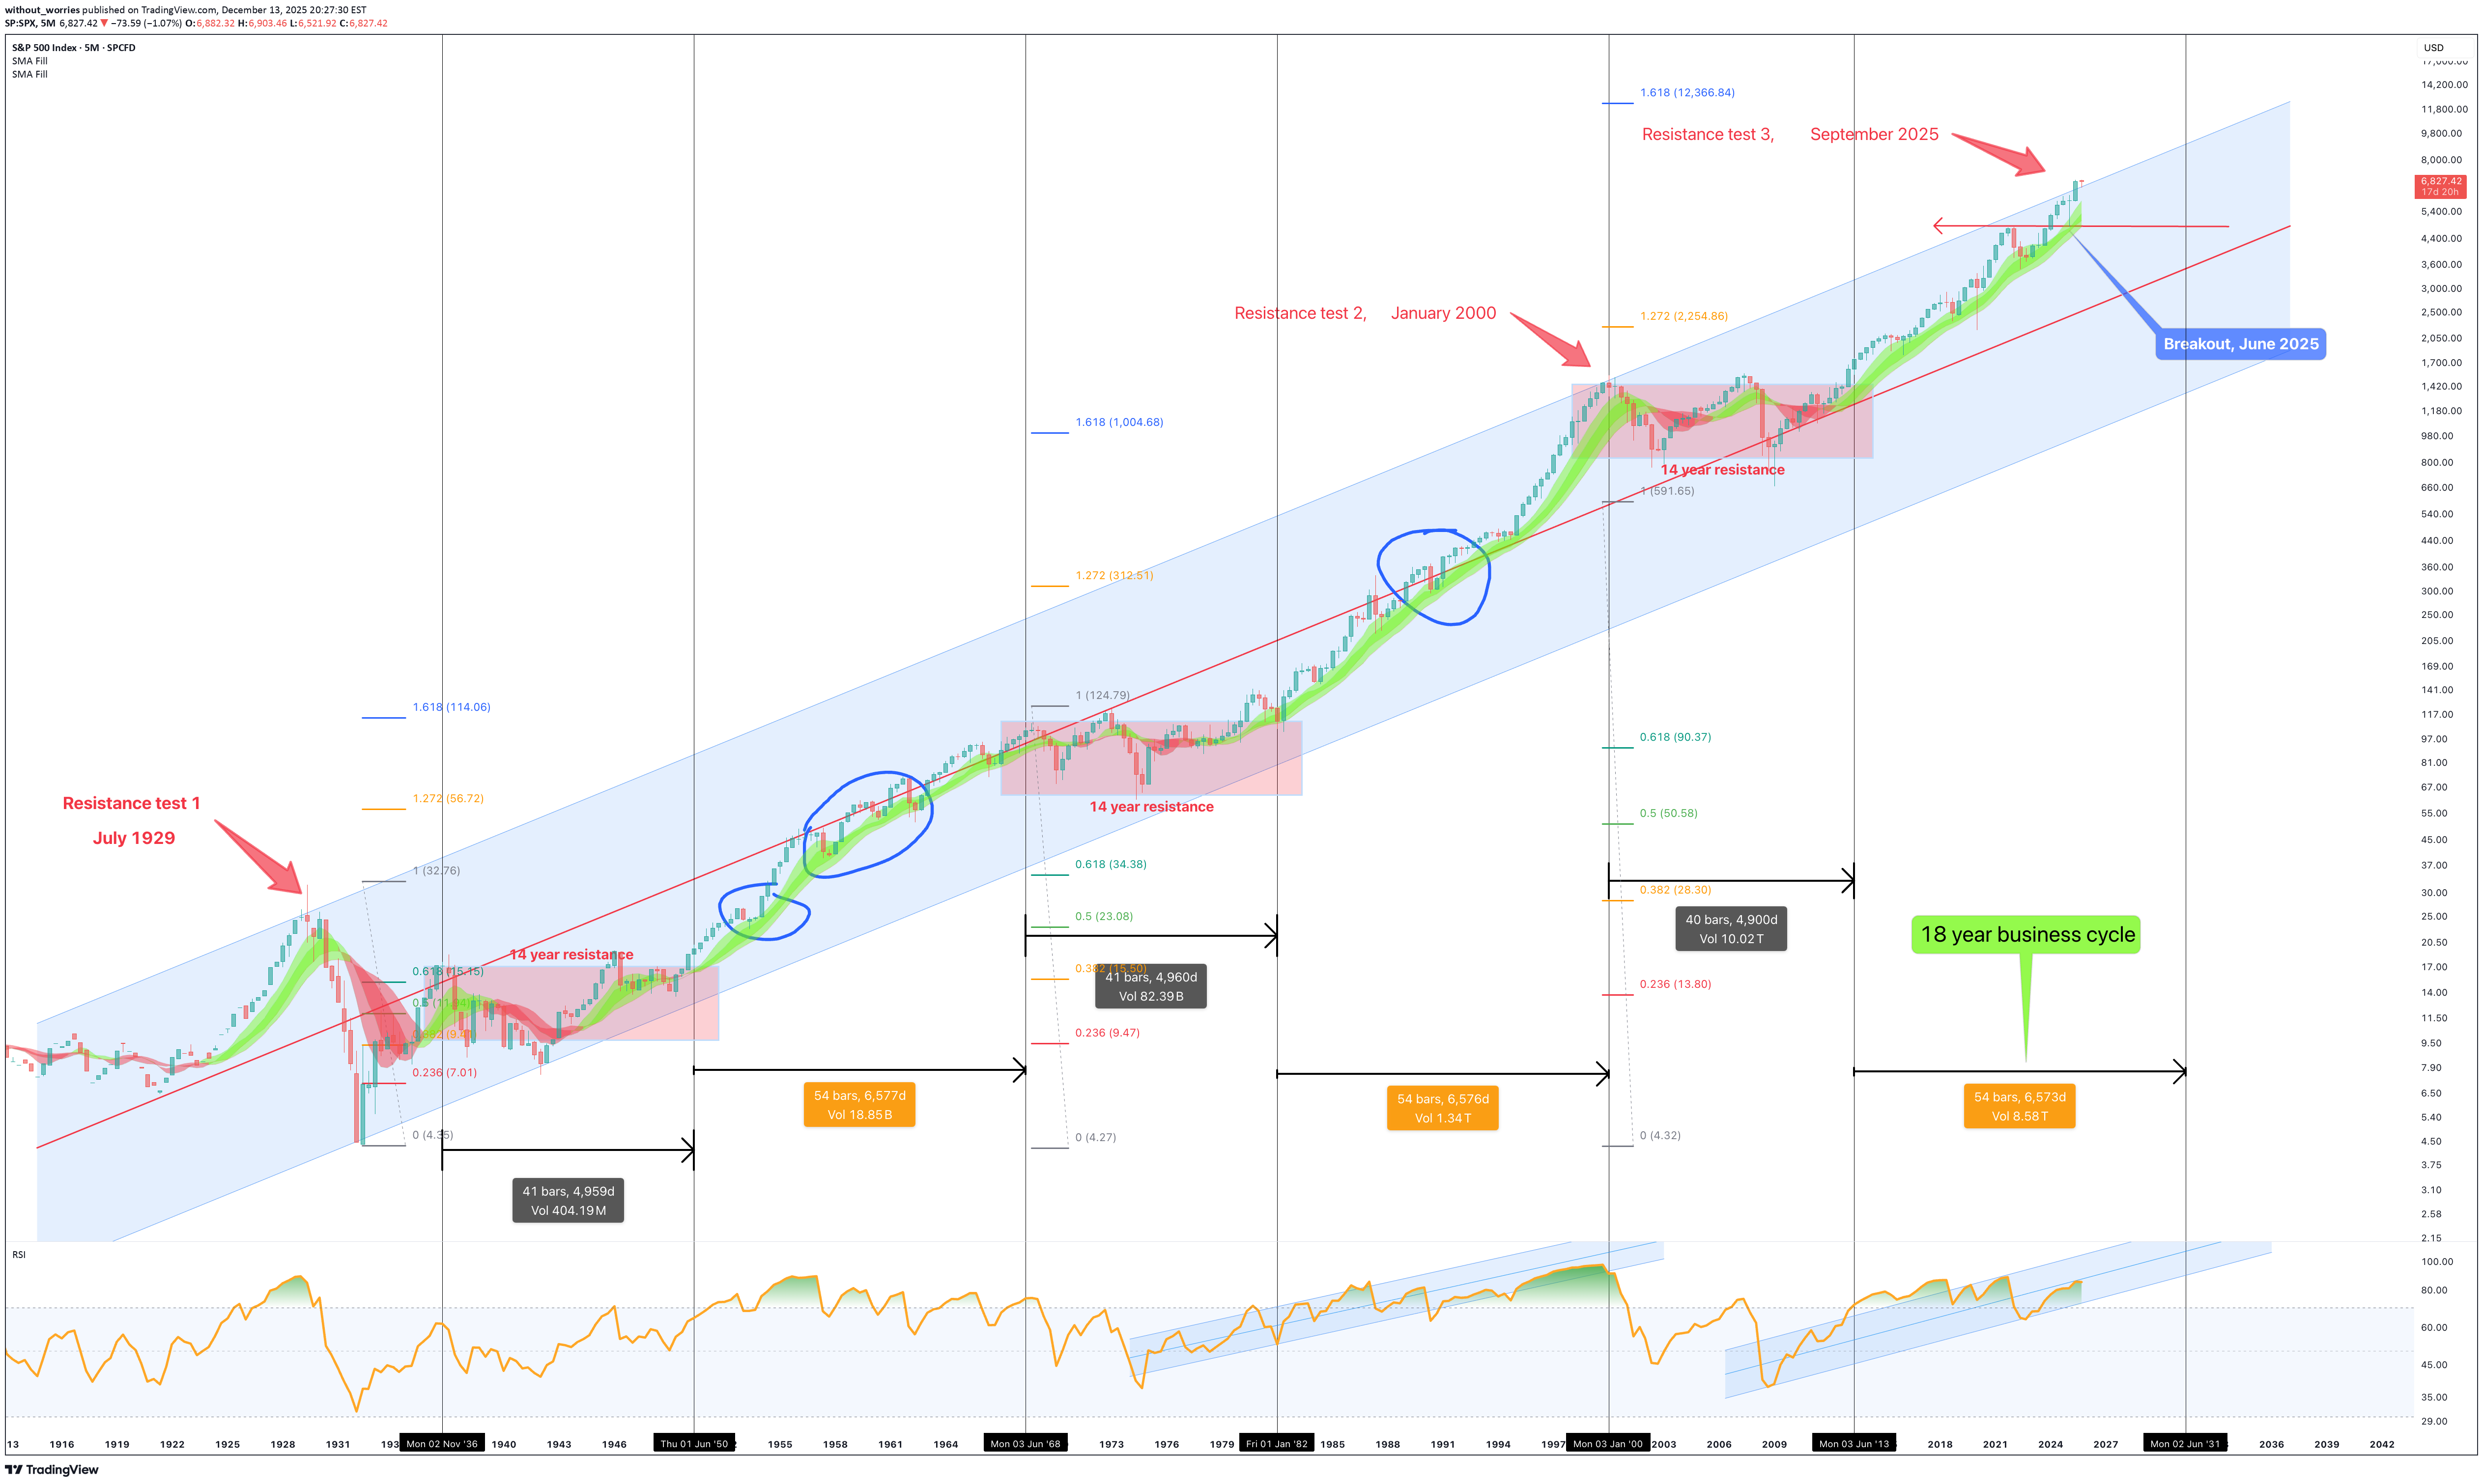
** This is an outlook for the next 3 to 4 years ** ** The bull market is not yet done, sorry bears ** Yes, read that right, 10,000 or 10k for the S&P 500. The markets shall continue to grind higher during this 10-year bear market everyone is talking about. Upwards and onwards for investors as unemployment numbers rise, graduates question the mysterious reason why their unable to land employment on the degree they just dropped $150k on; inflation runs out of control, working people struggle, the market is just not going to care. The best opportunities come at a time when you don’t have the money to invest, have you ever noticed that? The story so far A crash is coming, have you heard? Our ears are ringing out 24/7 with noise on the most predictable crash since computer user Dave reports an uninterrupted hour of use on Windows Vista. News of an AI bubble the size of Jupiter that is about to collapse in on itself and create a new star only seem to gather pace. The same finance prophets on Youtube with a hoodie in a rented flat forecasting which way the FED will move on rates. A 40 minute video to deliver a single sentence titled: “EMERGENCY VIDEO: Market collapse (MUST WATCH before tomorrow!!)”, 10 seconds in “And Today’s video is sponsored by…. ” and if it’s not a sponsorship, it’s a course they’re trying shill. Many story tellers weren’t yet out of school during the dom com crash, but they’re now they’re experts of it. Finally we have “a recession is coming” brigade. Of course it is. There’s always a recession coming. It’s like winter in Game of Thrones, they’ve been warning us for ages. Haven’t you heard? Recessions are now cancelled thanks to money printing and low interest rates. Capitalism RIP, all hale zombie companies. In summary there’s no shortage of doom and gloom. Everyone is saying it. So what am I missing? Let’s break this down as painless as possible so as not to challenge waining attention spans. You’ll need a cuppa before reading this, for the people of the commonwealth, you know of what I speak. A proper builders brew. Take your time to digest this content, there's no rush (did I mention it's a 5 month candle chart?). If you’re serious about separating yourself from the media noise to the News on the chart, then you're in for a treat. It is proper headline material. When you’re done, you'll pinch yourself, did he just tell me all this for free? What’s in it for him? (Absolutely nothing). Tradingview might bump $100 my way like Xerxes bearing gifts, but in the end the content of this idea may radically change the way your view the market today. The contents: 1. Is the stock market in a bubble? 2. What about this 10 year bear market people are talking about? 3. A yield curve inversion printed, isn't a monster recession is due? Is the stock market in a bubble? No. A handful of stocks are. The so-called “magnificent seven” stocks that make up about 40% of the market, Yeah, they’re in a bubble. No dispute from me there on that. It has never been riskier to be an index only fund investor. Especially if you're close to retirement. Now I’m not about to carve a new set of stone tablets explaining why, if you want the full sermon, that’s on my website. Here’s the short version: a tiny bunch of tech darlings are bending the whole market out of shape. If you’re only invested in index funds, then you’re basically strapped to the front of the roller coaster hoping the bolts hold should those seven stocks decide to puke 20% in a week. Suffice to say, a handful of stocks, tech stocks, are distorting the entire market. Index only investors are exposed to a greater risk than at any point in those past 20 years should the magnificent seven decide to sell off quickly. But what if they don’t? What if they just sell off slowly? Which is my thesis here. In the final 12 months leading up to the dot com crash, during the 1999-2000 period, the Nasdaq returned 160%. RSI was at 97 as shown on the 3 month chart below. Now that’s a bubble. In the past twelve months the Nasdaq has returned 20%. That’s not a bubble, that’s just a decent year. Above average, nice not insane. Yet people are acting like it’s 1999 all over again. A similar story for the S&P 500 as shown on the 3 month chart below. In the five years leading up to the crashes of 1929 and 2000 the market saw a return of 230% with RSI at 94 and 96, respectively. Today the market has returned 60% over the last 5 years with RSI @ 74. Adjusted for recent US inflation, and it’s roughly 30% real return! The two periods often recited the most by doomsayers, 1929 and 2000, exhibit conditions not found in today’s market. Fact. What about this 10 year bear market people are talking about? Warren Buffet, perhaps the most famous investor in the world, has amassed a cash pile the size of the size of Fort Knox. Legendary short seller Michael Burry is quoted as having Puts on the overbought tech stocks, that’s fair. The masses have translated all this as a short position on the stock market. It seems everyone is preparing for Armageddon. My question, why are the masses so convinced of a stock market crash? “Whenever you find yourself on the side of the majority, it is time to pause and reflect.” Mark Twain Let’s talk about the main 5 month chart above… There’s so many amazing things going on in this one chart, could spend hours talking about it. Will save that for Patrons, but the key points exist around support and resistance. You’ll remember the “ Bitcoin in multi year collapse back to $1k - December 2025 ” publication? It is of no surprise to me the Bitcoin chart now indicates a macro inverse relationship to the S&P 490 (minus tech stocks). Bitcoin is a tech stock all but in name, it follows the tech stock assets like a lost puppy. If you strip away the blotted tech sector you realise we’re in for a bumper rally in the stock market in the coming years. This happens as a result of money flooding out of the blotted tech sector (that includes crypto). These sectors are about to crash straight through the floor towards middle earth. When the masses catch on that businesses are not finding value in AI tools beyond generating cat videos on Youtube, the bottom falls out of those bankrupt entities, with hundreds of billions of dollars looking for a new home. That’s when investors pivot to value . Sometimes I feel like I’m the only one with this information when I scan through the feeds, how is this not the most obvious trade of the decade? For the first time in 96 years the S&P 500 breaks out of resistance. Why is no one else talking about this? 2025 was the year it happened and yet not a whisper. The 1st resistance test occurred in July 1929. The 2nd in January 2000. The breakout occurred in the first half of 2025 and will be confirmed by January 1st, 2026 providing the index closes the year above 6530-6550 area. 12 trading days from now. The 18 year business cycle, roughly 6574 days (the orange boxes) is shown together with the black boxes representing the 10 year bear markets in-between (14 years until past resistance is broken - pink boxes). Should you not know, The 18 year business cycle, In modern market economies (especially the US and UK), they are repeated cycles where: Land & property prices rise for about 14 years Then there’s about 4 years of crisis, crash, and recovery Together that’s roughly an 18-year land / real-estate business cycle, a pattern that is argued to show up again and again. When we remove the darlings of the stock market you find the valuation for the S&P 490 suggests that the vast majority of the US market is currently priced near a level of Fair Value relative to GDP, provided that the current economic structure persists. The high majority of influencers and financial experts talk about the end of the business cycle, there’s even “how to prepare for the crash” videos. If we look left, it is clear, the 18 year business cycle is far from over. So why are you bearish? A yield curve inversion printed, isn't a monster recession is due? There is a general assumption that recessions mean bad things for the stock market. You’re thinking it right now aren’t you? “ Of course they are Ww - everything will crash in a recession! ” Listen…. you couldn’t be more wrong. Ready for some dazzle? This level of dazzle wins your Harvard scholarships when meritocracy isn’t an option for you. And it’s free, without the monstrous loan debt at the end. Can you believe that? What if I told you the stock market does not care about recessions? Let’s overlay every US recession on the same 5 month chart. The vertical grey areas. There has been 14 US recessions over the last 96 years. The majority, that is 9 of them, occurred during a bear market. The recessions that saw the largest drop in the stock market, 1929 and 2000, were known overbought bubble periods. We know that is not representative of the current market as discussed in the first section. Here is the dazzle. Focus on the recession during the business cycles. What do you notice? The recessions during business cycles (blue circles) never saw a stock market correction greater than 10%. In other word, utterly irrelevant. Conclusions Let’s land this gently, before someone hyperventilates into their keyboard. The S&P 500 is not in a bubble. A handful of stocks are and that distinction matters far more than most people are prepared to admit. Yes, the Magnificent Seven are stretched. Yes, AI enthusiasm has reached “my toaster is sentient” levels. But the rest of the market? Strip away the tech confetti and you’re left with something far less dramatic and far more dangerous to bears: a structurally healthy market breaking a 96-year resistance. Not testing it. Not flirting with it. Breaking it. And doing so while the internet is convinced the sky is falling. This is where people get confused. They expect crashes to announce themselves loudly, with sirens and YouTube thumbnails. They don’t. Crashes arrive when optimism is universal, not when fear is a full-time job. Right now, fear is working overtime. If history rhymes, and markets are essentially drunk poets with a spreadsheet, then the evidence points to continued upside over the next 3–4 years, not a sudden plunge into a 10-year ice age. Now that does not mean straight up. Expect: Volatility Rotation Pullbacks that feel terrifying in real time and irrelevant in hindsight What it does not suggest is the end of capitalism every time the RSI sneezes. The 18-year business cycle is not complete. The long-term channel remains intact. RSI conditions are elevated but nowhere near the manic extremes seen in 1929 or 2000. Those periods were bubbles. This is not. Here’s the uncomfortable bit for many: The biggest risk right now isn’t being long. it’s being so convinced a crash is imminent that you miss the next leg entirely. Especially if you’re hiding in cash waiting for a disaster that keeps failing to show up. And before anyone shouts “What about tech collapsing?!”, yes — that’s precisely the point. If capital rotates out of bloated tech and into value, industrials, energy, financials, and boring businesses that actually make money, the index doesn’t die. It grinds higher while everyone argues about why their favourite stock stopped working. S&P 500 to 10,000 isn’t a fantasy screamed into the void. It’s the logical outcome of structure, cycles, and history, assuming capitalism doesn’t suddenly apologise and shut down. And if it does? Well, none of us will be worrying about our portfolios anyway. Ww Disclaimer =================================== This is not financial advice. It is not a signal, a promise, or a guarantee that markets will behave politely while you feel clever. Markets can remain irrational longer than you can remain solvent, especially if you’re trading leverage, emotion, or YouTube confidence. This outlook is based on historical price behaviour, long-term cycles, and observable market structure. If those conditions change, the thesis changes. Blind loyalty to an idea after the data disagrees isn’t conviction, it’s just stubbornness in a nicer font. If you’re looking for certainty, reassurance, or someone to blame later, this will disappoint you. If you’re looking for probabilities, context, and a framework that doesn’t rely on shouting “CRASH” every six months, you're welcome. Ww
without_worries
Bitcoin in multi year collapse back to $1k - December 2025
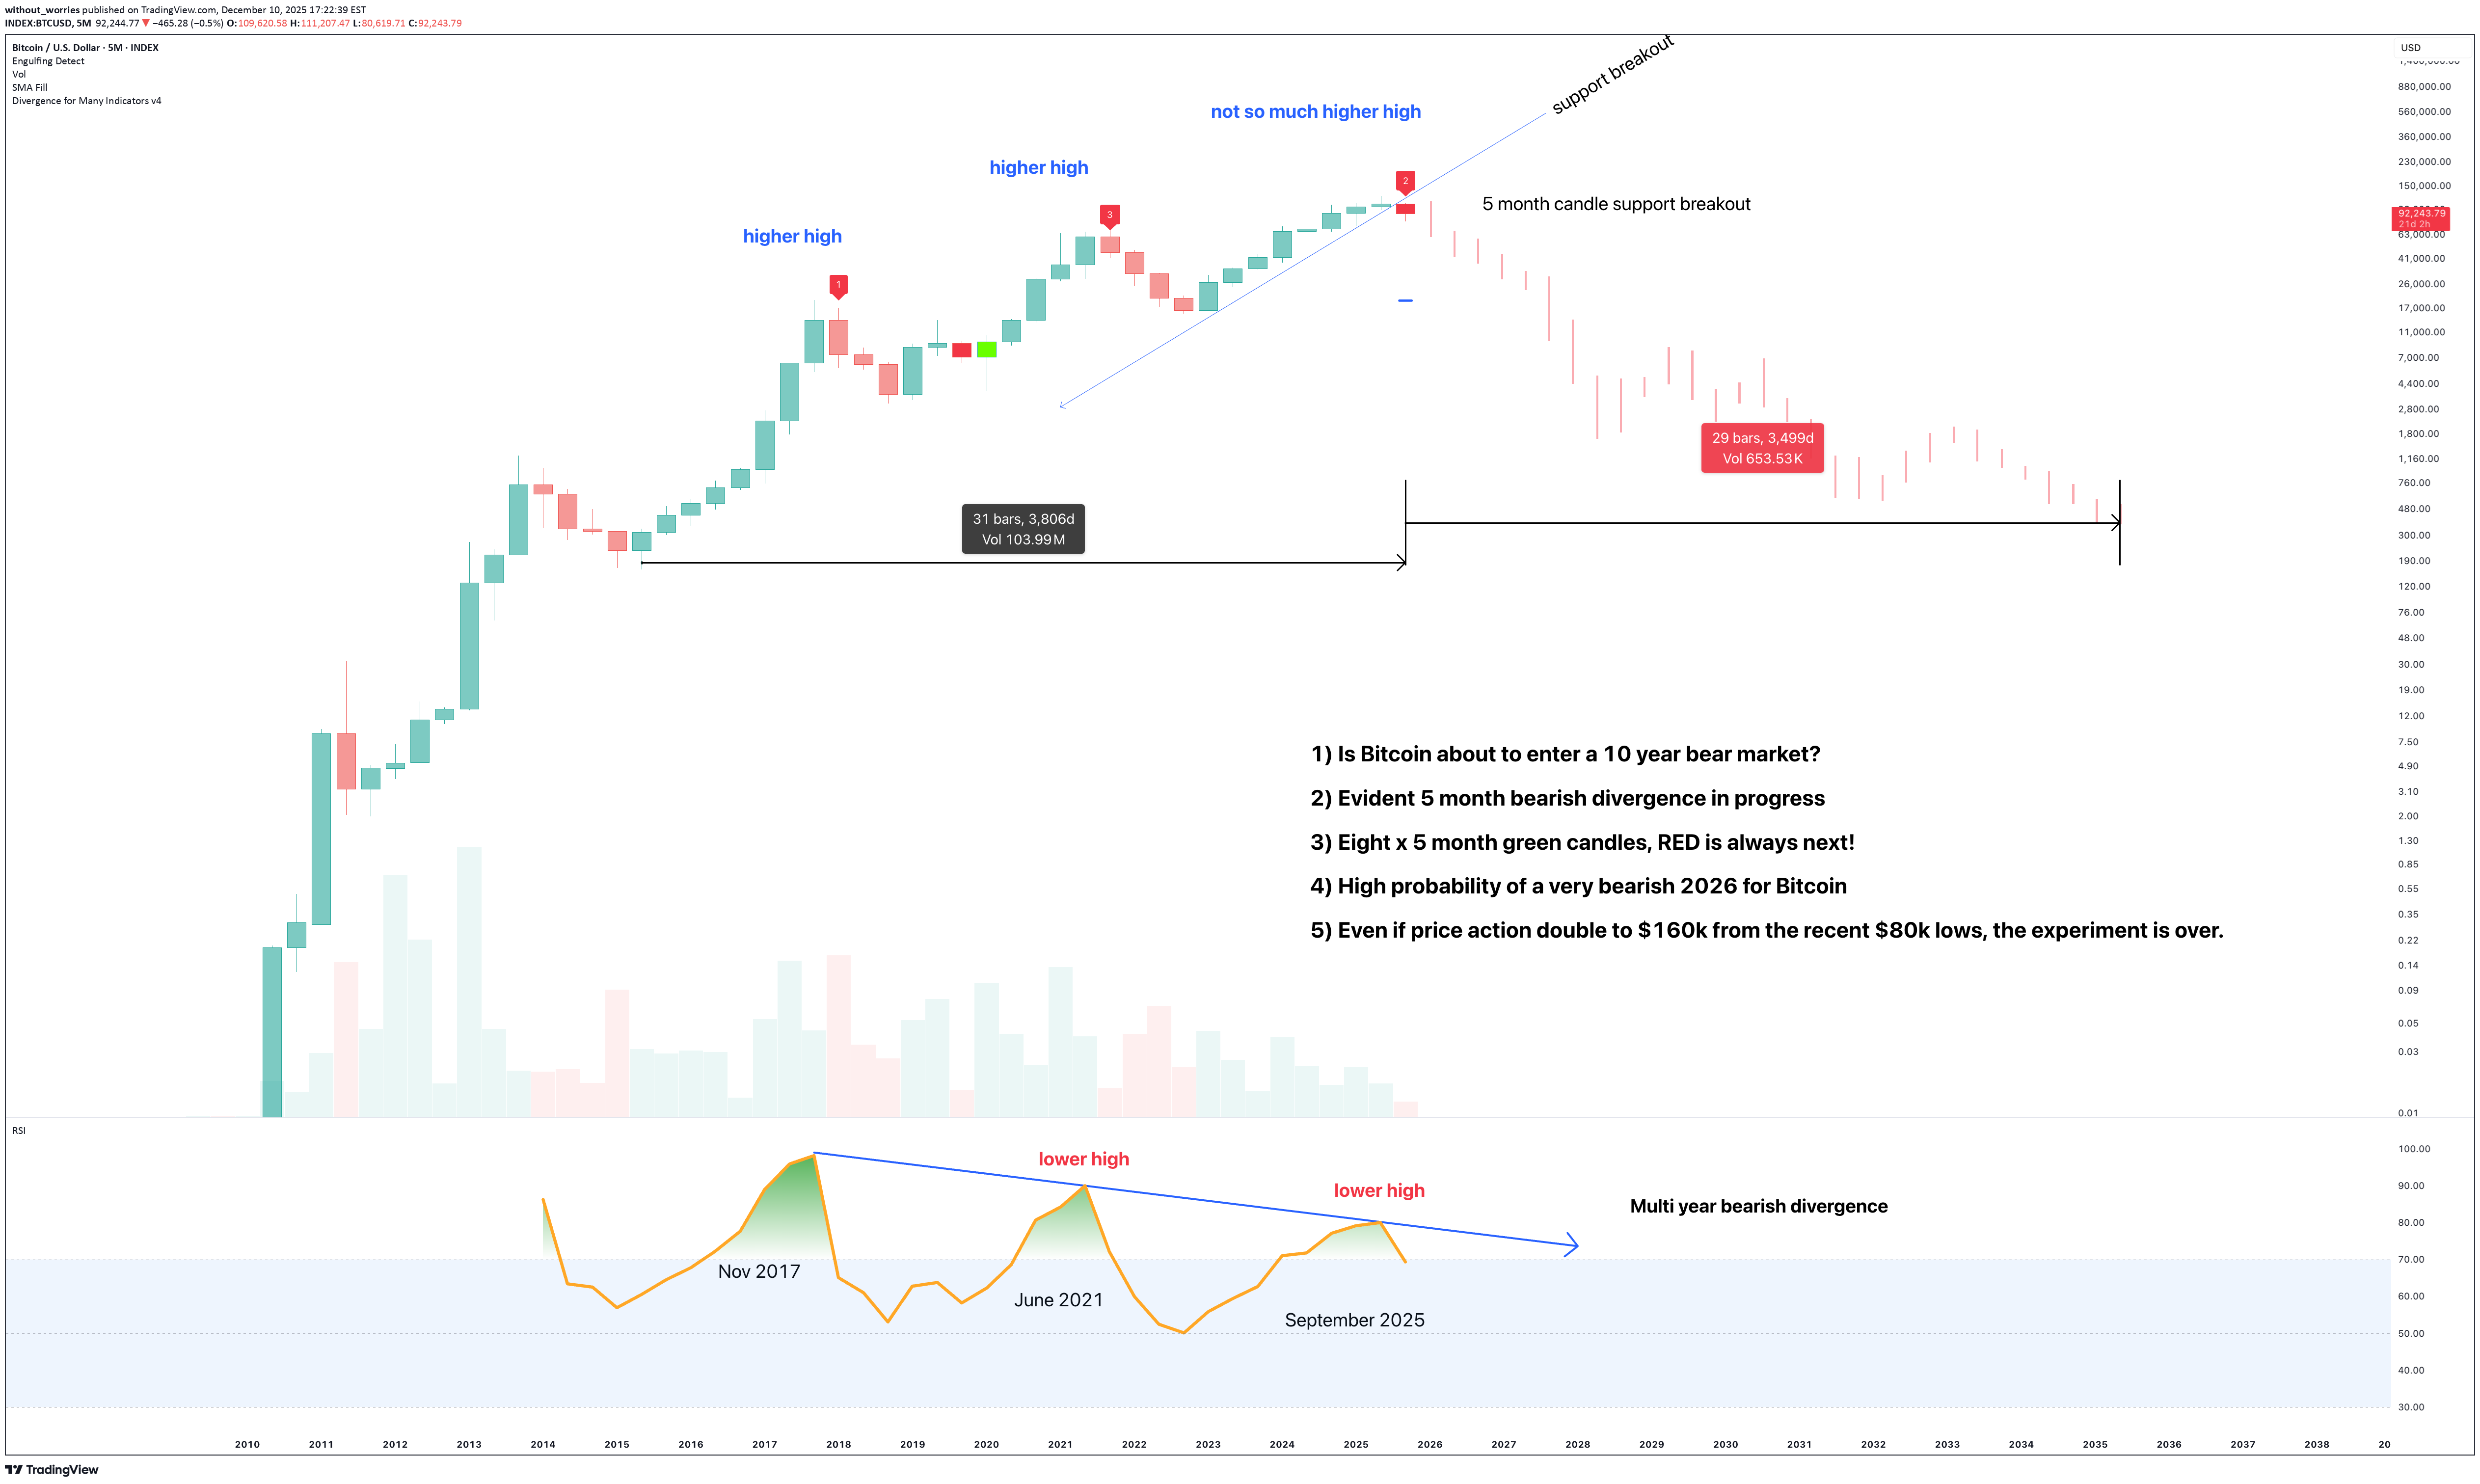
Perhaps you've noticed as have I, Media studies and Art collage students now turned financial experts flock to Youtube to inform peers of investment opportunities with the great Boomer wealth rotation that is set to land on their laps. Who would not be in disbelief at the possibility of wealth generated over generations is now at risk of being smoked on speculation in mere months. It is a real risk, and few seem to want to talk about it. Over the next 10 years wealth is expected to rotate from one generation to the next. During that time this one chart about screams "stay away". Few care to listen. Instead it's all recession talk, crash, mountains of debt, sky-high prices, and chaotic politics. Everything seems out of whack, distortion and noise as the AI tech bubble grinds on. Remember the post " Is Alt season dead? - June 2025 " when everyone was convinced of moon?, or " 3 week idea as price action broke down from $120k ". Read the comments, do you see yourself here? Shouting at the wind of sellers as your feet were lifted from the ground? Opportunities to generate significant returns in the years ahead do exist, just not not in crypto. If you stick around over the next 2-3 years, I'll show you them. But you're on your own, will not be guiding folks on every turn or daily pullback. That's for Ww homepage. Instead, this is a post to highlight the Rotation from Growth to value has already begun. Opportunities on real value, on real businesses that generate profit. That's the ticket. Not another "bearish Bitcoin post" As 2025 draws to to a close, the end of another 4 year cycle plays out perfectly. Few want to believe until that 70% correction is complete. They'll return with videos such as "It was manipulated!" or some nonsense. The truth is, a 700% return was made from the lows. That's decent. However, this cycle top was far more nefarious than price action lets on, it was the first time Bitcoin closes last year of a bull market at a lower price than the year began! Let that sink in for a moment. Still not sinking? 1) In the last year of a Bitcoin bull market, usually the most bullish year of the 4 year cycle, price action would nearly double. 2) Seriously. Look left. 2013, 1017, 2021, er 2025 hello. Did you try switching it off and on again? The end of the Bitcoin experiment Okay, the last year of a Bitcoin bull market, price action closed lower. That's not FUD, that's fact. It is the first time in the history of Bitcoin price action that has seen a lower close during the last year of the bull market. Think about that for a moment. That's not adoption, that's gravity gripping maxis by the ankles. The Bitcoin white paper implied a future that creates a globally accessible financial infrastructure. One that aims to give everyone equal opportunity to access a neutral monetary network, regardless of nationality, credit history, or status. Instead why we got was laser eyes and individuals who amassed chunks of the circulating supply. That's arguably more centralised than the US dollar! Since most dollars today exist outside of the US, not in it. (Wait until those dollars come flooding back home, that'll be an entertainment not even a Netflix Warner Bros combo could create). A significant bearish divergence prints On the above 5 month chart we have a higher high matched with a lower high in RSI. Same settings used on the divergence tool. There are now 21 days remaining of the year for that 5 month candle to print. If history is our teacher, two more red candle prints will follow. That's basically all of 2026 to be red. Not just a little bit red, but a scene so bloody even Quentin Tarantino uses the black and white filter. Conclusions, (or how to lose a fortune and blame the illuminati) Right. So to wrap this up for anyone still listening. We’ve established that the world’s gone mad. We’ve got people who until recently thought a “bear market” was a poorly attended gay pride event in the woods now lecturing you on monetary policy from their mum’s box room. The great Boomer wealth handover is coming, and it’s shaping up to be the biggest game of Hot Potato with Grandparents lifesavings. And your entry ticket is a magic internet bean that just had its worst party year *ever*. The facts, for those who enjoy them: 1. Bitcoin just wet itself. In the final, supposedly explosive year of its bull run, it closed *lower*. That’s like the finale of a fireworks display being a single, sad squeaker from a party popper. History screamed “double!”, 2025 whispered “...meh.” 2. The dream is a meme. The promise was a noble, decentralised utopia. The reality is laser eyed influencers and a supply more concentrated than a Kardashian’s self tanner. It’s not a revolution; it’s a pyramid scheme with better graphics. 3. The chart is screaming get out. A macro bearish divergence is printing. In layman's terms, the engine is smoking, the wheels are coming off, and the satnav is politely suggesting, for the 21st time, “At the next available opportunity, please turn the $§%$ around.” So, what’s the takeaway? This isn’t FUD. It’s an intervention. While the world is distracted by AI chatbots writing sonnets and political circuses, real value is quietly shifting. It’s not in speculative digital tokens; it’s in actual, boring, profit-making businesses. I know, double yawn, but the rotation has begun. You can still make 5-10x on stock positions if you chose wisely, manage risk, and are above all… are patient. That means no more 4hr charts and screaming day traders on Tik Tok. Ww Disclaimer ========================== This isn’t financial advice. I’m a bloke with a chart, not a wizard. I’m patiently waiting for Tradingview Mods to elevate me to that status. Nudge nudge. I could be utterly, spectacularly wrong. Bitcoin could moon tomorrow, propelled by a tweet from a billionaire who owns too much of it. You might buy a business that makes widgets and it goes bust because widgets become passé. That’s your gamble. My only point is this: when the history books are written about this period, the chapter won’t be called ‘The Genius of the Crypto Bros.’ It’ll be called ‘The Great Distraction,’ and it’ll sit right between “Tulip Mania” and “That time we all bought NFTs of Monkeys.” The real opportunity isn’t where the hype is. It’s where the silence is. And right now, that's not crypto. Now, if you’ll excuse me, I’m off to invest in something sensible. Probably tinned goods and shotgun shells. You know, real value.
without_worries
هشدار جدی: آیا بیت کوین تا نوامبر ۲۰۲۵ به سقوط ۵۶ هزار دلاری نزدیک است؟
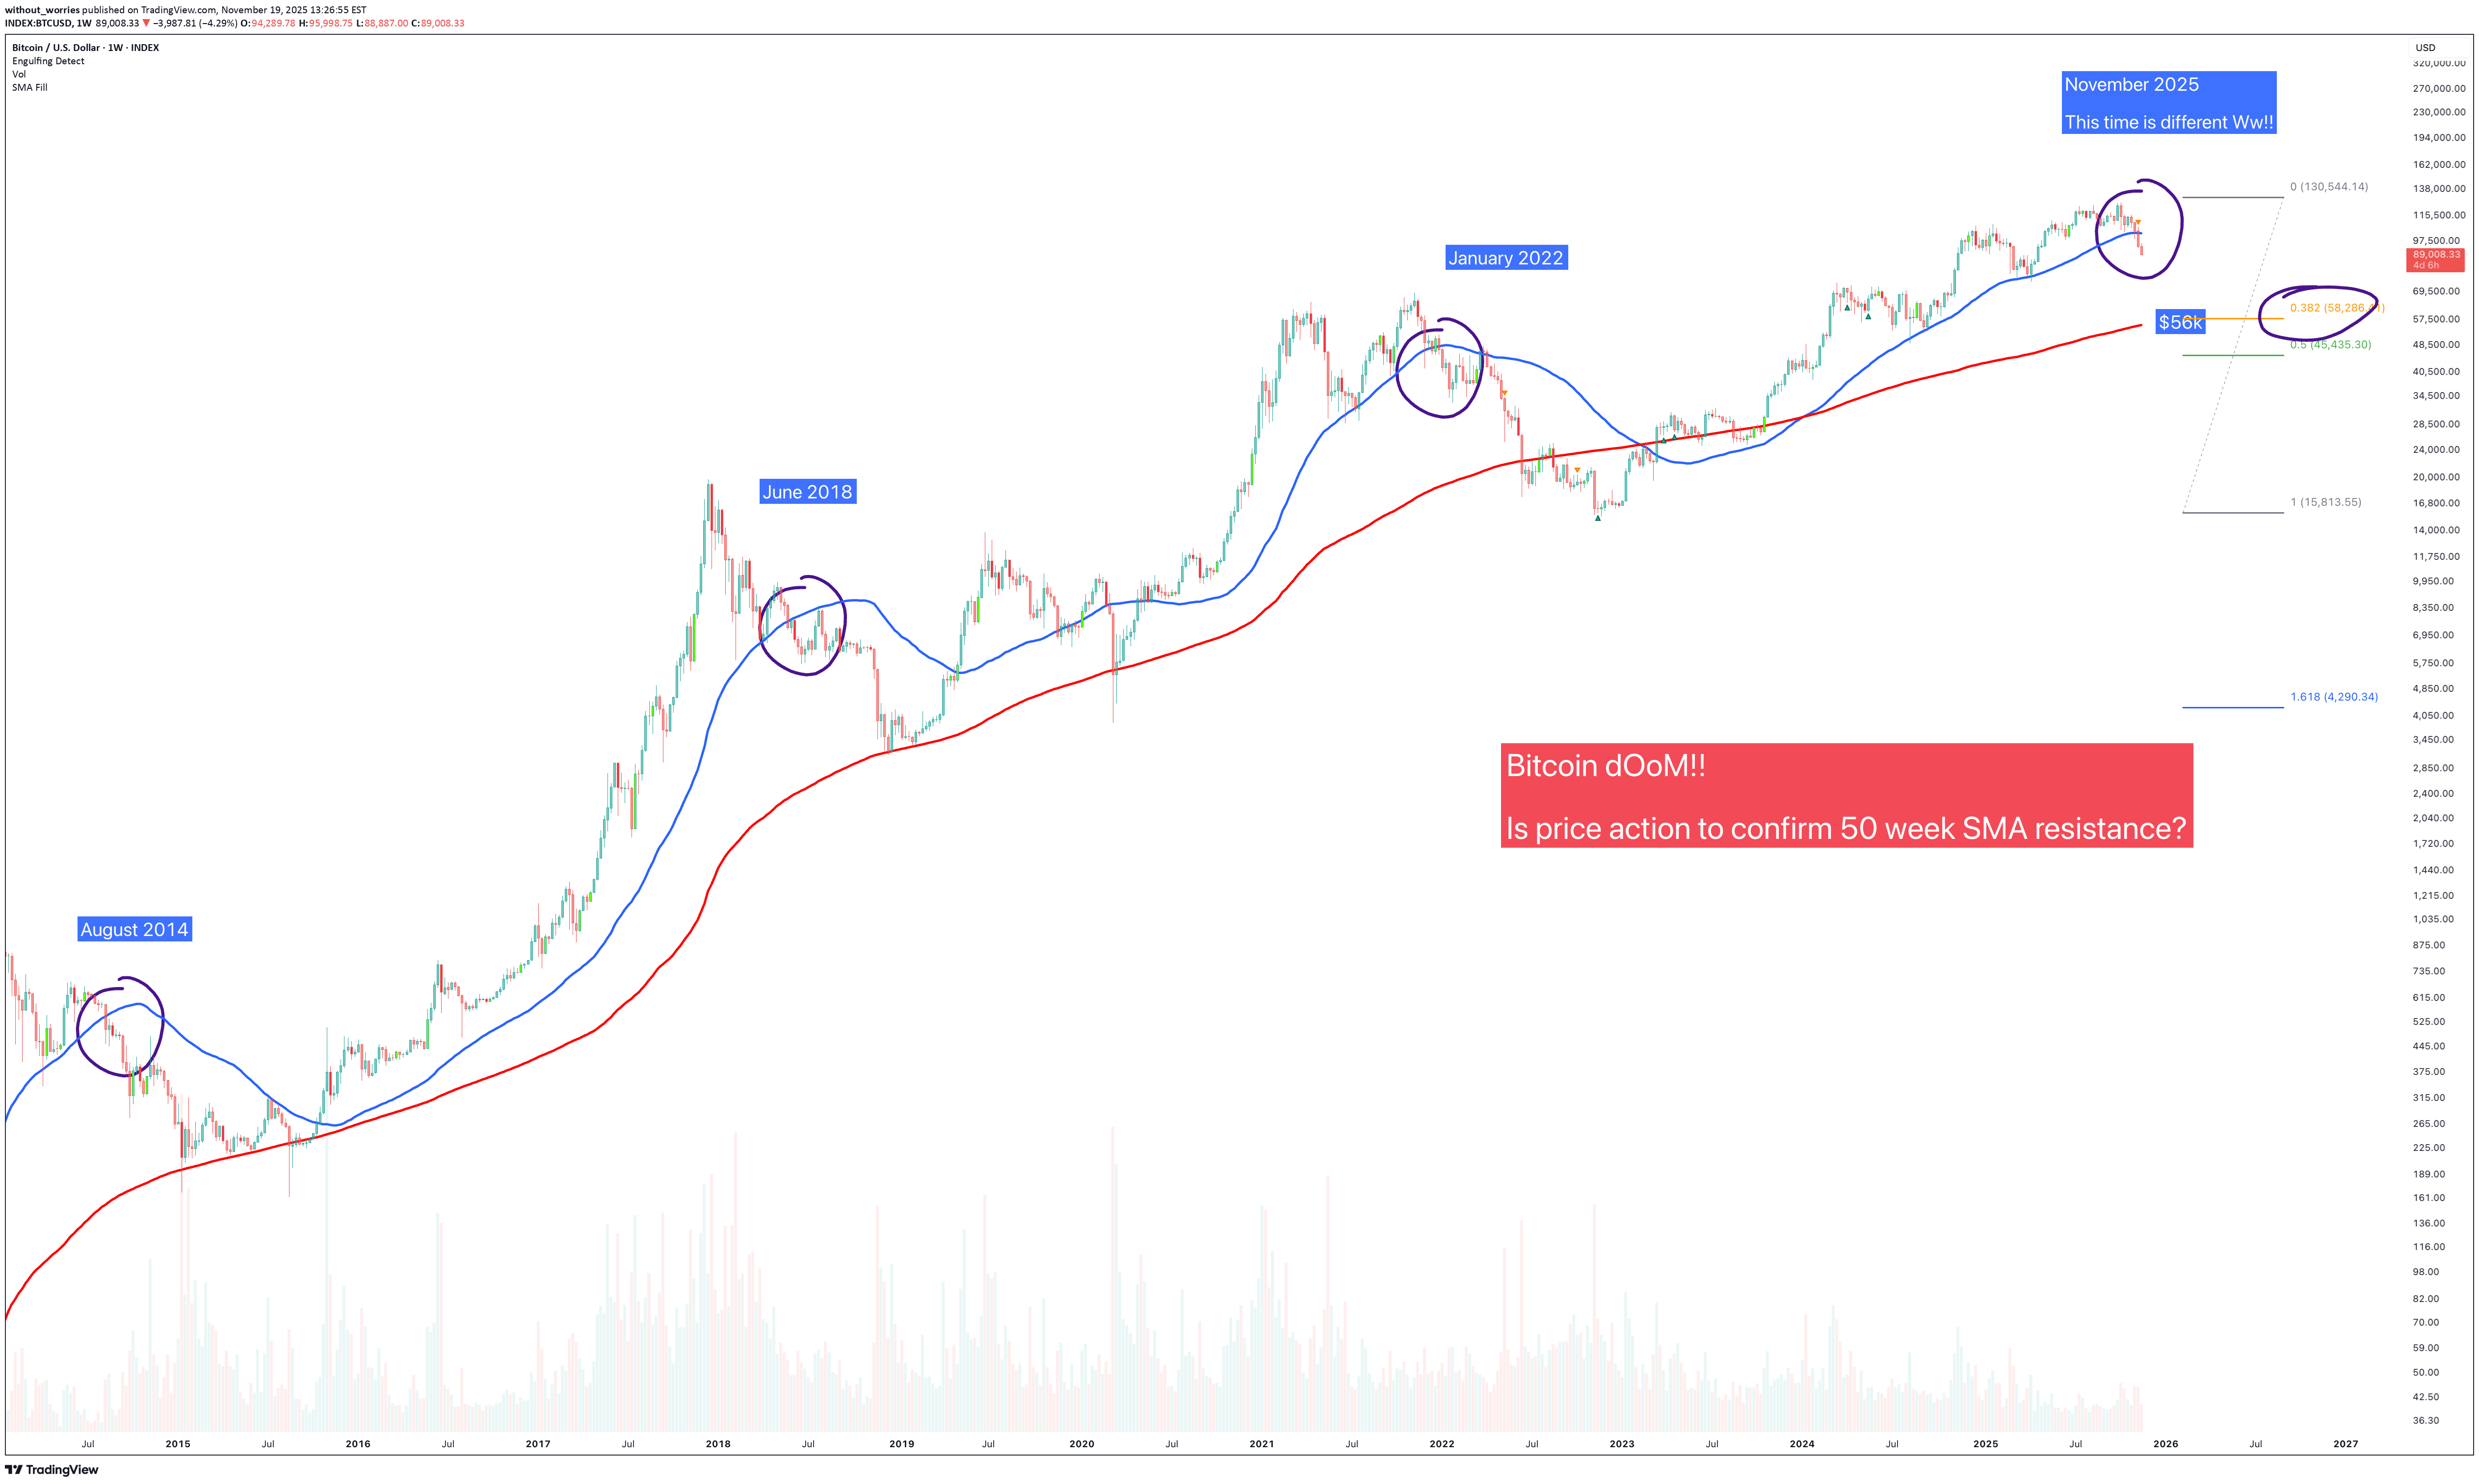
Yukarıdaki grafik, fikir isteyen birçok kişi tarafından dikkatimi çekti. İşte burada... unutmayın, ben sadece bir haberciyim, hedef antrenmanı değil. Yukarıdaki haftalık grafikte gösterilen fiyat hareketi 50 haftalık SMA'nın altında kapandı ya da bana öyle söylendi. "Bu kadar mı? Şu anda Ww'de en üstte mi?" İki hareketli ortalama kullanıyorsanız sola bakın: 50 haftalık SMA (mavi) 200 haftalık SMA O halde sizin için zirve hazır. Bitti, eve gidin. 15 bin dolardan uzun pozisyonlara girenlere çıkış likiditesi sağladığınız için kendinizi bir kez daha tebrik edin. Sonsuz teşekkürlerinizi bekliyorlar. Gürültü nedir? Bitcoin tarihi boyunca, 50 haftalık SMA altında her fiyat hareketi kapandığında 200 haftalık SMA testi gerçekleşti. Bu tartışmaya açık değil, bu bir grafik gerçeği. Bugün bu, aynı zamanda Fibonacci 0,38 olan 56 bin dolarlık son derece öngörülebilir bir test olacaktır. Bu tahmin birçok insanı üzecek. Etkileyiciler onlara servet ve zafer hikayeleri vaat etti. Bunun yerine temel ekonomi dersi aldılar ama bunun için 50.000 dolar ödemek zorunda kaldılar. Aptallığın için para iadesi almıyorsun, değil mi? Bu sefer farklı mı? Şu anda bunu söylemek mümkün değil. Birçoğu grafiğe bakıp vazgeçebilir, artık yeter. Bu bir hata olurdu. Neden? Onay. Sola bak. Daima sola bakın. 24 Kasım Pazartesi gününe kadar 50. hafta tatilinin onaylanıp onaylanmadığı bilinmiyor. Gerçekten de, daha yakından bakarsanız, fiyat hareketi aslında 50 haftalık SMA'nın altındaki haftalık mum gövdesini kapatmadı, bunun üzerinden kapandı. Bu önemli. Bugün Ocak 2022 Onayı Haziran 2018 Onayı Ağustos 2014 Onayı Sonuçlar İşte yine buradayız, Bitcoin uçurumun kenarında duruyoruz, etki sahibi kişiler "boğa piyasası!" diye slogan atıyor. sanki bu bir dinmiş gibi ama yine de... o iğrenç küçük mavi çizgi var. 50 haftalık SMA kapsamındaki fiyat hareketi hiçbir zaman iyi bitmedi. Bir kez değil. İstisnasız her seferinde bunu 200 haftalık SMA'ya doğru rahat bir yolculuk izledi. Tarihsel olarak, Bitcoin'nin yaptığı budur, red bir şeye çarpana kadar düşer ve pahalı görünür, sonra herkes şaşırmış gibi davranır. Peki bugün bu seviye nerede? Yaklaşık 56 bin dolar. Tam Fibonacci 0.38'de. Matematikte yerçekimi gibidir. Ancak meşaleleri yakmadan ve "Ww'nin düşüşe geçtiği" mesajlarını başlatmadan önce sakin olun. Mum henüz onaylanmadı. Doğru, bunun gerçek bir anlaşma mı yoksa 110.000 $'dan satın alındığından bu yana hayatınızdaki her kararı sorgulamanızı sağlayacak başka bir sahtekarlık mı olduğunu öğrenmek için 24 Kasım Pazartesi gününe kadar vaktiniz var. Sola bak. 50. hafta boyunca fiyat her kapandığında aynı story oynandı: Ağustos 2014: kaza. Haziran 2018: kaza. Ocak 2022: kaza. Temelde Bitcoin'in Groundhog Day versiyonu, ancak Bill Murray ya da mutlu son olmadan. Bu çizginin altını onaylarsa, işte bu kadar. 200 haftalık SMA mıknatıs haline gelir. Aksi takdirde biz geri döneceğiz, etkileyiciler geri dönecek ve herkes kendisini başından beri bildiğine inandıracak. Her iki durumda da "kıyamet" demiyorum. Sadece diyorum ki, matematik işe yarıyor. Vay Sorumluluk reddi beyanı =============================================================== Bu finansal tavsiye değil. Açıkça. Piyasanın çöküşü konusunda espri anlayışı olan bir adamdan yatırım ipuçları alıyorsanız, karar verme sürecinizi yeniden değerlendirmek isteyebilirsiniz. Burada satarsanız ve bu artarsa bu sizin sorumluluğunuzdadır. Eğer tutarsan ve düşerse, bu da senin suçun. Eğer "piyasa manipülasyonunu" suçluyorsanız tebrikler, 2017'den bu yana kriptodaki tüm kaybedenleri tanımlamış oldunuz. Kristal bir kürem yok, sadece grafikler var ve insanlar yalan söylese bile yalan söylemiyorlar. Yani Bitcoin 56 bin dolara düşse, ya da 160 bin dolara yükselse ya da "Hopium"da ödeme almaya başlasa da, elimde çay, sırıtarak hala burada olacağım ve yorumların "Yanılıyormuşsun!" ile dolmasını izleyeceğim. asla haklı olmayan insanlardan. Endişelenmeden (Ww)“Yukarıya değil sola bakın.”S&P 500 şu anda 6630 seviyesinde; Eylül ortasındaki fiyatla aynı. Kaza değil. O zaman Bitcoin 118 bin dolardı -40 bin dolar, evet... bu bir kaza. Borsa = 1 Kripto spekülasyonu = 0
without_worries
هشدار بزرگ: بازگشت کانال قرمز نابودی به سهام مایکرواستراتژی (MSTR) در نوامبر ۲۰۲۵!
Ah, MicroStrategy…. yarı yazılım şirketi, yarı Bitcoin kültü olan hisse senedi. Ne zaman normal bir teknoloji firması gibi davranacağını düşünseniz, Michael Saylor bir sırıtışla, bir milyar dolar daha borçla ve "marj çağrısı" kelimesini hiç duymamış bir adamın inancıyla ortaya çıkıyor. Ve işte buradayız, Kasım 2025'te Red Kanal Geçişine bakıyoruz. Kulağa uğursuz geliyor değil mi? Sun novası super olmadan önce NASA'nın uyaracağı bir şey gibi. Déjà Vu: Şubat 2022 Merhaba Diyor Sola bak. Fiyat hareketinin red kanalına geçtiği son tarih Şubat 2022'ydi. Piyasa yapısı bozuldu. Fiyat düştü. Sahipler dua etti. Ve tam da herkes her şeyin bittiğini düşündüğü sırada sinsi satıcılar yerçekimi kadranını 2G'ye çevirdi. Şimdi buna geri döndük. Kasım 2025, aynı geçiş, aynı kurgu, aynı “bu sefer farklı” saçmalığı. X'teki her etkileyici, sanki bir roket emojisi eklemek bir şekilde olumsuz momentumu düzeltiyormuş gibi zaten "Düşüşü satın alın 🚀" yazıyor. Teknikler Yeşil kanal sakin suları, yükseliş trendini, mutlu zamanları ve Saylor'ın kârla jet satın almasını temsil ediyor. red kanalı bunun tersidir. Akşamdan kalmalık başladığında bunun şekersiz olmadığını fark etmen gibi Red Boğa. MSTR'nin bu red bölgesine her girişi, bunun tek bir anlamı vardı: Kırık piyasa yapısı, %50–70 düzeltme, Toplu inkar aşaması. Şu anda grafik, 240 dolar civarındaki yapısal desteğin altına düştükten sonra aynı red geçişini tekrar gösteriyor. Bu noktada hâlâ “Aya” diye bağırıyorsanız… yani o roket aylar önce patladı. RSI ve duyarlılık RSI düğündeki bir sarhoştan daha hızlı değişiyor. İvme tükendi ve geriye kalan, eşlerine "bunun uzun vadeli bir değer deposu" olduğunu açıklayan çanta sahipleri. Öyle değil. Kripto bağımlılığı olan bir teknoloji hissesi. Peki bundan sonra ne olacak? Geçmişe bakılacak olursa, ki genellikle öyledir, fiyat hareketi Şubat 2022 sonrasında yaşadığı kaderin aynısına doğru gidiyor: İlk olarak, umutlu olana doğru kısa süreli bir sıçrama. Sonra, yavaş, ezici bir umutsuzluğa doğru iniş. 80-100 dolar bölgesine doğru bir geri çekilme, önceki döngü davranışına mükemmel bir şekilde uyum sağlayacaktır. Ve eğer Bitcoin kendi Gauss ayı eğilimini doğruluyorsa, diyelim ki Michael Saylor'ın "elmas ellerden" daha fazlasına ihtiyacı olacak, bir terapiste ihtiyacı olacak. Bunun gerçekleşmesinden önce fiyat hareketinin, bozuk piyasa yapısını doğrulamak için 300 dolarlık alanı test etmesini bekleyebilirsiniz. Bugün fiyat hareketi önemli ölçüde aşırı satışta, bu fikir ancak geçmiş destekteki direnç onayının ardından doğrulanıyor . Başlığı geçmekte zorlananlar için bunu kalın harflerle yazdım. Tik-Tok'u suçluyorum Sonuçlar Her döngüde aynıdır story: 1. MSTR yapıyı bozar. 2. red kanalı görünür. 3. Herkes paniğe kapılır. 4. Sonra sessizlik gelir. Tek değişken, marj çağrıları gelmeye başlamadan önce Saylor'ın kaç tane motive edici tweet atabileceğidir. Bu düzen yeni değil, nadir değil ve yükselişe yönelik değil, insanlar manevi bir savaşmış gibi davranırken sadece matematik işini yapıyor. Yani evet, red kanal geçişi geri döndü. Aynı film. Farklı yıl. Ekstralar açısından yine de kötü bitiyor. Vay Sorumluluk reddi beyanı ================================================================== Açıkçası bu finansal bir tavsiye değil. İnternetteki bir yabancının size, Bitcoin üzerinde kumar oynamak için borç alınan parayı kullanarak bir şirket satın almamanızı söylemesine ihtiyacınız varsa, aldığınız portföyü hak ediyorsunuz. Eğer pompalanırsa, kredi alacaksınız. Eğer düşerse, FED'i suçlayacaksınız. Her iki durumda da burada "ben söylemiştim" deme arzumu sınırlamış olacağım.
without_worries
صلیب مرگ بیت کوین: آیا نوامبر ۲۰۲۵ پایان جهان ارزهای دیجیتال است؟
Bir Ölüm Haçı. Kulağa korkunç geliyor değil mi? Düşük bütçeli bir korku filminden fırlamış gibi. Burada, en karanlık Bavyera'da, İsa'nın her T kavşağında çarmıha gerildiğini görmeden on dakika araba süremezsiniz, bu neredeyse yerel logodur. Avusturya sınırını geçtiğinizde sayılar, boğa koşusundaki kaldıraçlı tüccarlar gibi çoğalır. Lovely. Ama bu? Bu gerçek ölüm haçıdır. Ya da en azından piyasa böyle düşünüyor. Déjà vu… üçüncü kez Bu yazıyı üçüncü kez yazıyorum. Ve evet, her zaman maksimum korkudadır. Her döngü aynı: İnsanlar paniğe kapılıyor, memler uçuyor ve bir yerlerde birisi "Bu sefer farklı" diyor. Spoiler: öyle değil. Nostaljik hissediyorsanız grafikte mor okların işaret ettiği küçük üçgenlere tıklayın. önceki yazıları göreceksiniz. O zamanlar da eleştirmenler sıraya girmişti, Allah razı olsun. Arka planda yüksek sesler, küçük cüzdanlar ve annemin sesi duyulabiliyor "Akşam Yemeği!". 7 Nisan 2025 Ölüm haçı 18 Ağustos 2024 Ölüm haçı 17 Kasım Ölüm Haçı Yukarıdaki 1 günlük grafikte sinyalin 17 Kasım'a kadar basılması bekleniyor. İşte o zaman 50 günlük SMA (mavi), 200 günlük SMA'nın (red) altını geçiyor ve fiyat hareketi 200 günlük çizginin altında bulunuyor. Bu, annenizin "Kızgın değilim, sadece hayal kırıklığına uğradım" demesinin teknik versiyonudur. Bu tahmin, önceki kesişmelere uygulanan Trigg & Leach yöntemini kullanıyor ve boğa piyasası başladığından beri her seferinde çivilenmiş durumda. Daha yakın Uzaklaştırılıyor.. Pazarın zirvesine ulaşma süresi: yaklaşık 59 gün İşte zekice kısım, ya da benim deyimimle, kimsenin okumadığı sıkıcı matematik. Tarihsel olarak her Death Cross'tan sonra Bitcoin zirveye çıkmadan önce toparlanırdı. Çapraz ve pivot arasındaki süre daralıyor: 1. Döngü → 179 gün 2. Döngü → 131 gün 3. Döngü → 99 gün Biraz aritmetik ilerleme uygulayın; bu, "farkı bulun ve bunun bir anlamı varmış gibi davranın" demenin süslü bir yoludur. Fark 1: 131 − 179 = −48Fark 2: 99 − 131 = −32Ortalama fark = −40 Yani 99-40 = 59 gün. Bu, potansiyel döngünün Ocak 2026'nın ortalarında zirveye çıkacağını gösteriyor ve bunu bilmiyor musunuz, Ocak ortasındaki satışlar, kötü YouTube küçük resimlerinden daha eski bir Bitcoin gelenektir. Sonuçlar Yani evet, bir Ölüm Haçı geliyor. Manşetleri, dramayı ve Fibonacci seviyelerini kutsal metinlermiş gibi açıklayan X adamını izleyin. Sola bak. Bu her gerçekleştiğinde aynı şekilde sonuçlanıyordu: panik, sıçrama, umutsuzluk, iyileşme. Durulayın, tekrarlayın. Matematik bir sonraki zirve için Ocak 2026'nın ortasını gösteriyor ve ardından yer çekimi devreye giriyor. Her şey planlandığı gibi giderse harika. Değilse, bunu "TradingView'de neden kimseyi dinlemiyorum" başlıklı büyüyen klasörünüze ekleyin. Vay Sorumluluk reddi beyanı ============================================================== Bu finansal tavsiye değil. Ben senin fon yöneticin, rahibin ya da annen değilim. Eğer iki dalgalı çizgi kesiştiği için Bitcoin'te her şeyi yaparsanız bu sizin hatanızdır, benim değil. Eğer pompalanırsa, "her zaman biliyordum" diyeceksiniz. Eğer düşerse, "piyasa manipülasyonu" diye tweet atacaksınız. Her iki durumda da ben hâlâ burada olacağım, çay içip yorum kısmına güleceğim. Yani evet bu bir Ölüm Haçı. Ama rahatla. Bu sadece bir tablo, Vahiy Kitabı değil. Ahmen
without_worries
هشدار جدی به بیت کوین: آیا کانال گاوسی نوامبر ۲۰۲۵ پایان صعود است؟
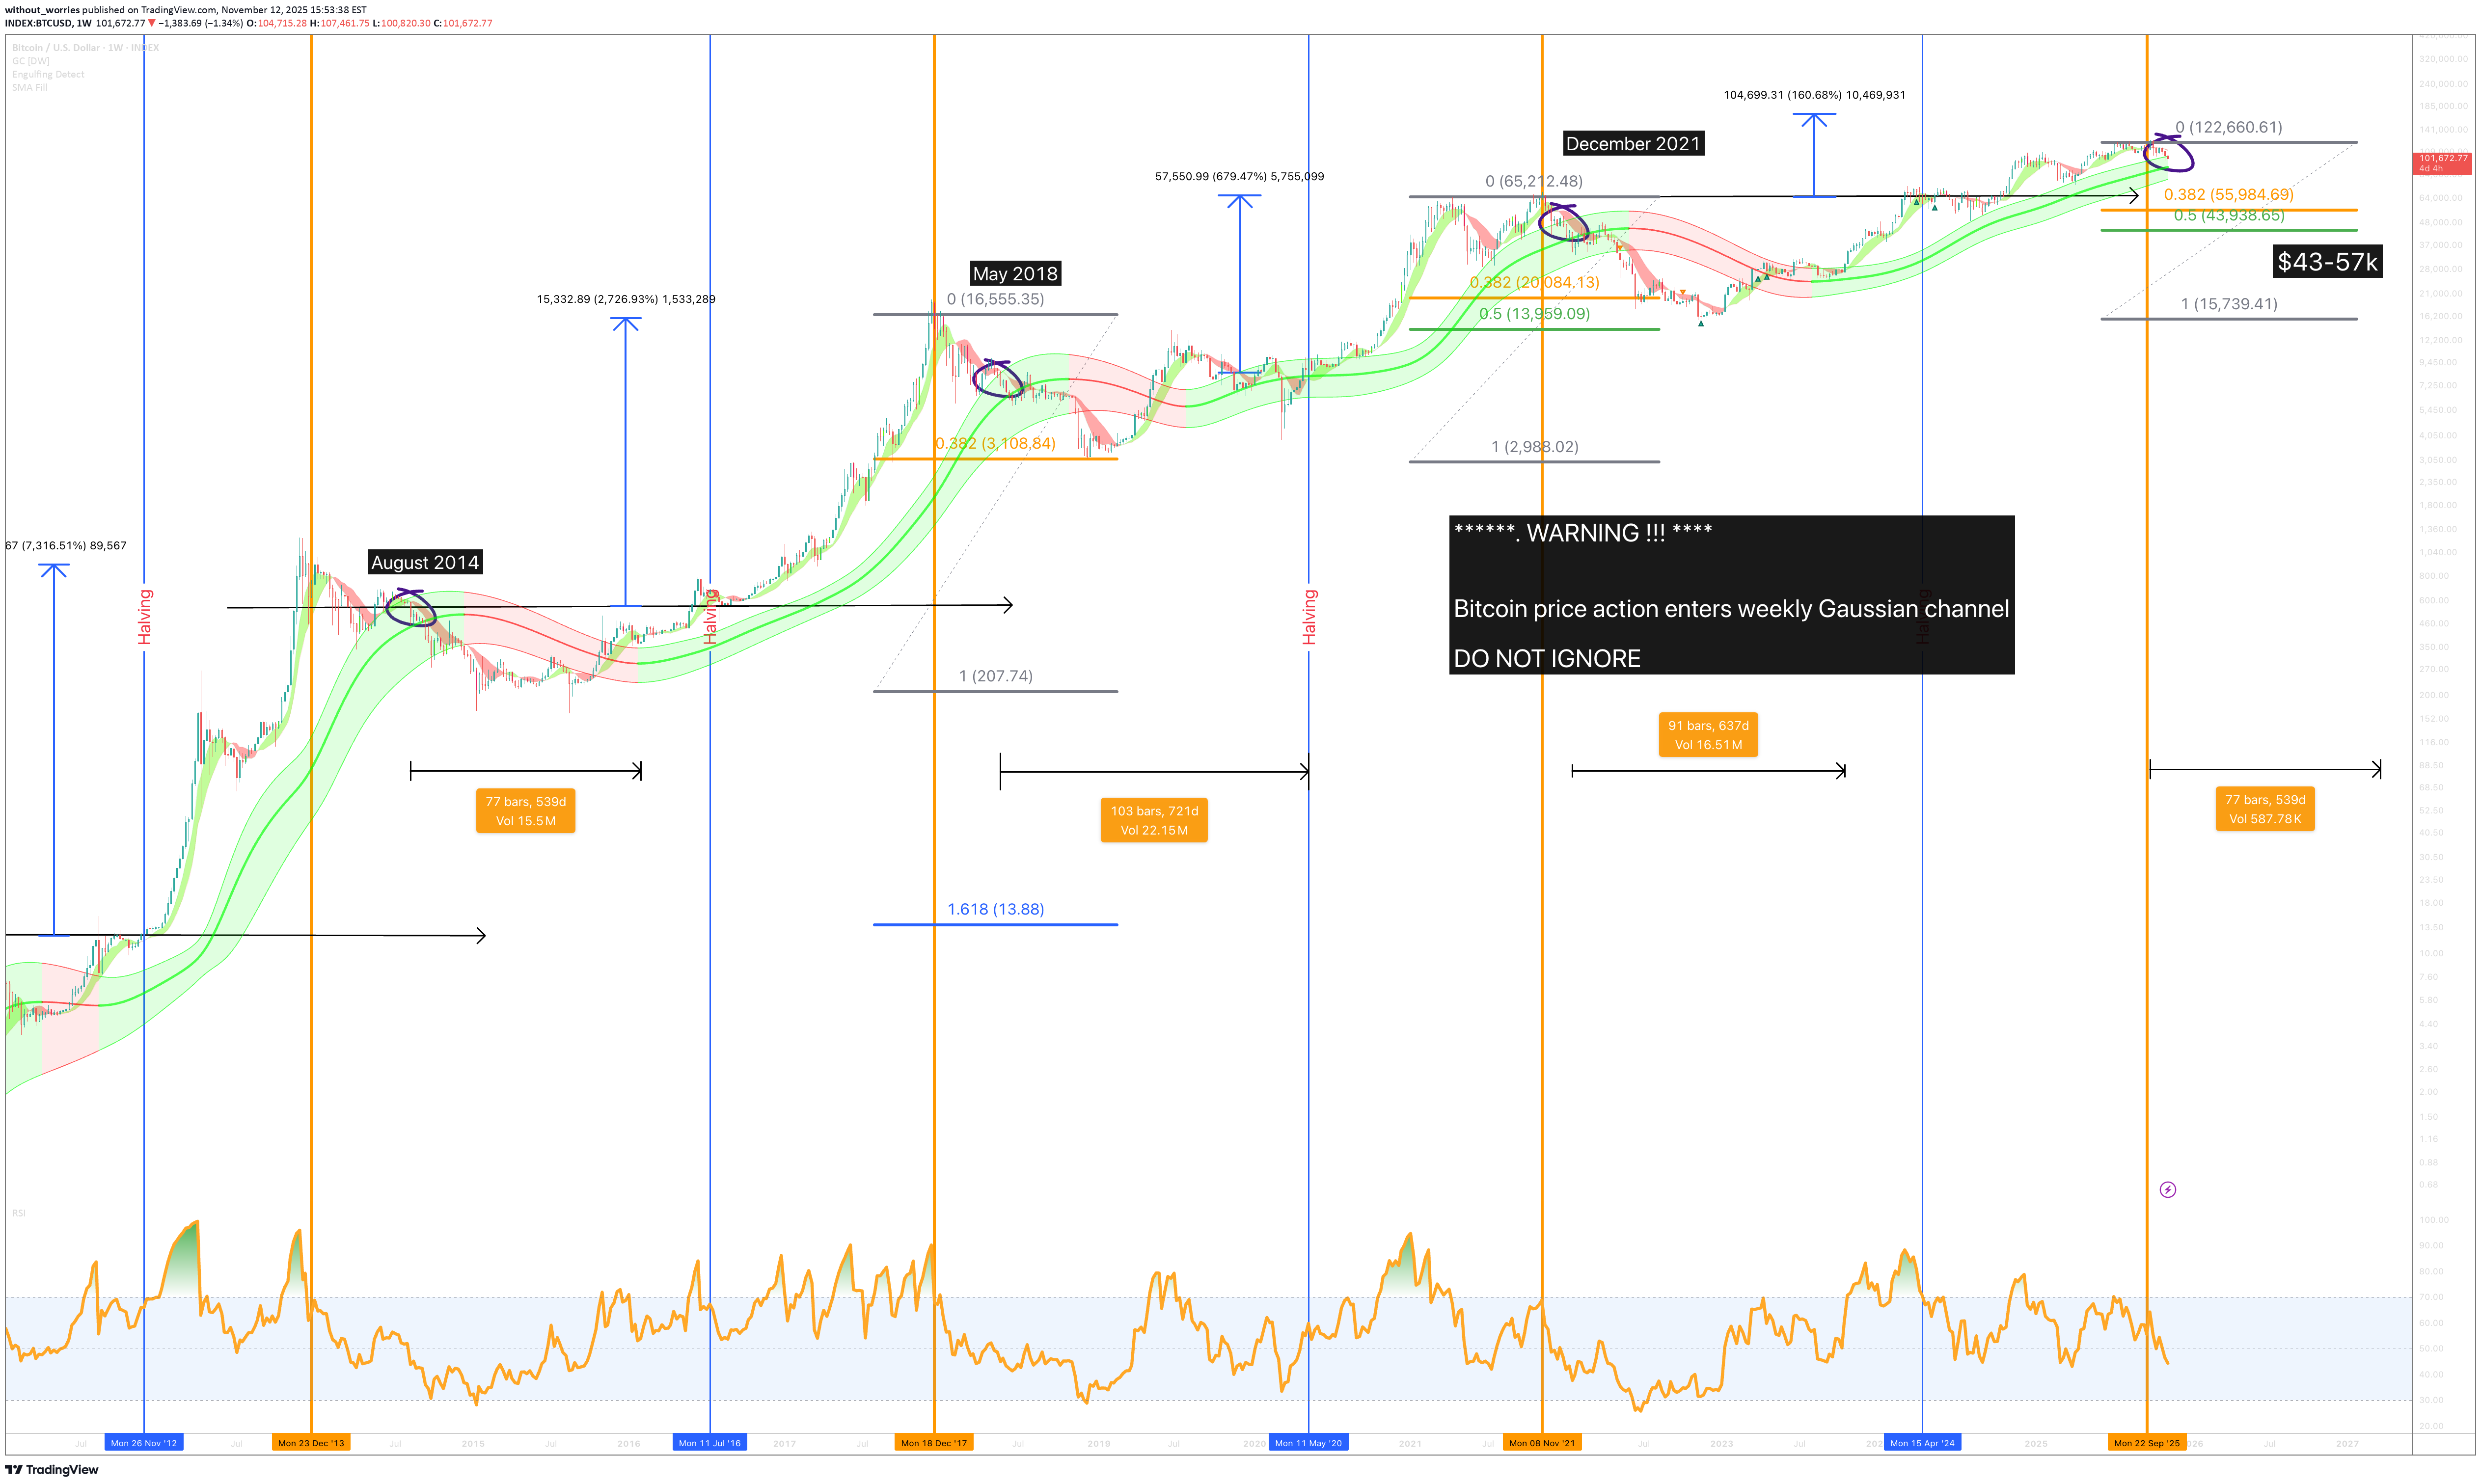
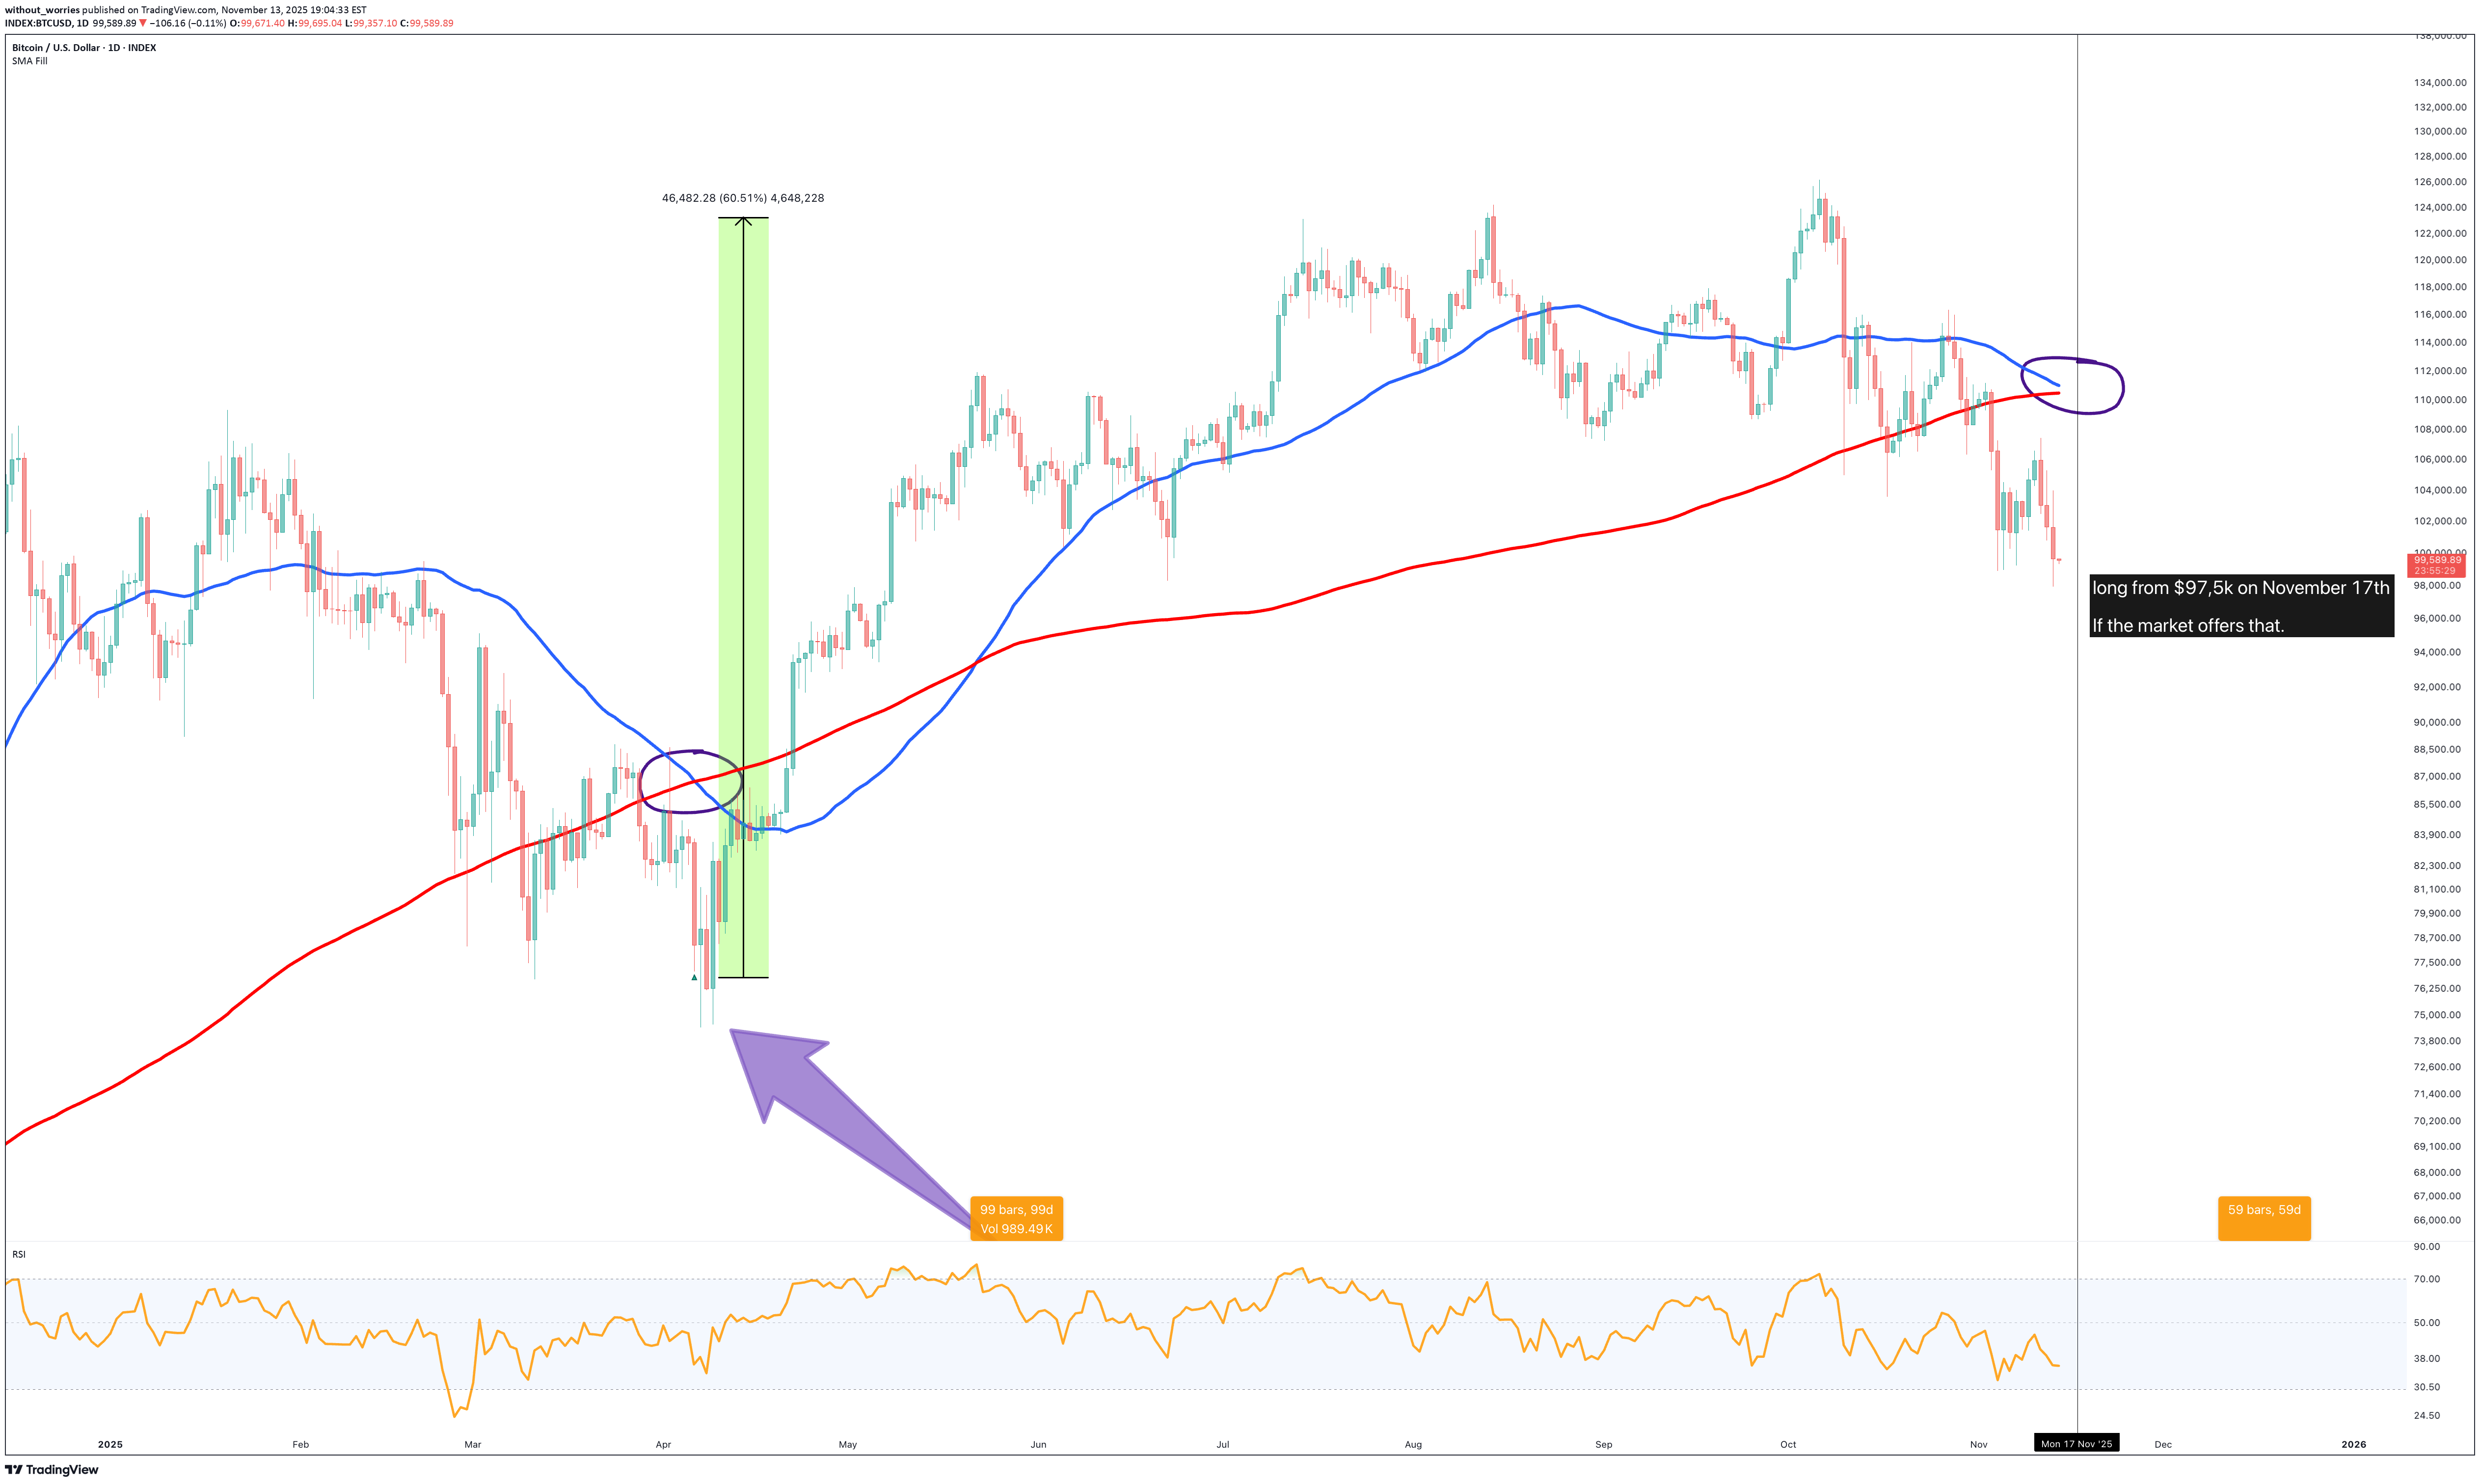
Ve Bulls'un bunu geri almak için 17 Kasım'a kadar zamanı var, yoksa... Yakın zamanda tetiklenen bir alarm, tamamen unutulmuş bir alarm. Bu alarmın kendime yazdığı bir mesaj var: "Bitcoin fiyat hareketi haftalık Gaussian kanalına giriyor. Sola bakın - GÖRMEYİN" Sola bakıyoruz ve duruyoruz, “ peki o kadar da ilginç değil mi ”diyor mantığın küçük sesi. Kendimi bu sefer farklı olduğuna ikna ederken ona susmasını söylüyorum. Teknik özellikler: 2014'ten 2021'e kadar daire içine alınan her mum, piyasa zirvesinin ardından haftalık Gauss kanalına giren ilk mumdur. Şimdi, pazarın zirvesinin orada olduğuna inanıp inanmamanız önemli değil. Biz yalnızca gerçeklerle ilgileniyoruz. Gerçekler şunlardır: Fiyat hareketi, kanala girişte minimum -%60 oranında düzeltildi SONRA onay. Fiyat eyleminin onaylanması için 17 Kasım'a kadar süre var. Bu, piyasanın 43 bin dolardan 57 bin dolara kadar dibe vurmasıyla sonuçlanacak ve Saylor'ın fonu silinecek. Fiyat hareketi en az 18 ay boyunca ayı piyasası koşullarında kalacak. Bu nedenle 2027 ortasına kadar iyileşme yok. Clarice'e daha yakın Boğa piyasasında kalmak için ne olması gerekiyor? Fiyat hareketinin 110 bin doların üzerinde kapanması gerekiyor, teknik olarak konuşursak 105 bin dolar kanalın dışında, bu zayıf bir kapanış olur. Önceki bar baskıyı yutarken zayıf bir kapanış. Sonuçlar İşte yine buradayız, Bitcoin haftalık Gaussian kanalına, o yeşil kıyamet eriştesine girdi. Her seferinde insanlar "dip satın alın!" diye bağırıyor. sanki şarkı söylemek red mumlarının sönmesine neden oluyormuş gibi. Sola bak, cidden, sadece bak. 2014'ten bu yana bu kanala doğru her fiyat hareketi, ayılar için 18 aylık spa geri çekilmenin başlangıcı oldu. “Bu sefer farklı” diyorlar. Bitcoin'ün girdiği her döngüde Gauss kanalı fiyatı yaklaşık %-60 düştü ve bir yıldan fazla bir süre boyunca kötü durumda kaldı. Ve 2025 muhteşem geçti, değil mi? Bitcoin maxi'lerin şimdiye kadar istediği tek şey fiat'ın değiştirilmesiydi. Tebrikler, fiyat hareketi geçen yılın bu zamanlarındakiyle aynı ve trendi sürdürmeye hazır görünüyorsunuz! Neden uzun yüzler? İstediğin bu değil miydi? Hiçbir zaman daha fazla dolarla ilgili olmadı değil mi? Sonuçta 1 Bitcoin hareketsiz = 1 Bitcoin. Şimdi boğaların 17 Kasım'a kadar prove'ye kadar süreleri var, bu başka bir tekrar değil. Boğalar fiyatı 110 bin doların üzerine çıkaramazsa (ve tutamazsa), bu durum perdelenir. Saylor ve lazer göz ekibi tweet'lerini sessizce silerken 43 bin dolar - 57 bin dolar yeni meditasyon bölgesi oluyor. Vay Sorumluluk reddi beyanı ============================================================= Bu finansal tavsiye değil. İnternette gökkuşağı renginde bir eğriyi işaret eden ve "bu kötü" diyen bir adam var. Gauss tanrılarının secret kodunu ortaya çıkardığımı düşündüğünüz için evinizi ipotek ettirirseniz bu sizin sorumluluğunuzdadır. Eğer pompalanırsa, kendinize dahi diyeceksiniz. Eğer dökülürse balinaların onu manipüle ettiğini söyleyeceksiniz. Her iki durumda da ben hâlâ burada olacağım ve yorumlar bölümünde gülüyor olacağım. Yani evet, kanalı İHMAL ETMEYİN. Ancak aynı zamanda, TradingView'deki bir yabancı bazı dalgalı çizgiler çizdi diye böbreklerinizi satmayın.
without_worries
پیشبینی سقوط دوجکوین: آیا نوامبر ۲۰۲۵ به ۴ سنت میرسیم؟
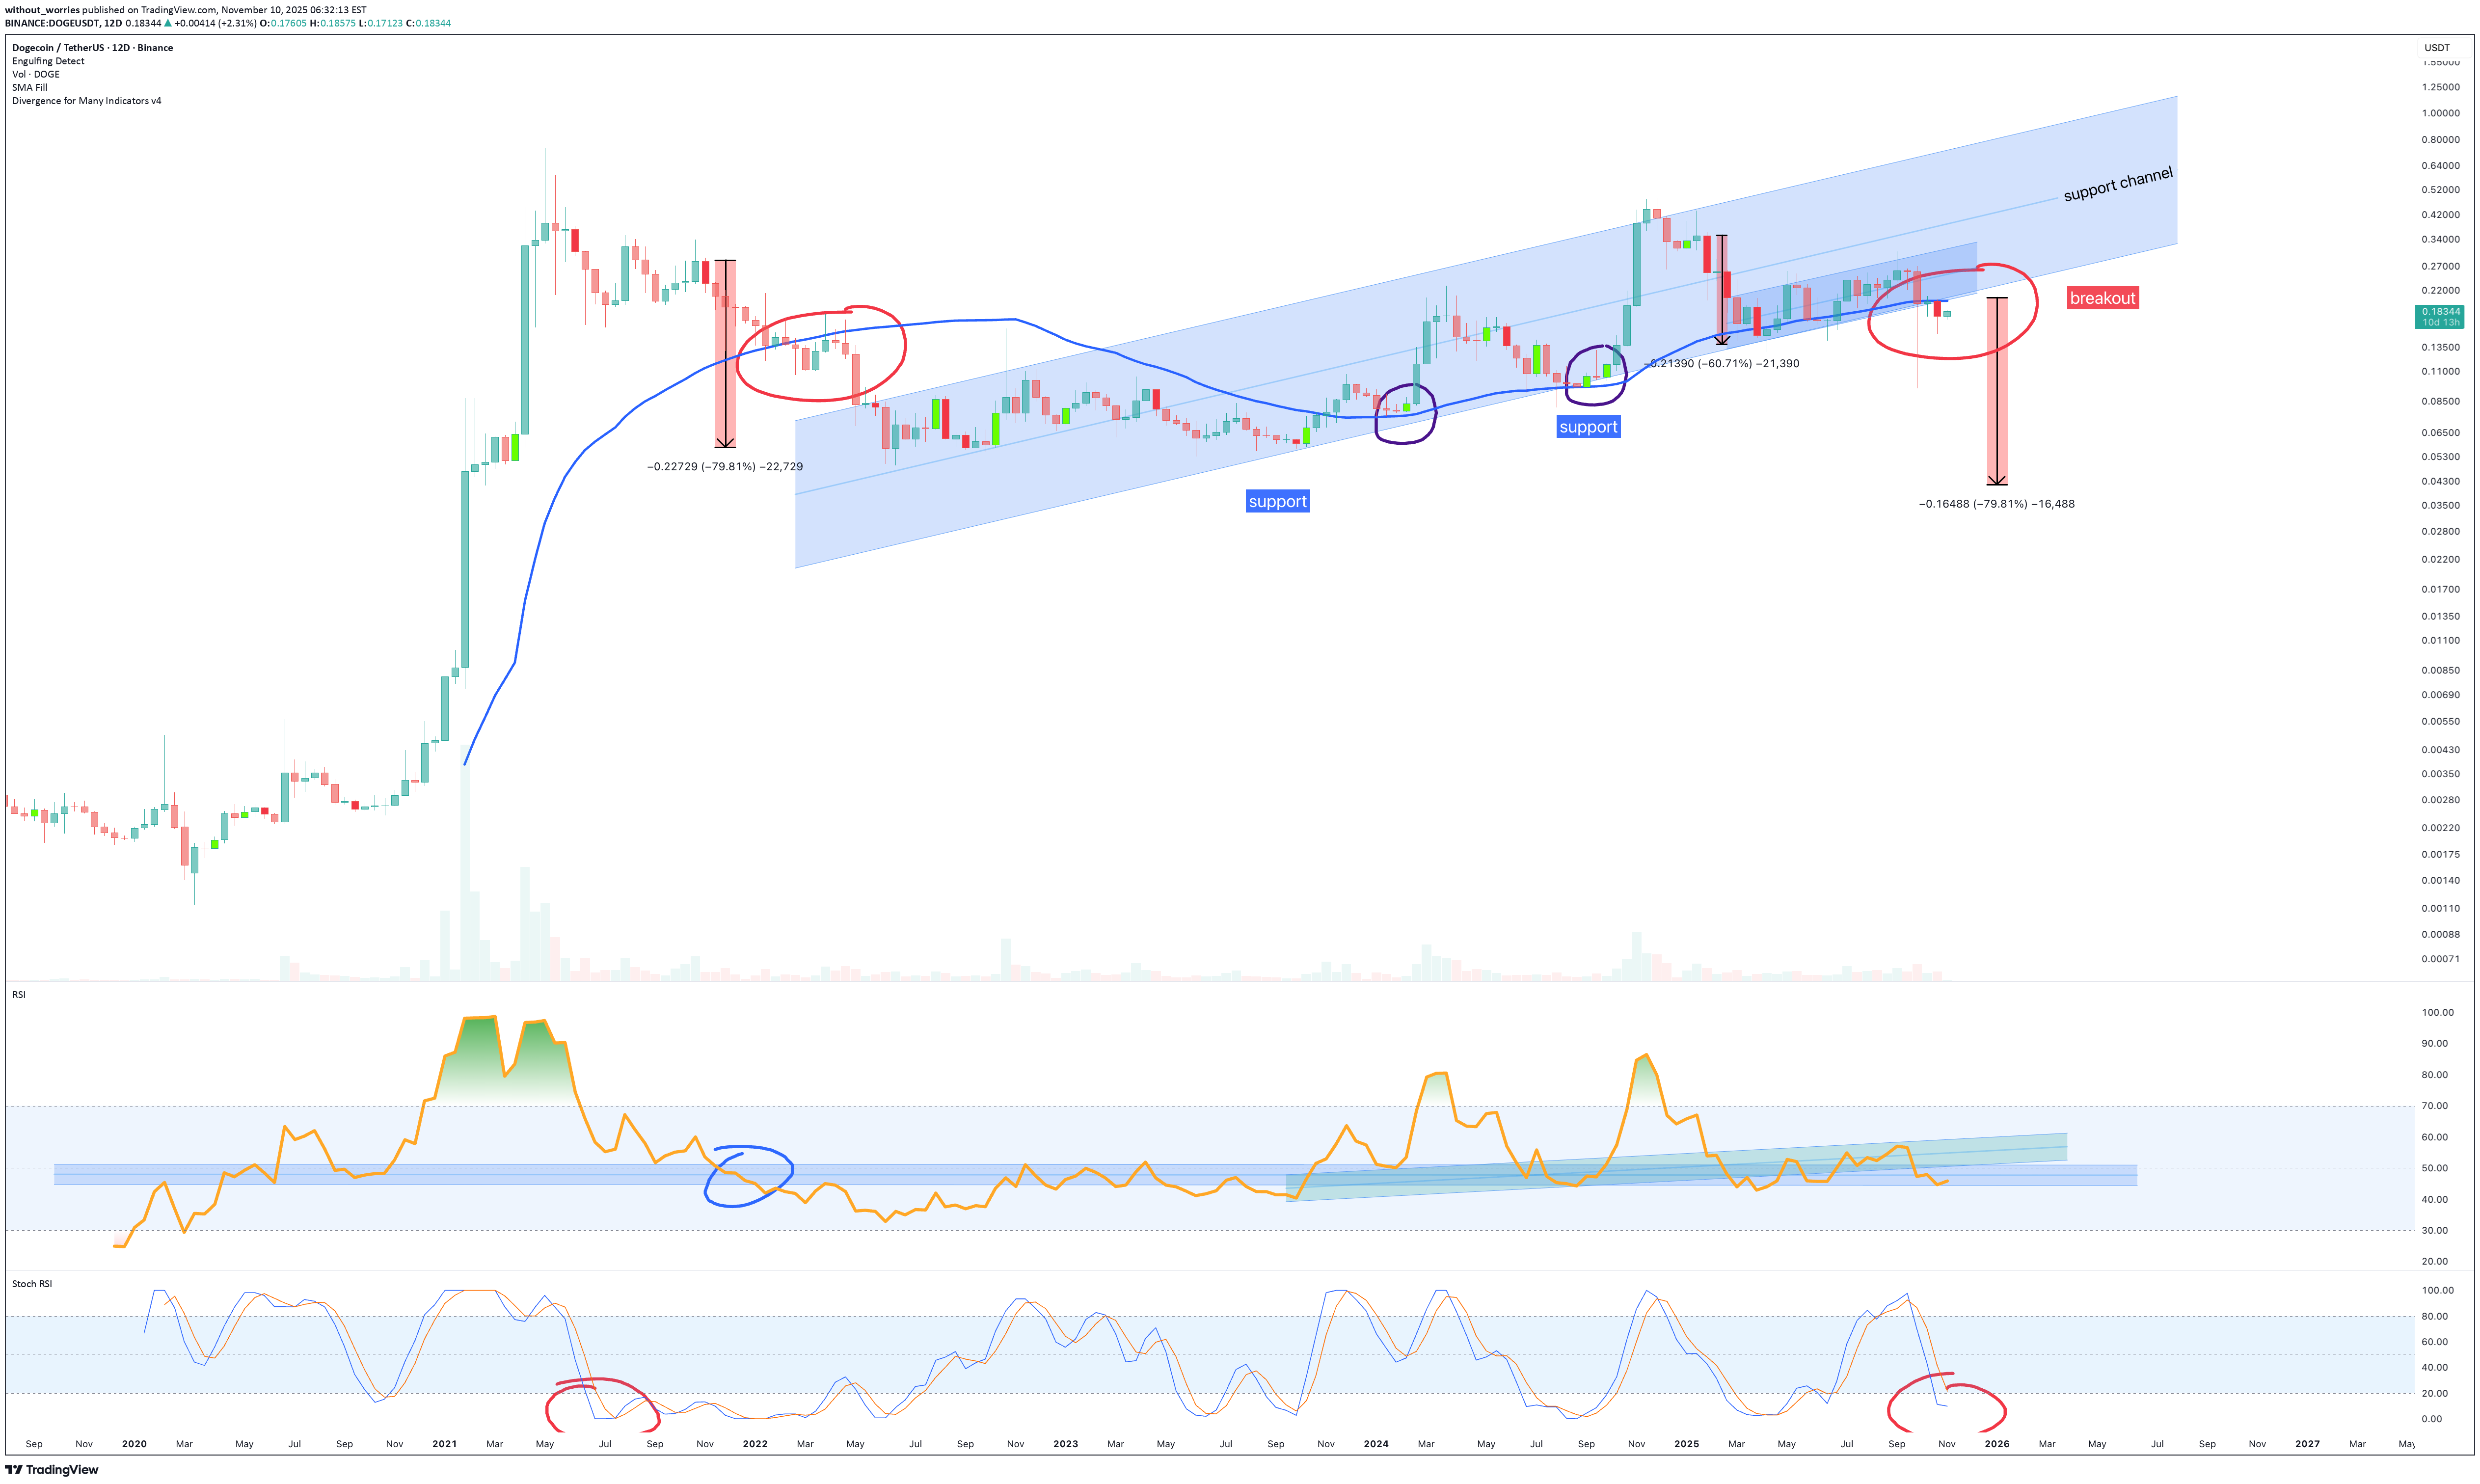
Yine başlıyoruz. Şaka olarak başlayan tek “para birimi” olan Dogecoin, din haline geldi ve artık yaşam destek ünitesine geri dönmüş gibi görünüyor. Mavi çizgi (yukarıda gösterilen 12 günlük grafikte 50 SMA) fiyata her dokunduğunda, kalabalık "Çıkıyor!" diye bağırıyor. Daha sonra yerçekimi herkese haritaların ve fiziğin gerçekte nasıl çalıştığını hatırlatır. Sola bak Fiyat hareketi mavi çizginin, yani 50SMA'nın üzerinde veya altında 10 veya 12 günlük bir mumu kapattıkça, fiyat aya yükselir veya uçurumdan düşer. Deja vu gibi ama daha pahalı. Teknikler (diğer adıyla gerçeklik kontrolü) 1. Destek kanalı: Fiyat, 2022'den bu yana o güzel küçük yükselen kanalın içinde itaatkar bir şekilde zıplıyor. Fiyatın tepki vermek yerine kanalı takip ettiğini gördüğünüzde bu bir uyarıdır. Bu yaklaşmakta olan zayıflığın bir uyarısıdır. Şimdi fiyat sehpadaki sarhoş gibi düştü. 2. RSI: 40'lı yılların ortalarında geziniyor, bu temel olarak denemeye zahmet edip etmeyeceğine veya sessizce pes edip etmeyeceğine karar vermesi anlamına geliyor. Eğer 42'ye düşerse gemiyi terk edin! 3. Stokastik RSI: Tekrar aşağıya doğru kıvrıldığını görebilirsiniz. Şu red çevresi mi? Bu, kestirmeden önce esnemenin teknik eşdeğeridir ve bunu genellikle bir damla takip eder. 20’nin altına indiğinizde bir süre orada kalacaksınız. 2021'deki %78'lik düzeltmeyi görüyor musunuz? Evet, aynı düzeni tekrar yazdırdık (1'den 3'e kadar olan noktalar). Eksik olan tek şey, ketaminle beslenen bir milyarderin Twitter'ı meme. Tahmin En iyi durum: Ölü bir cat kanalın dibine geri döner (~0,17$). Tebrikler, daha fazlasını kaybetme yolunda bile kırıldınız. Temel durum: Tıpkı geçen seferki gibi %70-80'lik bir düzeltme daha. Tarih tekerrür etmez ama Dogecoin yatırımcılar kesinlikle tekerrür eder. Bu durumda fiyat hareketi 4-5 senti test edecektir. En kötü durum: Elon bir şeyi tweetler, bir saat içinde %40 oranında artış gösterir ve siz yine zirveyi satın alırsınız. Sonuçlar Dogecoin hâlâ her zaman yaptığını yapıyor; bize piyasaların mantıktan çok duygularla desteklendiğini hatırlatıyor. Sürdüğü sürece fun idi ama şaka bitti. İşin can alıcı noktası portföyünüzdür. Eğer tarih bir rehber olacaksa, önümüzdeki birkaç ay bunun bir “birikim” olduğunu iddia ederek geçecek. Değil. Ekstra adımlarla inkardır. Tekrar ay olabilir mi? Elbette. Eğer Elon bu konuda tweet atarsa ekmek kızartma makinem de öyle olabilir. Vay Sorumluluk reddi beyanı =============================================================== Bu finansal tavsiye değil. İnternetteki bir adam bir dog resmi ve birkaç mum gösteriyor. Eğer Dogecoin'u bu yüzden satın alırsanız, moralim bozulduğunda ağlayarak bana DM atmayın, terapistinizi arayın. Eğer pompalanırsa, kendinize dahi diyeceksiniz. Eğer düşerse buna piyasa manipülasyonu diyeceksiniz. Her iki durumda da çok komik olacak.
without_worries
تقاطع مرگ بیت کوین SUI: فریب هولناک یا طلوع ۹۰۰ درصدی؟
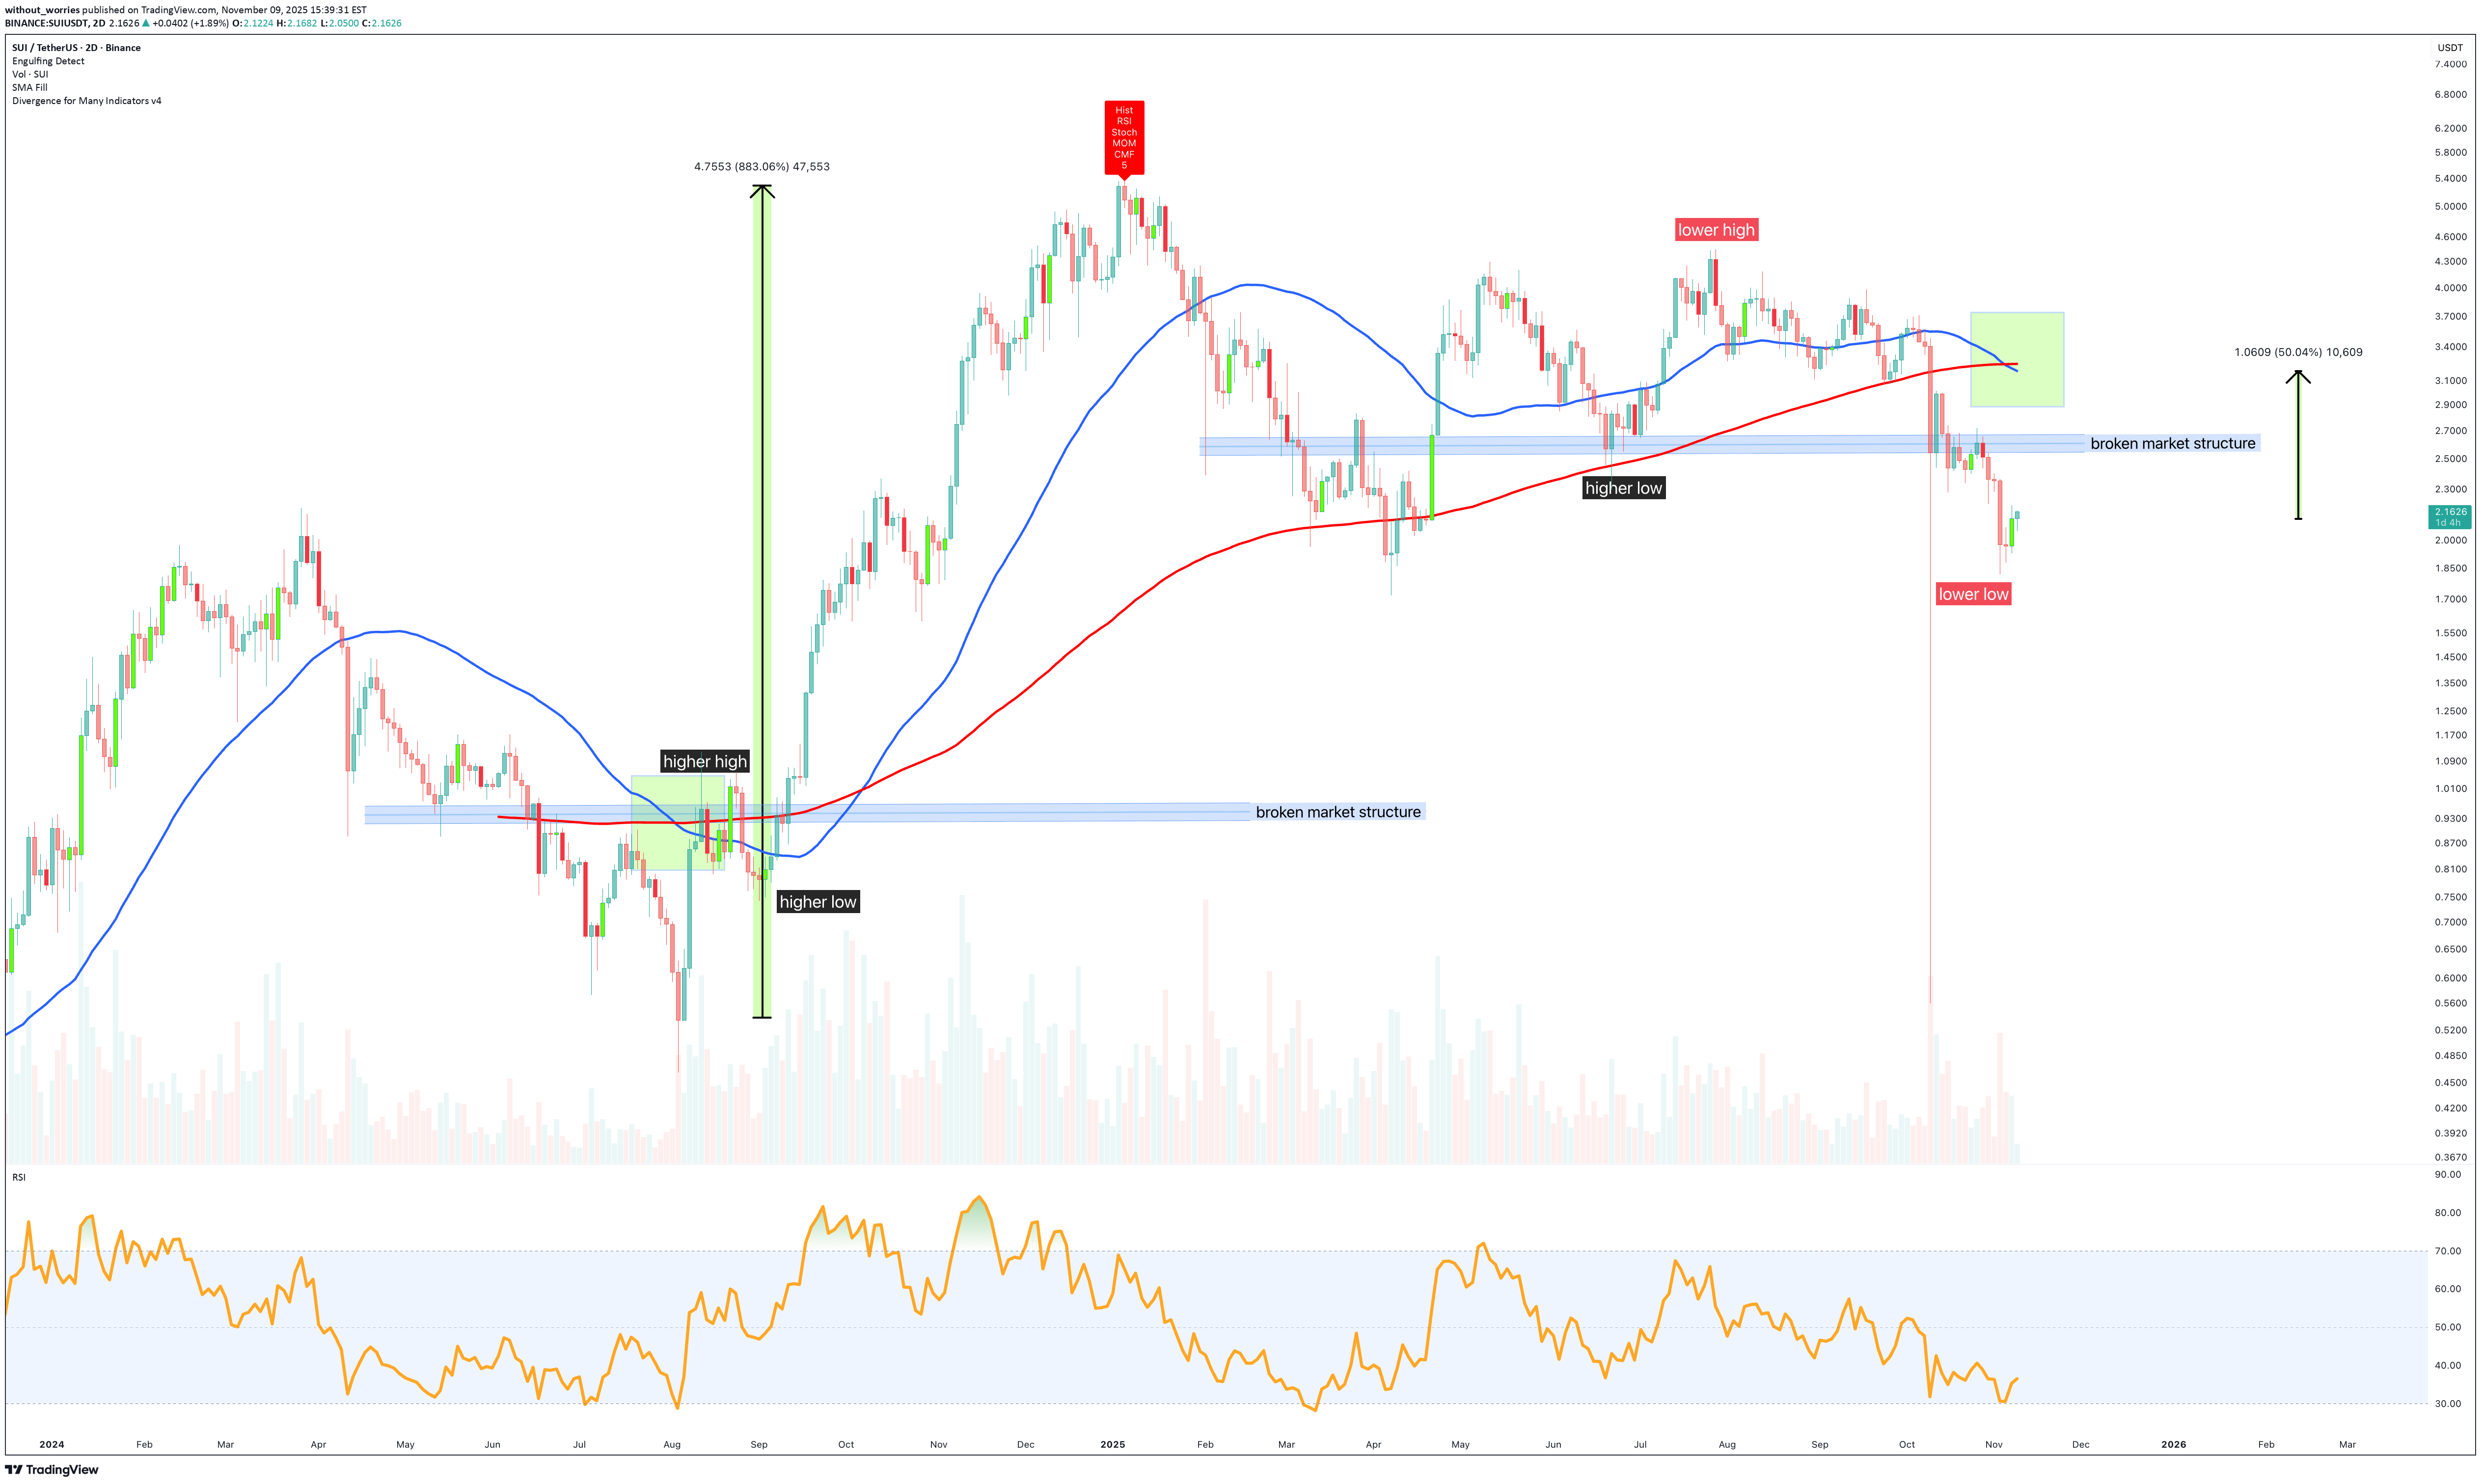
Yukarıdaki 2 günlük SUI grafiğinde 2 günlük bir ölüm haçı yazdırılır. Bu, 2 günlük 50 SMA'nın 2 günlük 200 SMA'yı (red) geçtiği zamandır. Kulağa kötü geliyor değil mi? Sola bakıldığında gerçek çok farklıydı. Fiyat hareketi, 2 günlük ölüm çapraz baskısında şaşırtıcı bir şekilde %900 arttı. Tarih tekerrür mü ediyor? Belki. Tarihin tekrarından önce olumlu yanıtlanması gereken iki soru var: 1. Trend, yüksek yüksekler, yüksek alçaklar baskı mı? 2. Destek ve direnç hangisi? Şu anda her iki soruya da olumsuz yanıt veriliyor. Bu değişene kadar uzun pozisyon mantıksızdır. Hareketli ortalamalar geleceği öngörmez Yatırımcılar hareketli ortalamaları çok kolay bir şekilde gelecek olayların tahmini olarak görüyorlar. Bunu söylemek aptalca geliyor: " Hareketli ortalama, belirli bir süre boyunca bir dizi değerin ortalama değeridir ". Kaç kişinin bunu fark etmediğine şaşıracaksınız. Hareketli ortalamalar size geçmiş hakkında bir şeyler söyler, gelecek hakkında ise hiçbir şey söylemez. Bunu yalnızca 1. ve 2. sorular yapabilir. Ne beklenebilir? Ölüm çapraz baskısında fiyatta yukarı yönlü bir move hareketinin beklenebileceği açıktır. En azından piyasa yapısına kadar. Bu, bugünkü fiyat hareketinden %50 kazanç anlamına gelir. Bundan sonra 2024 sonlarında olduğu gibi 1. ve 2. soruların olumlu hale gelmesi gerekiyor. Sonuçlar Kulağa hak ettiğinden çok daha kıyametvari gelen bir terim olan sözde ölüm haçı, piyasanın usual köşelerinde bir kez daha histeriyi kışkırttı. Ne zaman iki hareketli ortalama kesişse, kendilerini kutsal sayan peygamberlerden oluşan küçük bir ordu ortaya çıkıyor ve trend çizgilerine sanki kutsal bir kitapmış gibi tutunuyorlar. Ama her zamanki gibi data dramayla dalga geçiyor. Aynı oluşum en son ortaya çıktığında SUI ölmedi, dokuz kat arttı. Bu bir kıyamet habercisi değil; batıl inançlardan farklı olarak piyasanın insan beklentilerini umursamadığını hatırlatıyor. Daha yüksek zirveler ve daha yüksek dipler kendilerini yeniden ortaya koyana, direnç destek haline gelene kadar, yenilenen bir yükseliş trendi fikri ampirik olmaktan ziyade istek uyandırıcı olmaya devam edecek. Hareketli bir ortalamayı öngörü olarak ele almak, dikiz aynasını önümüzdeki yol ile karıştırmaktır. Bize ne olacağını değil, ne olduğunu söyler. Ancak tüccarlar bunu bir müjde olarak görmekte ısrar ediyor ve fiyat uymadığında yanlış inançları nedeniyle piyasaya lanet okuyor. Histeri teknik dengesizlikle karşılaştığında sıklıkla olduğu gibi, kısa vadeli bir yükselişin meydana gelmesi muhtemeldir. Ancak yapının doğrulanması olmadan, bu tür yükselişler, normalde kayıtsız olan fiyat keşif sürecindeki ertelemelerden, merhametli duraklamalardan pek fazlası değildir. Vay Sorumluluk reddi beyanı ======================================================= Bu finansal tavsiye değil. İnternetteki bir adam kalın harflerle "ölüm haçı" yazdığı için işlem yapıyorsanız, bundan sonraki her duygusal iniş çıkışları hak ediyorsunuz. Yükseliş eğiliminde olmanız, düşüş eğilimi göstermeniz ya da sadece sıkılmanız umurumda değil ya da para kaybederseniz bu bir "piyasa manipülasyonu komplosu" değil, bu sadece yanılıyorsunuz. Kendi araştırmanızı yapın, kendi riskinizi yönetin ve lütfen herkesin iyiliği için hareketli ortalamalara tarot kartları gibi davranmayı bırakın.
Sorumluluk Reddi
Sahmeto'nun web sitesinde ve resmi iletişim kanallarında yer alan herhangi bir içerik ve materyal, kişisel görüşlerin ve analizlerin bir derlemesidir ve bağlayıcı değildir. Borsa ve kripto para piyasasına alım, satım, giriş veya çıkış için herhangi bir tavsiye oluşturmazlar. Ayrıca, web sitesinde ve kanallarda yer alan tüm haberler ve analizler, yalnızca resmi ve gayri resmi yerli ve yabancı kaynaklardan yeniden yayınlanan bilgilerdir ve söz konusu içeriğin kullanıcılarının materyallerin orijinalliğini ve doğruluğunu takip etmekten ve sağlamaktan sorumlu olduğu açıktır. Bu nedenle, sorumluluk reddedilirken, sermaye piyasası ve kripto para piyasasındaki herhangi bir karar verme, eylem ve olası kar ve zarar sorumluluğunun yatırımcıya ait olduğu beyan edilir.