
VaidoVeek
@t_VaidoVeek

تریدر چه نمادی را توصیه به خرید کرده؟
سابقه خرید
تخمین بازدهی ماه به ماه تریدر
پیام های تریدر
فیلتر
نوع پیام
VaidoVeek
بورس آبان: 20+ سهم طلایی با تحلیل تکنیکال (رادار سرمایهگذاری شما)
📅 اکتبر به پایان رسید و یک ماه جدید همیشه به معنای فصل جدیدی در نمودارهاست. بستههای ماهانه نشان میدهد که کدام شکستها واقعی هستند، نه جهشهای موقت، بلکه نشانههای واضحی هستند که سرمایهگذاران مایل به پرداخت قیمتهای بالاتر از قبل هستند. 📊 من به دنبال آن لحظاتی هستم که بازار ثابت کند نظر خود را تغییر داده است - زمانی که مقاومت سابق در نهایت به حمایت تبدیل میشود و زمانبندی شروع به ایجاد یک مزیت میکند. این یکی از بزرگترین نقاط قوت تحلیل تکنیکال است: ما امیدوار نیستیم که حرکت کند، ما عمل را در نمودار می بینیم. ----------------------------------- 🔍 در روزهای گذشته، دور کامل دیگری از تحقیق را انجام داده ام: من از طریق هر دو اسکن کردم نزدک 100 و S&P 500 ، و همچنین چند راه اندازی قوی از اروپا را انتخاب کرد. در مجموع، امروز بیش از 20 سهام را پیدا کرد - هر کدام سهام خاص خود را دارند شرح و برنامه ریزی من می دانم که به نظر زیاد می رسد، اما تعداد کمی از شما در حال حاضر اینجا هستید 🙏، و هر سرمایه گذار استراتژی متفاوتی دارد. بنابراین احساس نکنید که باید همه چیز را مطالعه کنید ... فقط نام ها را اسکن کنید: اگر چیزی توجه شما را جلب کرد، متوقف شوید و حفاری کنید. اگر نه، به ادامه مطلب بروید. لازم نیست همه آنها را بپوشانید. 📣 هدف من از کار ساده است: "برای ارائه ایده های خوب و از نظر فنی صحیح - ایده هایی که از اشتباهات کلاسیک ناشی از خرید در زمان نامناسب جلوگیری می کند." ... و هنگامی که آن را با تکالیف اصلی خود ترکیب می کنید، میزان موفقیت شما ممکن است به طرز شگفت انگیزی سبز شود. ----------------------------------- 🧭 رادار نوامبر در پست امروز، هر دو را یافت تنظیمات شکست و اصلاحات که به مناطق حمایتی قوی رسیده اند. من همچنین از شاخص های major عبور می کنم و توضیح می دهم: "چرا ممکن است به جای همه چیز، گرفتن موقعیت های نیمه هوشمندانه تر باشد." ☕ پس قهوه خود را بردارید... و بیایید با ۱۰ ایده جدید شروع کنیم! 👇 آمازون (AMZN) اینجا نیازی به معرفی طولانی نیست. هنگامی که یکی از اعضای هفت شگفت انگیز یک شکست تمیز ارائه می دهد، این سیگنالی است که نمی نادیده بگیرید. 📈 برای کسانی که به طور منظم به دارایی های Mag7 خود اضافه می کنند یا ماهانه بین آنها می چرخند، آمازون این بار انتخاب من بود. در حالی که اصلاح اخیر META نیز منطقه بدی نیست، از نظر فنی، AMZN در حال حاضر تنظیمات قوی تری را نشان می دهد. ----------------------- Dell Technologies (DELL) Dell Technologies یکی از بزرگترین شرکت های فناوری اطلاعات در ایالات متحده است که رایانه ها، سرورها و راه حل های زیرساخت ابری را ارائه می دهد. در سه ماهه اخیر، دل شتاب خوبی به دست آورده است - به ویژه از تقاضای AI سرور، که به لطف محصولات زیرساختی با ارزش بالاتر، به افزایش حاشیه کمک کرد. درآمد همچنین در آخرین گزارش بالاتر از انتظارات بود که اعتماد سرمایه گذاران را تقویت کرد و سهام را به بالاترین حد جدید رساند. 📈 از منظر فنی، شکست واضح است: مقاومت 150 دلاری که تقریباً یک سال و نیم باقی مانده بود، سرانجام در اکتبر تسلیم شد. اکنون ساختار به سمت بالا باز است و نمودار استحکام واضحی را نشان می دهد. تصمیم ساده است: اکنون وارد شوید، منتظر یک آزمایش مجدد عمیق تر باشید، یا فقط آن را در رادار خود نگه دارید - تماس خود. ----------------------- نوکیا (OMXHEX: NOKIA) چند هفته پیش، به این موضوع اشاره کردم که نوکیا در حال راه اندازی برای یک شکست احتمالی است، و به آن نگاه کنید، در واقع انجام داد. این شرکت همکاری خود را با NVIDIA اعلام کرد، که باعث شد تا move که مدت ها انتظارش را می کشیدیم بالاتر رود و از منطقه مقاومت قبلی خود عبور کند. سطح 5.5 یورویی که قبلاً ذکر شد اکنون تاریخ است و بسته شدن ماهانه بالای آن اعتبار شکست را تایید می کند. خواه فوراً وارد شوید، منتظر تست مجدد باشید، یا از آن صرفنظر کنید زیرا با سبک شما سازگار نیست - دوباره، تماس شما. از نظر فنی معتبر است! ----------------------- دینامیک فولاد (STLD) استیل داینامیکس در میان بزرگترین تولیدکنندگان فولاد در ایالات متحده قرار دارد که به دلیل استفاده از فولاد بازیافتی و روش های تولید کم آلاینده شناخته شده است. این شرکت با P/E 20 (12 ~) از U.S بهره می برد. سرمایه گذاری های زیرساختی و روند صعودی تولید بیشتر نتایج سه ماهه اخیر ثابت بوده است، ترازنامه قوی است و وجه نقد flow جامد باقی می ماند و از رشد بالقوه آینده حمایت می کند. 📈 راه اندازی فنی: این نمودار همه کادرهای یک بازی کلاسیک را بررسی میکند: .......... 🧭 رادار کامل و یادداشت های توسعه یافته در صفحه اصلی من موجود است - به راحتی آن را پیدا کرد. بهترین ها، وایدو
VaidoVeek
ETH/USD: The Perfect Time to Buy?! (PART II)

در طول four و نیم سال گذشته، محدوده قیمتی حدود ۴۰۰۰ دلار نقش مهمی در نوسانات ETH ایفا کرده است. ابتدا برای مدت کوتاهی پس از اینکه ETH در سال ۲۰۲۱ به بالاترین حد خود رسید، به عنوان حمایت عمل کرد. مهمتر از آن، این سطح بارها به عنوان یک حمایت قوی عمل کرده است. هر بار برخورد، اهمیت آن را بیشتر کرده است. در ابتدای آگوست ۲۰۲۵، ETHUSD یک شکست قوی انجام داد - یک شکست تایید شده. قدرت خرید سنگین از این منطقه عبور کرد. و حالا بهترین قسمت فرا می رسد: قیمت در حال حاضر در حال آزمایش مجدد آن منطقه شکست است، یک تنظیم کلاسیک شکست و آزمایش مجدد. بنابراین، این سطح قیمتی قوی اکنون شروع به عمل کردن act به عنوان حمایت می کند، و از نظر فنی، این یک تنظیم بسیار قوی است. من اغلب کریپتو پست نمی کنم، اما آخرین باری که نمودار ETH/USD را به اشتراک گذاشتم، درست قبل از شروع رالی فعلی بود. بیایید این را قسمت دوم بنامیم. 😉 مراقب سطوح قیمت فعلی باشید - از نظر فنی، این یک تنظیم بسیار تمیز است. موفق باشید، وایدو
VaidoVeek
Compounders: 5 Simple Rules to Build Long-Term Wealth

Imagine this: …it’s 18 years ago. The very first iPhone has just hit the market. Meanwhile, Nokia’s legendary “Snake” game, once the height of mobile fun, was starting to feel… dated. ⚡ And you can sense it: something big is coming. You don’t know exactly what, but something is about to shake the system. So, you invest €1,000 into Apple stock. No fancy moves, no day trading. You don’t check the price every morning, you don’t sell at the first dip. You just hold and go about your life, using their products as always. ---------------------------------- Fast forward to today: the iPhone has evolved quite a bit, and so has your bank account, “a bit”. That modest €1,000 investment would now be worth roughly €70,000. For context, if you had simply invested in the S&P 500 instead, your total profit would be €3,300. This is what happens when you hold a real compounder. Apple: +6,942%. S&P 500: +334%. Time doesn’t just pass, it compounds! Big difference, right? And the craziest part? You didn’t need a crystal ball. Looking back, everything makes perfect sense. The real question is: Can you spot the next one before it becomes obvious? --------------------------------------- 📈 Compounders: The slow, steady, and surprisingly effective path to wealth A compounder is a company that steadily grows your investment over time, powered by a strong business model and consistent value creation. These stocks don’t need to chase headlines. They don’t create drama, and they certainly don’t swing wildly every week on the stock exchange. They simply keep building value. Strong financials, good products, and a clear direction—like a snowball quietly rolling downhill, gathering momentum with every meter. As Warren Buffett once said: That’s exactly what compounders allow you to do. While you rest, they keep working. It’s definitely not a get-rich-quick strategy. It’s more like a slow, somewhat boring, and failry a “safer” route. But in return, it might just give you something far more valuable than fast gains: financial peace of mind, and perhaps even financial freedom. 🔍 So how do you spot one? Now, let’s be clear: compounders are not bulletproof. Market crashes, disruptive competitors, and economic shocks can still shake them.But when the foundation is solid, these companies tend to stand strong, even in a storm. Here are five key traits that define a true compounder. From consistent growth to an unshakable competitive edge. --------------------------------------- 📈 1. Steady Growth What you want to see is a steady upward trend in both revenue and earnings per share (EPS). Not a rollercoaster. A clean, reliable trend. A strong compounder doesn’t explode one year and crash the next. It grows year after year. It grows calmly, consistently, and predictably… Microsoft EPS Q Source: TradingView That’s usually a sign of solid management and sticky customer demand. Let’s look at a key metric here: EPS CAGR (5-year) – the compound annual growth rate of earnings per share. 5% = solid → reliable and steady progress 10% = good → suggests a strong business model and real market demand 15%+ = great → this is where the snowball effect really kicks in, fast and orderly 📌 The higher the CAGR, the faster your investment compounds. But it’s not just about speed, it’s about repeatability. If that growth is not random but repeatable and sustainable, you don’t just have a growth stock → you’ve got a true compounder. ⚠️ Always consider the sector: A 15% CAGR might be normal in tech, but in a consumer brand or industrial company, that’s an exceptionally strong result. --------------------------------------- 💡 2. Efficient Capital Allocation A good compounder doesn’t just grow a lot—it grows wisely. That means every dollar the company reinvests into its business generates more than a dollar in return. Think of it like a business where every $1 invested turns into $1.20 or more in profit. The more efficiently it can put capital to work, the faster it compounds over time. 🎯 ROIC (Return on Invested Capital) tells you how effectively a company is using all its invested capital—including both equity and debt. ROIC shows how much profit the company earns after taxes and costs for every dollar it has invested, regardless of where that money came from.It’s broader than ROE, which only considers shareholder equity. >10% = solid >15% = good >20% = great 🎯 ROE (Return on Equity) measures how well the company generates returns specifically on shareholder money: >15% = solid >20% = good >25% = great 📌 In most cases, ROIC is more important than ROE , since it doesn’t get distorted by how much debt the company is using. But when both numbers are high, you’ve got something that creates a lot of value - a true compounding engine. Just imagine you give a chef $10 to make a dish. If they can turn that into a $15 meal, their ROIC is 50%. That’s the kind of capital efficiency we want to see in companies too, where every dollar invested pulls serious weight. --------------------------------------- 💰 3. High Profit Margins Selling stuff isn’t hard. Any company can sell something, even at a loss. A true compounder doesn’t just generate revenue, it earns real profit from it. That’s where operating margins come into play. They show how much money is actually left over after covering everything: salaries, logistics, rent, office coffee, stolen toilet paper, and all the other lovely overhead costs. ⚙️ Operating Margin – the percentage of revenue that turns into operating profit: 10% = solid → stable profitability, usually driven by volume or efficiency 20%+ = great → often signals strong pricing power, lean cost structure, or a dominant brand 📌 Why does this matter? Because the more profit a company retains after expenses, the more it can: - reinvest in new products or markets - pay dividends to shareholders - or buy back shares (which automatically increases your ownership per share) All of these create real, recurring value for you as an investor—not just once, but year after year. ⚠️ One important note: What qualifies as a “high” margin depends on the industry. A software company might easily run at 30% margins, while a retail chain or car manufacturer might be thrilled with 5%. So don’t judge the number in isolation. Always consider the type of business—in some sectors, profits come from volume, not margin. --------------------------------------- 🧱 4. Debt Matters Even if a company is growing fast and making money, it still doesn’t qualify as a true compounder if it’s drowning in debt. A real compounder moves forward mostly(!) under its own power, not thanks to borrowed money. Financially strong companies have a healthy buffer, so they’re not in trouble the moment the economy slows down or credit tightens. 📉 Debt-to-Equity (D/E) – how much of the company is financed with debt versus equity: Under 1 = solid → reasonable leverage Under 0.5 = great → very strong and conservative balance sheet 📈 Interest Coverage Ratio – how easily the company can pay its interest expenses: 5× = solid 10×+ = great → very safe, meaning debt costs won’t threaten profitability 📌 The lower the debt and the higher the buffer, the lower the risk.A company with a strong balance sheet doesn’t need to refinance debt in a panic or rely on costly tricks to survive downturns. Think of it like the foundation of a house. Without it, even the most beautiful structure can collapse. ⚠️ Some industries (like real estate or utilities) naturally operate with higher debt levels. But even in those cases, you want to see a business that controls its debt, rather than living “one day at a time.” --------------------------------------- 🏰 5. Durable Competitive Advantage (a.k.a. Moat) Back in the Middle Ages, a moat was a water-filled trench that protected a castle.Today, in investing, a “moat” is what protects great businesses from competition. It’s a business that others can’t easily reach or replicate. 💪 When a company has a wide moat, it can: - Defend its market share even when others try to attack - Command higher prices—because customers stay loyal - And if a competitor starts gaining ground, it often has enough capital to... just buy them out Here are some classic moat types with examples: - Brand Loyalty – People pay more for something familiarExample: Coca-Cola. There are hundreds of alternatives, but the taste, logo, and brand feel... irreplaceable. - Network Effects – Every new user strengthens the product or platformExample: Visa, Mastercard. The more they’re used, the harder it is for any new player to break in. - Technological Edge – The company is simply too far aheadExample: Nvidia, ASML. You can throw money at the problem, but patents and experience aren’t things you copy overnight. - Ecosystem Lock-in / Habitual Consumption – Customers get “stuck,” and switching feels like a hassleExample: Apple. Once you have the iPhone, AirPods, and MacBook… switching to Android just sounds like a lot of work.Or take Procter & Gamble. If your baby’s used to Pampers, you’re not going back to cloth diapers anytime soon. (To be fair—Huggies might actually be better 😄 That’s Kimberly-Clark, ticker KMB.) 📌 A strong moat allows a company to maintain both profitability and growth for the next 10+ years—because no one else can get close enough to steal it.It’s not fighting tooth and nail for every dollar. It rules its niche quietly and efficiently. --------------------------------------- Now that we’ve covered what makes a business a compounder, the next question naturally follows: “Okay, but if it’s such a great company... is it still a great price?” That’s where valuation comes in.P/E ratio: how to know whether you’re paying a fair price or just a premium for the brand. --------------------------------------- 👉 In my April article, I clearly broke down P/E along with eight other key fundamental metrics: straightforward, real-world explanations designed to help you actually use them… --------------------------------------- 💵 P/E (Price-to-Earnings Ratio) The P/E ratio tells you how much you’re paying for every $1 of a company’s earnings. Think of it like this: are you buying solid value for $20… or paying $70 just because the brand sounds familiar? Now, for compounders, a high P/E (say, 25–40) can actually be fine, IF(!) the company is growing fast and has a strong moat. Here’s a quick cheat sheet: * Under 15 → generally cheap (might be a bargain… or a trap) * 15–25 → fair price for a traditional business * 25–35 → reasonable if the company is growing consistently * 35–45 → starting to look expensive, must be justified by fundamentals * 45+ → expensive, and the market expects big things. One slip-up and the stock could drop fast. ⚠️ A P/E over 40–45 means the market expects strong, sustainable growth.If that growth doesn’t show up, the stock won’t just stumble—it could crash. But here’s the key: P/E doesn’t work well in isolation. Context is everything. Before judging the number, always ask: - What sector is this company in? - What’s the sector average? - How fast is the company growing? - Are the profits stable and sustainable? --------------------------------------- Real-World Examples: ✅ Visa – P/E around 37The average for financial stocks? Usually 10–15.But Visa grows quickly, is highly profitable, and has an ironclad moat.Is it expensive? Yes. But in this case, justifiably so. ✅ Microsoft – P/E around 35Tech-sector average tends to sit between 25–35.Microsoft has consistent growth, high margins, and clear market leadership.A P/E of 35 is absolutely reasonable—as long as the growth story continues. 🤔 But what if Microsoft trades at P/E 50+? Then you have to ask:Is earnings growth truly supporting that price?Or are you just paying for the brand... and a bit of FOMO? ----------------- Leave a comment: What’s the highest P/E you’ve ever paid, and was it worth it? ----------------- 📘 Compounder Cheat Sheet Don’t just stare at absolute numbers. Always compare within the sector, consider the company’s growth pace and business model. Ask yourself: “How much am I paying today for what this company will earn tomorrow?” --------------------------------------- 🧩 Summary Compounders are like good wine, they get better with time. Find companies that grow steadily, generate profits, keep debt low, and dominate their niche. Hold tight. Stay patient. Let the snowball roll. Thanks for reading! If this article was helpful or resonated with you, feel free to like, comment, or share it with a friend! It motivates me more than you’d think. 🙏 And if you’re new here: 🍷 Like good wine, this channel only gets better with time. Follow and let the ideas compound slowly, steadily, and deliciously. Cheers Vaido
VaidoVeek
9 Simple Ratios Every Great Investor Uses - Buffett Included!
Forget the hype, headlines, or hope. These 9 financial ratios are what real investors actually use to pick winners, but... P/E? ROE? EPS? 🧐 - What are they, or better yet, WHO are they? 🤯 - How high is “too high”? - Is a low number always good, or just a trap? - Do all industries follow the same rules… or is that another myth? Buffett. Greenblatt. Graham. Lynch. They didn’t rely on vibes — they trusted fundamentals After years of relying on charts, I built a 9-point fundamentals checklist to filter stocks faster and smarter. Now I’m sharing it with real-life examples and key insights to help you spot what really makes a stock worth owning: Easy enough for new investors diving into fundamentals Sharp enough to level up seasoned pros Real enough to avoid hype …but the truth is: these numbers did flag companies like Amazon, Apple, and Nvidia before the market gave them credit. ----------------------------------------------------- ✅ Quick Reference Table Scan the table, then dive into the stories… First Pro Tip: Bookmark this. You’ll check these before every stock pick. ----------------------------------------------------- 📊 1. P/E Ratio | Price-to-Earnings What it tells you: How much you pay for each dollar of a company’s profit. Short Example: A P/E of 20 means you pay $20 for $1 of profit. High P/E? Expect big growth or risk overpaying. Strong: Between 15 and 25 Caution: Above 30 (unless fast growth) Industry Averages: - Tech: 25–40 - Utilities: 10–15 - Consumer Staples: 15–20 - Energy: 10–20 - Healthcare: 20–30 Story: In early 2023, NVIDIA’s P/E ratio hovered around 25, near the low end for tech stocks. Investors who saw this as a steal amid the AI boom were rewarded—NVIDIA’s stock made 4x by the end of 2024 as AI chip demand soared. Contrast that with Tesla in Q1 2025, when its P/E spiked above 40 with slowing sales and Tesla’s stock dropped 50% in weeks. Pro tip: A low P/E is not always good. If growth is weak or falling, it's often a trap. Example: A utility company with a P/E of 30 is probably overpriced. A tech stock with 35 might still be fair — if growth justifies it. ----------------------------------------------------- 🧠 2. PEG Ratio | Price-to-Earnings-to-Growth What it tells you: If a high P/E is worth it based on future profit growth. Whether the earnings growth justifies the price. Short Example: A PEG below 1 means you’re getting growth at a fair price. High PEG? You’re overpaying. Strong: Below 1 Caution: Above 2 Industry Averages: - Software: below 1.5 is solid - Consumer Goods: Below 2 is more realistic - Tech: Below 1 - Consumer Staples: Below 1.5 - Healthcare: Below 1.2 - Financials: Below 1.5 - Energy: Below 1.3 Story: In mid-2022, Salesforce’s PEG was 0.8 (P/E 35, forward EPS growth 45%) as cloud demand surged. Investors who spotted this steal saw the stock climb 130% by the end of 2024. Meanwhile, Peloton in 2023 had a P/E of 20 but near-zero growth (PEG above 3). Its stock cratered -50% as fitness trends faded. Story: NVIDIA’s PEG hit 0.9 in Q3 2023 (P/E 30, growth 35%) during AI hype, a steal for tech (average PEG below 1.2). PEG filters hype. A stock can look expensive until you factor in growth. ----------------------------------------------------- 🧱 3. P/B Ratio | Price-to-Book What it tells you: How much you pay compared to what the company owns (like buildings or cash). Short Example: A P/B below 1.5 means you’re paying close to the company’s asset value. High P/B? Expect strong profits or risk. Strong: Below 1.5 Caution: Below 1 + poor earnings = value trap Industry Averages: - Banks: Below 1.5 - Insurance: Below 1.3 - REITs: Use NAV (aim below 1.2) - Tech: Often ignored - Energy: Below 2 Story: In 2024, JPMorgan Chase’s P/B was 1.4, solid for banks (average below 1.5). Investors who bought enjoyed 100% gains. n 2023, Bed Bath & Beyond’s P/B fell below 1 with collapsing earnings. It looked cheap but filed for bankruptcy that year. Tip: Only use this in asset-heavy sectors like banking or real estate. ----------------------------------------------------- ⚙️ 4. ROE | Return on Equity What it tells you: How well a company turns investor money into profits. Short Example: An ROE above 15% means the company makes good money from your investment. Low ROE? Weak returns. Strong: Above 15% Caution: Below 10% unless in slow-growth industries Industry Averages: - Tech: 20–30% - Consumer Staples: 15–25% - Utilities: 8–12% - Financials: 10–15% - Healthcare: 15–20% Story: Coca-Cola (KO) has kept ROE above 35% for years, a sign of brand power and pricing strength. Eli Lilly’s (LLY) ROE stayed above 25% from 2022–2024, a healthcare leader (average 15–20%). Its weight-loss drug Mounjaro drove consistent profits, lifting the stock 150%+ in two years. Checking ROE trends helped investors spot this winner. Tip: If ROE is high but D/E is also high, be careful, it might just be leverage. ----------------------------------------------------- 💰 5. Net Margin | Profitability What it tells you: How much profit a company keeps from its sales or what % of revenue ends up as pure profit. Short Example: A 10% margin means $10 profit per $100 in sales. Low margin? Tough business or high costs. Strong: Above 10-15%+ Caution: Below 5% Industry Averages: - Software: 20–30% - Retail: 2–5% - Manufacturing: 8–12% - Consumer Staples: 10–15% - Energy: 5–10% - Healthcare: 8–15% Story: Walmart’s (WMT) 2% net margin looks tiny — but it’s expected in retail. A software firm with 5%? That’s a warning — high costs or weak pricing. In 2023, Zoom’s (ZM) net margin fell to 5% (down from 25% in 2021), well below software’s 20–30% average. Pricing pressure and competition crushed its stock quite a lot. Meanwhile, Apple’s 25% margin in 2024 (tech average 20%) remained a cash cow. Tip: Margins show whether the company owns its pricing or competes on price. ----------------------------------------------------- 💣 6. D/E Ratio | Debt-to-Equity What it tells you: How much debt a company uses compared to investor money. Short Example: A D/E below 1 means more investor cash than debt. High D/E? Risky if profits dip. Strong: Below 1 Caution: Above 2 (except REITs or utilities) Industry Averages: - Tech: 0–0.5 - Industrials: 0.5–1.5 - REITs: 1.5–2.5 (manageable due to structure) - Utilities: 1–2 - Energy: 0.5–1.5 Story: In 2024, Tesla’s D/E dropped below 0.3 (tech average 0–0.5) as it paid down debt, signaling strength despite sales dips - a massive rally afterward. Tip: Rising debt + falling profits = a storm coming. Always check both. ----------------------------------------------------- 💵 7. Free Cash Flow (FCF) What it tells you: Cash left after paying for operations and growth investments. Short Example: Apple’s $100 billion cash pile in 2024 funded stock buybacks, boosting shares. Low cash? Trouble looms. Strong: Positive and growing Caution: Negative for multiple years Sector notes: - Tech: Lots of cash (think billions) - Industrials: Up and down, check trends - REITs: Look at FFO (cash from properties), aim high - Energy: Has cash, but swings with oil prices - Healthcare: Steady cash, not too high Story: Netflix had negative FCF while scaling content. Once costs stabilized, FCF turned positive and stock re-rated sharply. Pro tip: Profits don’t mean much without real cash. FCF is often more honest. Cash is king: Companies need cash to pay bills, reduce debt, or fund growth. If FCF is falling, they might be burning through cash reserves or borrowing, which isn’t sustainable. Potential issues : This mismatch could signal problems like poor cash collection, heavy spending, or even accounting tricks to inflate profits. ----------------------------------------------------- 🚀 8. EPS Growth | Earnings Power What it tells you: How fast a company’s profits per share are growing. Short Example: EPS up 10% yearly means more profit per share, lifting stock prices. Flat EPS? No growth, no gains. Strong: Above 10% Caution: Below 5%, flat/negative for 3+ years Industry Averages: - Tech: 15–30% - Staples: 5–10% - REITs: 3–6% (via FFO growth) - Healthcare: 10–15% - Financials: 5–10% - Energy: 5–15% (cyclical) Story: In Q1 2024, NVIDIA’s forward EPS growth of 30% (tech average 20%+) fueled a rally as AI chips dominated. Checking forward estimates helped investors avoid traps like Intel, with flat EPS and a drop. Pro tip: A stock with flat EPS and no dividend? There’s no reason to own it. ----------------------------------------------------- 💵 9. Dividend Yield | Passive Income What it tells you: How much cash you get yearly from dividends per dollar invested. Short Example: A 3% yield means $3 per $100 invested. High yield? Check if it’s sustainable. Good: ~3–4% Red Flag: Above 6% with a payout ratio above 80-90% Industry Averages: - Utilities: 3–5% - REITs: 3–6% - Consumer Staples: 2–4% - Tech: 0–2% - Energy: 2–5% ----------------------------------------------------- 💡 Final Thought: How to Use All of This Top investors don’t use just one metric. They look at the whole picture: Good growth? Check PEG. Good profits? Confirm with ROE and margin. Safe balance sheet? Look at D/E and cash flow. Fair valuation? P/E + FCF Yield + P/B. Real power = Combining metrics. A company with P/E 15, PEG 0.8, ROE 20%, low debt, and positive FCF? That’s your winner. A stock with P/E 8, but no growth, high debt, and negative cash flow? That’s a trap. ----------------------------------------------------- Real-World Combos 🎯Winners: Tech Gem: P/E 20, PEG 0.8, ROE 25%, D/E 0.4, growing FCF, EPS 20%+ (e.g., NVIDIA 2023: AI-driven growth, stock soared). Energy Steal: P/E 15, P/B 1.5, FCF positive, Dividend Yield 3.5% (e.g., Chevron 2023: Cash flow king). ⚠️Traps: Value Trap: P/E 8, flat EPS, D/E 2.5, negative FCF (e.g., Peloton 2023). Overhyped Tech: P/E 50, PEG 3, Net Margin 5%, D/E 1.5 (e.g., Rivian 2024). ----------------------------------------------------- 🚀 Share your own combos! What do you personally look for when picking a stock? If you spotted something off in the numbers, or have a valuable insight to add — please, drop it in the comments.👇 💡 Let’s turn this into a thread that’s not just good but superb and genuinely helpful for everyone. ----------------------------------------------------- Final Thought “Buy great companies at fair prices, not fair companies at great prices.” – Warren Buffett This guide gives you the map. Charts, tell you when. These numbers tell you what, and why. And this post? It’s just the beginning! These 9 metrics are part one of a bigger series I’m building — where we’ll go even deeper, with more advanced ratios, smarter combos, and real case studies. If this guide helped you see financial numbers a little clearer, there’s a good chance it’ll help your investor friend too, especially if they’re just starting their journey...🤝Share it with them! I built this as much for myself as for anyone else who wants to get better.👊 If you made it this far — thank you! 🙏 ...and super thankful if you hit "The Boost" on this post 🚀 Cheers, Vaido
VaidoVeek
$100, $1,000, $100,000 — When Numbers Become Turning Points
Hey! Have you ever wondered why 100 feels... special? 🤔 Round numbers are like hidden magnets in the market. 100. 500. 1,000. They feel complete. They stand out. They grab our attention and make us pause. In financial markets, these are the levels where price often slows down, stalls, or makes a surprising turn. I’ll admit, once I confused the market with real life. I hoped a round number would cause a reversal in any situation. Like when I stepped on the scale and saw a clean 100 staring back at me, a level often known as strong resistance. I waited for a bounce, a sudden reversal... but nothing. The market reacts. My body? Not so much. 🤷♂️ The market reacts. But why? What makes these numbers so powerful? The answer lies in our minds, in market dynamics, and in our human tendency to crave simplicity. ------------------------------------- Psychology: Why our brain loves round numbers The human mind is designed to create structure. Round numbers are like lighthouses in the chaos — simple, memorable, and logical. If someone asks how much your sofa cost, you’re more likely to say "a grand" than "963.40 dollars." That’s normal. It’s your brain seeking clarity with minimal effort. In financial markets, round numbers become key reference points. Traders, investors, even algorithms gravitate toward them. If enough people believe 100 is important, they start acting around that level — buying, selling, waiting. That belief becomes reality, whether it's rational or not. We anchor decisions to familiar numbers because they feel safe, clean, and "right." Walmart (WMT) and the $100 mark Round numbers also carry emotional weight. 100 feels like a milestone, a finish line. It’s not just a number, it’s both an ending and a beginning. ------------------------------------- Round numbers in the market: Resistance and support Round number as a resistance Imagine a stock climbing steadily: 85, 92, 98... and then it hits 100. Suddenly, it stalls. Why? Investors who bought earlier see 100 as a "perfect" profit point. "A hundred bucks. Time to sell." Many pre-set sell orders are already waiting. Most people don’t place orders at $96.73. They aim for 100. A strong and symbolic. At the same time, speculators and short sellers may step in, viewing 100 as too high. This creates pressure, slowing the rally or pushing the price back down. If a stock begins its journey at, say, $35, the next key round levels for me are: 50, 100, 150, 200, 500, 1,000, 2,000, 5,000, 10,000… Slide from my training materials These levels have proven themselves again and again — often causing sideways movement or corrections. When I recently reviewed the entire S&P 500 list, for example $200 showed up consistently as a resistance point. It’s pure psychology. Round numbers feel "high" — and it's often the perfect moment to lock in profits and reallocate capital. Bitcoin at $100,000. Netflix at $1,000. Tesla at $500. Walmart at $100. Palantir at $100. These are just a few recent examples. Round number support: A lifeline for buyers The same logic works in reverse. When price falls through 130, 115, 105... and lands near 100, buyers often step in. "100 looks like a good entry," they say. It feels like solid ground after a drop. We love comeback stories. Phoenix moments. Underdogs rising. Buy orders stack up and the price drop pauses. Some examples: Meta Platforms (META) Amazon.com (AMZN) — $100 acted as resistance for years, then became support after a breakout Tesla (TSLA) ------------------------------------- Why round numbers work for both buyers and sellers Buyers and the illusion of a bargain If a stock falls from 137 to 110 and approaches 100, buyers feel like it’s hit bottom. Psychologically, 100 feels cheap and safe. Even if the company’s fundamentals haven’t changed, 100 just "feels right." It’s like seeing a price tag of $9.99 — our brain rounds it down and feels like we got an epic deal. Sellers and the "perfect" exit When a stock rises from 180 to 195 and nears 200, many sellers place orders right at 200. "That’s a nice round number, I’ll exit there." There’s emotional satisfaction. The gain feels cleaner, more meaningful, when it ends on a round note. To be fair, I always suggest not waiting for an exact level like 200. If your stock moved through 145 > 165 > 185, don’t expect perfection. Leave room. A $190 target zone makes more sense. Often, greed kills profit before it can be realized. Don’t squeeze the lemon dry. Example: My Tesla analysis on TradingView with a $500 target — TESLA: Money On Your Screen 2.0 | Lock in Fully… Before & After: As you see there, the zone is important, not the exact number. ------------------------------------- Round numbers in breakout trades When price reaches a round number, the market often enters a kind of standoff. Buyers and sellers hesitate. The price moves sideways, say between 90 and 110. Psychologically, it’s a zone of indecision. The number is too important to ignore, but the direction isn’t clear until news or momentum pushes it. When the direction is up and the market breaks above a key level, round numbers work brilliantly for breakout trades or strength-based entries. Slide from my training materials People are willing to pay more once they see the price break through a familiar barrier. FOMO kicks in. Those who sold earlier feel regret and jump back in. And just like that, momentum builds again — until the next round-number milestone. Berkshire Hathaway (BRK.B) — every round number so far has caused mild corrections or sideways action. I’d think $500 won’t be any different. ------------------------------------- Conclusion: Simplicity rules the market Round numbers aren’t magic. They work because we, the people, make the market. We love simplicity, patterns, and emotional anchors. These price levels are where the market breathes, pauses, thinks, and decides. When you learn to recognize them, you gain an edge — not because the numbers do something, but because crowds do. A round number alone is never a reason to act. If a stock drops to 100, it doesn’t mean it’s time to buy. No single number works in isolation. You need a strategy — a set of supporting criteria that together increase the odds. Round numbers are powerful psychological levels, but the real advantage appears when they align with structure and signals. Keep round numbers on your radar. They’re the market’s psychological mirror, and just like us, the market loves beautiful numbers. If this article made you see price behavior differently, or gave you something to think about, feel free to share it. 🙌 So, that's it! A brief overview and hopefully, you found this informative. If this article made you see price behavior differently, or gave you something to think about, feel free to share it & leave a comment with your thoughts! Before you leave - Like & Boost if you find this useful! 🚀 Trade smart, Vaido…and don’t forget my first educational post about trendlines. A few more criteria and we’re building toward a solid strategy! Stay tuned....
VaidoVeek
Robinhood’s Moment of Truth! Breakout, Retest, and Go?
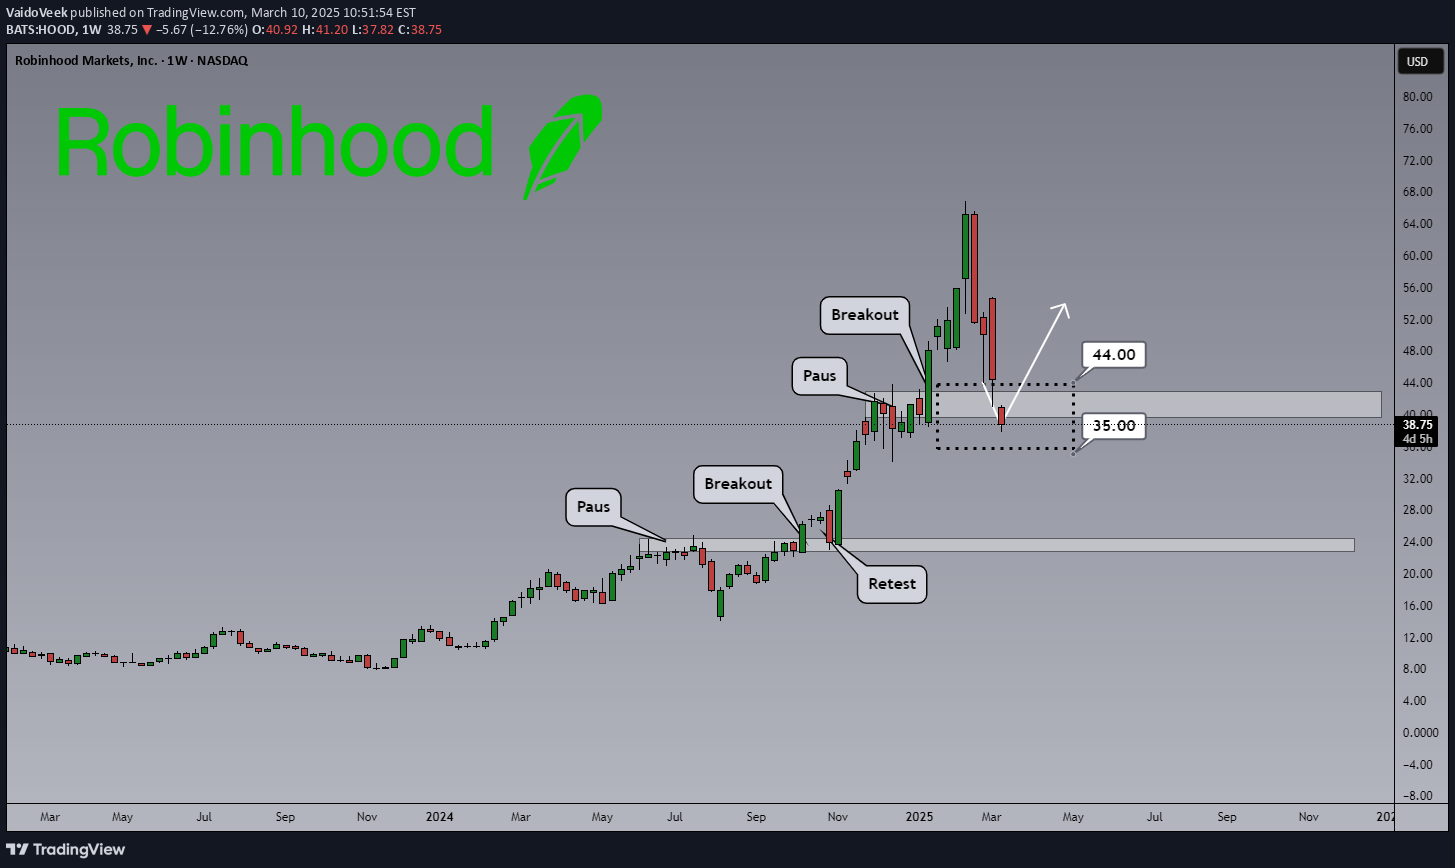
سلام ، Robinhood یکی از کاندیداهای بالقوه ای است که در فهرست S&P 500 گنجانده شده است. گروه بندی جدید در 21 مارس برگزار می شود از دیدگاه فنی a ، این یکی از مناطق ممکن است که پس از a مکث کوتاه ، ما a شکست را دیدیم و اکنون قیمت برای بازآفرینی منطقه ادغام باز شده است. البته ، اصول در اینجا نقش بزرگی را ایفا می کند ، اما از نظر تاریخی ، a تنظیم مشابه سال گذشته خوب کار کرده است. بنابراین ، منطقه تنظیم شده است - می بینید که آیا این move خود را تکرار می کند یا خیر. از نظر فنی ، دامنه اصلی 35 - 44 دلار است. به سلامتی ، وییدو
VaidoVeek
ETH Bulls vs. Bears – Who Wins at $2000?
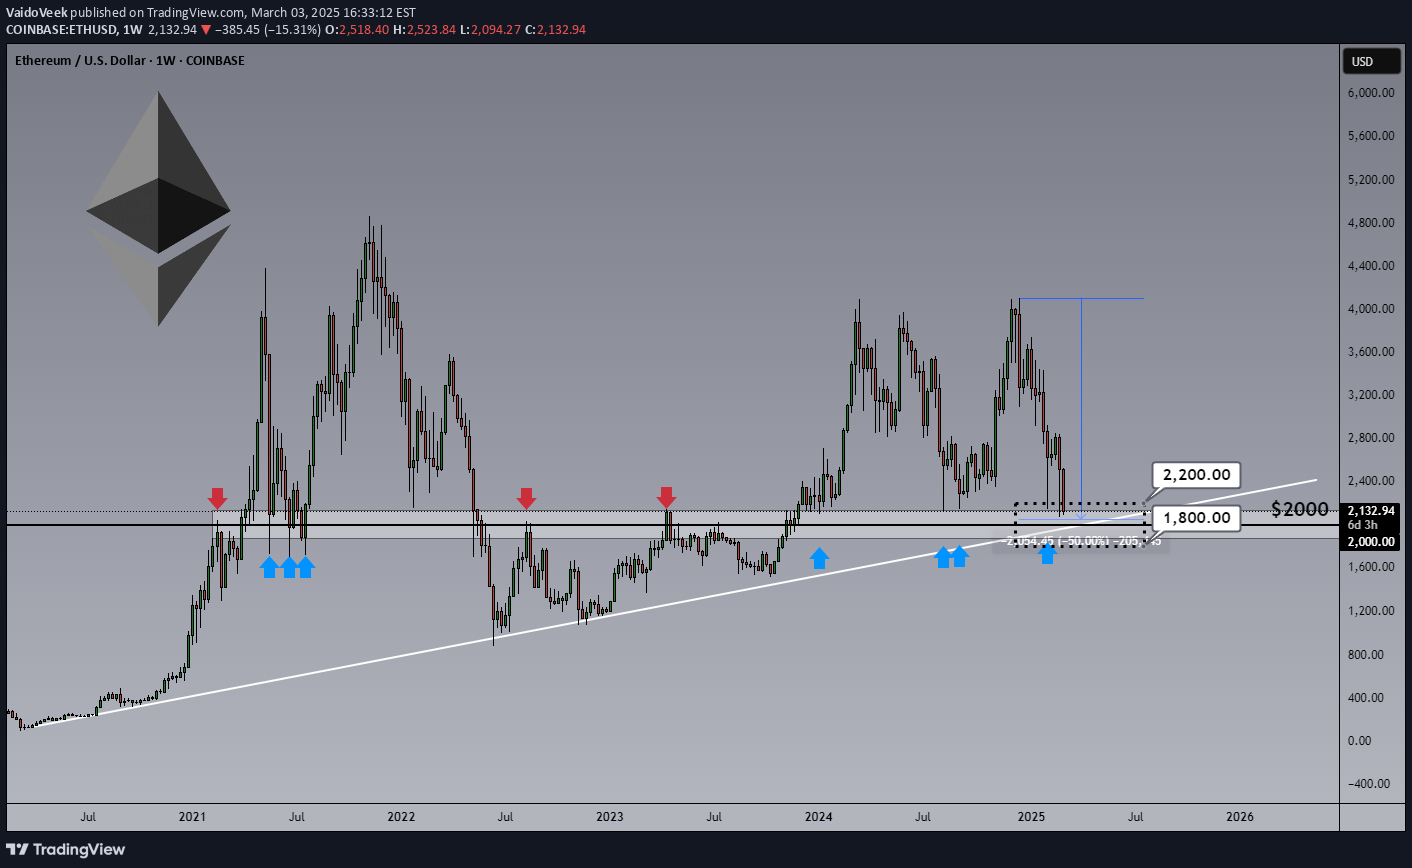
سلام به همه ، مثل همیشه ، وقتی چیز جالبی را مشاهده می کنم ، آن را به اشتراک می گذارم. در حال حاضر ، ETHUSD در یک روز -15 ٪ است و بر روی صفحه من چشمک می زند! - برای علاقه مندان ، این سطح تنظیم فنی بدی نیست. با کمبود آن ، در اینجا معیارهای کلیدی وجود دارد: Trendlinethis نهایی روند major است و باید قوی ترین مورد در نمودار باشد. متأسفانه ، این قیمت از اوج بالاتر بلند مدت حاصل نشده است ، که آن را کمی تضعیف می کند ، اما هنوز هم عوامل محکم دیگری وجود دارد که با آن هماهنگ هستند. یک منطقه Zonethis با قیمت افقی قوی در گذشته مشاهده کرده است ، بنابراین باید در اینجا از نوسانات انتظار داشته باشد. 50 ٪ از بیشترین سطح جدید به سمت روند ، این سطح از سطح پایین تر از این سطح پایین تر ضعیف تر است زیرا این سطح کاملاً ضعیف تر نیست زیرا این سطح کاملاً ضعیف تر نیست. با این حال ، از نظر تاریخی ، دارایی های رمزنگاری واکنشهای شدیدی را در مورد این سطح نشان داده اند. تعداد دور 2000 $ به عنوان یک سطح پشتیبانی روانشناختی ، قدرت اضافی را به این منطقه می افزاید. فکر می کنید؟ آیا این سطح نگه داشته می شود ، یا ما مستقیماً از آن سر و صدا می کنیم؟ افکار خود را در نظرات رها کنید! اگر دوست دارید تجزیه و تحلیل ، hit تقویت کننده ها ، Vaido ------------------------------تجزیه و تحلیل فنی عمیق تر می خواهم_؟ من بینش های مشابهی را در کانال Substack خود ارسال می کنم ، جایی که من با صرفه جویی در وقت شما و کمک به رشد پرتفوی خود ، سهام فنی قوی را در سراسر جهان تجزیه می کنم. من تجزیه و تحلیل فنی را انجام می دهم ، بنابراین شما مجبور نیستید! 🔗 link را در بیوگرافی من پیدا کنید (در زیر وب سایت icon) ، یا اگر از موبایل استفاده می کنید فقط به امضای من بروید تا زبان دلخواه خود را انتخاب کنید.
VaidoVeek
Magnificent Seven & Hot Stocks: A Technical Overview

Hello, The past few days and weeks have brought a lot of movement in the stock market, and things seem a bit more redish than before. However, these kinds of moments also bring good opportunities—if you know where to look. That’s why I decided to take a closer look at the some stocks from Magnificent Seven, scan some of the top market cap stocks, and give a short overview of what’s happening and what to watch. Since technical analysis helps bring clarity in uncertain times, I will go over some key levels and liquidity zones that could present good opportunities. I will also cover a few stocks that are currently making headlines and generating a lot of interest in the investment world—such as Robinhood (HOOD) and Palantir (PLTR). Let’s see what the market has to offer. Microsoft (MSFT) Microsoft has not made any major moves in the past few weeks, but selling pressure has started to build up, and the stock is now trading at its lowest levels in the past six months. The most interesting and strongest support area is between $290 and $300. This is a level worth keeping an eye on. -------------- Amazon (AMZN) Yesterday, I got an alert from TradingView that AMZN has dropped into an interesting price zone after a small correction. If you don’t already use alerts, I highly recommend setting them up—keeping track of every stock manually is nearly impossible. The $175–$210 zone is technically solid. Yes, it’s a wide range but there are different strategies you can use here. Amazon (AMZN) – What to do? If you don’t own AMZN yet, this could be a good spot to start building a position slowly. Buy a little in the upper part, a little in the middle, and a little in the lower part of this zone to get a balanced entry. If you already own AMZN, I’d rather wait and aim for the middle of the range if you want to add more. If the stock takes off from here, you already have a position, so there’s no real FOMO. No need to rush. Of course, this is just a technical view—you should still analyze the fundamentals and your investment thesis. The technicals have spoken and now it’s time to listen to the fundamentals. That way, you get the full picture and can react accordingly. -------------- Alphabet (GOOG) GOOG failed to break through the psychological $200 level. It has tested this level multiple times since the start of the year, but the result has been red candles. If you already own the stock and are considering adding more, or if you are thinking about an entry, the $140–$160 zone is worth watching. At the moment, I don’t see a more logical technical entry. -------------- Meta Platforms (META) META has dropped 12% from its all-time high in just a few weeks. The stock has now slowly come to, what I call, a "picking zone" (if you have a better name for it, let me know! :D)—meaning a price range where those who make regular buys might want to pay attention. Right now, the key levels to watch are ~$612 and ~$500, with $500 being the stronger level. The price has consolidated there a bit longer than around $612, and it also acts as a psychological support level. -------------- Berkshire Hathaway (BRK.B) Berkshire has reached what I consider a profit-taking zone. If your fingers are itching and your wallet is waiting for a top-up, then why not? This doesn’t mean selling everything, but it could be a good spot for a partial exit—especially if you need capital for something else. Why is this a logical profit-taking point? Looking at previous price behavior around round numbers, we can see a pattern that works every time and your money can be “stuck” for years. When a stock approaches a big round number for the first time, it tends to: Consolidate – move sideways for a long time. Get a strong correction – like Berkshire has done before. Let’s make the round number concept clearer. Imagine a stock price starts moving up from $30 and eventually reaches $1000. Within this range, the key round numbers for me are: $50, $100, $200, $500, and $1000. These are levels where major market reactions often occur or levels that I trust the most as a criterion. Let’s take Berkshire for example, touching these numbers for the first time: $50 → 50% drop, took 5 years to recover. $100 → Another 50% drop, also took 5 years to break higher. $200 → Multi-year consolidation, 20% drop. $500 → And now we’re here—your choice! In a long-term portfolio, there are essentially two types of sales: The investment thesis is no longer valid Capital is needed for another purpose If neither of these conditions is met, there’s no real reason to sell. However, if you need capital within the next six months, this could be a good point to do so. Historically, we’ve seen a pattern where the stock either undergoes a correction or remains stagnant for an extended period. That makes it a perfect candidate for profit-taking—and if a correction does happen, there’s always the opportunity to buy back at lower prices. At the moment, buying this stock could mean it stays within this price range for a few years, so I wouldn’t rush into new purchases. -------------- Tesla (TSLA) Historically, Tesla has followed technical analysis well due to its high volatility. It reflects market psychology very clearly, leaving visible footprints on the chart... ----- I also cover these topics in-depth over on my Substack channel, where I break down the full picture and share my insights on the rest. If you want the complete breakdown and my take on what’s next, head over to my Substack (ENG). 🔗 Find the link in my BIO under the Website icon or simply copy and paste it directly. See you there! 👀 Cheers, Vaido
VaidoVeek
Your Most Requested Stocks Are Here - 15 Stocks, 15 Analyses!
Hello readers, Just a few days ago, I ran a "poll" - huge thanks to everyone who participated in the comments! The response was amazing: 130 mentions, 80 different stocks, and 15 tickers that stood out with multiple mentions. Stay tuned as I break down the most requested ones! I initially planned to let this run longer, but interest has cooled off a bit, so I’ve decided to wrap it up and start summarizing the results so you can analyze them through the weekend. Now, let’s get to it: ✅ A technical breakdown of 15 stocks. ✅ Key price levels and volatility zones to watch. ✅ Possible scenarios and setups based on the charts. Some charts tell a clear story, while others… well, let’s just say not all price action is tradable and I’ll explain why. Which stocks made the list? Scroll down and let’s dive in! 15. Microsoft (MSFT) Looking at Microsoft's price movements, I wouldn’t rush into a position just yet. The stock has been stuck in this price zone for more than a year. While buying at the current levels could work out, there is also a risk that it remains in this range for another year. Instead, I see two scenarios that offer a better approach: 1. This scenario relies on waiting for a pullback. A better price = better future returns. If the price drops to $290–$355/360, I would be ready to buy. Lower price levels often offer new liquidity, providing stronger momentum in the years ahead. 2. Wait for confirmation instead of guessing. Let the market show that investors are willing to push MSFT to higher levels before entering. Over the past year, the price action has established a resistance zone at $450–$460. A monthly close above this level would provide confirmation. However, patience is still key because the round number $500 could act as an obstacle. After a breakout, you have another two options: Buy immediately after the breakout is confirmed - monthly close needed - or wait for a rejection from $500 before entering. This could provide an opportunity to buy at a similar price but with more confirmation and a stronger support level. This approach increases the chances that investment starts working more efficiently and from a better technical position. 14. Robinhood Markets (HOOD) There isn’t much to say, the stock is flying. However, to add an educational perspective, these small pauses in the movement can create liquidity zones after a pullback. If the stock pulls back and you find yourself wondering “Where is the right spot to enter?”, these pause areas provide potential opportunities. While this isn’t necessarily a setup, using these pullbacks effectively can help scale up your position in the stock or initiate a new one. Many traders hesitate, thinking, "It's too expensive, it's too expensive," suddenly the price pulls back to a pause area. When that happens, you already know what to do - set your alerts. 13. Salesforce (CRM) Confirmed Breakout: We have three clean previous yearly highs - we mark them. As investors, not traders, we focus on the strongest zone - we connect them. Within this zone, there is a minor round number at $300, and for me, the strongest retest area is currently at $270–$300. This level could serve as a key support zone for potential future entries. 12. Intel Corporation (INTC) This is quite a difficult chart with poor price action, making it challenging to navigate. Personally, I wouldn’t take any action until one of these two scenarios becomes valid. Deeper pullback for liquidity – The drop has been strong and intense and we could see lower prices as in 1996. A move below the current support level could attract new liquidity and hopefully, make the stock more attractive to investors. Break above the strongest resistance – This scenario is highly time-consuming. Right now, the stock is trading below a major resistance area, and recovering won’t be easy, especially after such a sharp drop from a 2023 positive price trend. A break above $28 would make it more attractive for me. For those already holding INTC, selling could be a strategic move. You could potentially buy back at lower prices, reducing the risk of having your investment stuck for several years. Given the current price action, breaking back above resistance will be a difficult battle - there are much better opportunities. 11. Novo Nordisk (NOVO_B) I mentioned this stock on TradingView a few months ago, as well as at a financial conference in Estonia. The price has moved a bit but here is the initial technical thesis: The key area remains 500–600 DKK, with the following criteria: - A small pause in price movement, similar to what I discussed in the HOOD analysis. - 50% retracement from the all-time high—for large-gap stocks, this level can offer strong volatility, if the fundamentals, in general, remain stable. - The round number at 500 DKK, which could act as a psychological support level. 10. Coinbase (COIN) A year and a half ago, I posted an analysis on TradingView about COIN, currently up almost 300% , highlighting an Inverted Head and Shoulders pattern. That pattern is also present today but on a much larger scale. Hopefully, history repeats itself and the outcome will be the same ;) Currently, we have a massive Inverted Head and Shoulders pattern. This pattern becomes valid only after a breakout from the neckline. Which has already happened! The price has also tested the neckline, but the movement has remained limited due to the strong resistance zone at $260–$290. Despite this, there has been a minor breakout above this level and from a technical standpoint, the price is currently trading within a potential buying zone for those interested. Key criteria: - A bullish Inverted Head and Shoulders pattern is in place. - The neckline breakout has already occurred. - A minor breakout above the strong $260–$290 zone suggests further potential. 9. Meta Platforms (META) "Pause areas" – If someone randomly picks stocks each month, for example, Apple this month, Amazon or Meta next month, then these price levels can be extremely useful for deciding what to buy. For META, the key picking areas are marked on the chart as reference points for potential pickers: 8. NIO (NIO) Mentioned three times, and I feel sorry for those expecting a useful analysis on NIO - I don’t have one. Technically, there is nothing to work with here. The price action is basically dead, moving randomly without any clear structure. Yes, I could draw lines and mark support levels but that would be misleading for both - you and me. Volume has dropped significantly compared to previous movements. When volume declines this much, previous price levels become irrelevant. As I mentioned at the beginning, if there’s something to analyze, I’ll share it. Right now, there isn’t. ------------- Closing Section (For TradingView Post), that wraps up the first eight stocks from the picks! I hope you found this analysis valuable but that's not all! The remaining 7 stocks are now live on my Substack-ENG, including: 🔹 Tesla (TSLA) – Will history repeat itself? 🔹 Amazon (AMZN) – Smart entry levels instead of buying at all-time highs. 🔹 Palantir (PLTR) – The high-risk, high-reward case. …and four more stocks that were highly requested! Substack-ENG link is in my BIO (clicking the website icon), or you can find it by scrolling up - just below the main image. See you there, Vaido Disclaimer: This post is not investment advice, and the ideas presented are not recommendations to buy or sell any securities. It is intended for educational and analytical purposes, reflecting my personal view of the current market situation. Every investor should conduct their own independent analysis and consider the risks before making any decisions.
VaidoVeek
Name Your Stocks! I’ll Analyze the Most Voted Picks!
سلام خوانندگان ، بیایید دوباره این کار را انجام دهیم! 3 سهام برتر خود را برای یک شکست فنی نامگذاری کنید! مدتی برگشت ، من این کار را با رمزنگاری انجام دادم و پاسخ مجنون بود - صدها نظر و بحث های عالی. اکنون ، من آن را به سهام می آورم! آیا این همان hype شد؟ احتمالاً نه ... اما prove اشتباه من! 😏 🔹 سه سهام مورد علاقه خود را رها کنید. 🔹 پست را تقویت کنید تا مطمئن شوید که انتخاب های شما حساب می شود. 🔹 من موارد ذکر شده را تجزیه و تحلیل می کنم ، نقاط قوت فنی ، ضعف و سناریوهای ممکن را برجسته می کنم. اگر نمودار بینش روشنی ارائه دهد ، من آنها را تجزیه می کنم. اگر اینگونه نباشد ، من به شما می گویم که چرا تجزیه و تحلیل فنی در این مورد قابل اعتماد نیست - زیرا دانستن اینکه وقتی به TA اعتماد نکنید به همان اندازه مهم است. بیایید ببینیم جامعه TradingView چه چیزی را تماشا می کند - انتخاب های خود را در زیر رها کنید و بگذارید این را امتحان کنیم! به سلامتی ، آنها در حال آمدن هستند. برای تازه بودن ، امروز من در TradingView تجزیه و تحلیل در مورد آن انجام دادم اما برای یک تحلیل فنی عمیق تر ، به کانال Substack من مراجعه کنید - محتوای اکنون برای خوانندگان انگلیسی در دسترس است. به سادگی به نمایه من بروید و روی "وب سایت" کلیک کنید. 🚀 بسیاری از افراد جدید در اینجا! و اگر نمی دانید که آیا تجزیه و تحلیل فنی واقعاً کار می کند ، در اینجا اثبات این است که می تواند بازار را شکست دهد. 🔎 پست بزرگ - نحوه ضرب و شتم S&P 500 با سلاح های خاص خود! 📈 ببینید که چگونه من از تجزیه و تحلیل فنی برای پیش بینی حرکت major استفاده کردم: از همه کسانی که رای داده اند تشکر می کنم - این یک سفر عالی بوده است! من آخر هفته "نظرسنجی" را باز نگه می دارم تا به اندازه کافی data برای یک پست خلاصه قوی و روشنگری جمع شوم. دوباره متشکرم ، و اگر هنوز موارد دلخواه خود را به اشتراک نگذاشته اید ، عقب نشینی نکنید - به دنبال آن بروید! در لحظه ، 67 هفت سهام مختلف وجود دارد و 3 مورد برتر ذکر شده 7 سوم ، 7 دوم ، 8 - نزدیک است ، بنابراین آن را حفظ کنید ؛) علاقه کمی خنک شده است ، بنابراین من این کار را می کنم و خلاصه را قبل از آخر هفته شروع می کنم. اگر اکنون فقط این را می بینید ، هنوز یک پنجره کوچک وجود دارد. برخی از انتخاب های لحظه آخر ممکن است در حالی که من لیست را نهایی می کنم ، آن را ایجاد کند - من روی آن هستم! در اینجا این است ، روز کامل تجزیه و تحلیل و نمودارها: D امیدوارم که آن را دوست داشته باشید:
سلب مسئولیت
هر محتوا و مطالب مندرج در سایت و کانالهای رسمی ارتباطی سهمتو، جمعبندی نظرات و تحلیلهای شخصی و غیر تعهد آور بوده و هیچگونه توصیهای مبنی بر خرید، فروش، ورود و یا خروج از بازارهای مالی نمی باشد. همچنین کلیه اخبار و تحلیلهای مندرج در سایت و کانالها، صرفا بازنشر اطلاعات از منابع رسمی و غیر رسمی داخلی و خارجی است و بدیهی است استفاده کنندگان محتوای مذکور، مسئول پیگیری و حصول اطمینان از اصالت و درستی مطالب هستند. از این رو ضمن سلب مسئولیت اعلام میدارد مسئولیت هرنوع تصمیم گیری و اقدام و سود و زیان احتمالی در بازار سرمایه و ارز دیجیتال، با شخص معامله گر است.