
RektMyMom
@t_RektMyMom

تریدر چه نمادی را توصیه به خرید کرده؟
سابقه خرید
تخمین بازدهی ماه به ماه تریدر
پیام های تریدر
فیلتر
نوع پیام
RektMyMom

RektMyMom

RektMyMom
GREATEST BUYING OPPORTUNITY FOR THORCHAIN! - $RUNE ANALYSIS

نمودار بالای ما چیزی است که ما آن را حرکت تکانشی بسط موج پنجم می نامیم. اساساً یک حرکت ضربه ای گسترش موج پنجم دارای موج پنجم است که طولانی ترین حرکت از 3 حرکت ضربه ای به سمت بالا است و موج 3 کوتاه ترین نیست، که باعث می شود موج 1 کوتاه ترین سه حرکت باشد. در پایان یک حرکت گسترش موج فیث، قیمت معمولاً کل حرکت را دوباره دنبال میکند، یعنی از شروع موج پنجم تا انتهای آن، که به این معنی است که میتوانیم انتظار اصلاح 100% را داشته باشیم. با این حال، همچنین می گوید که موج 5 همیشه 61.8% را دنبال می کند که rune تاکنون انجام نداده است و ما اولین سفارش های خرید خود را در منطقه 61.8 قبل از اینکه حتی رویای پایین را ببینیم (که من مقداری از پشتیبانی را در پایین ترین حد خریدم) داشت. ما می توانیم در منطقه پشتیبانی 0.764 fib سفارش دهیم زیرا حجم زیادی در آنجا معامله می شود و باید به عنوان پشتیبانی و به عنوان بدترین سناریوی موردی نگه داشته شود همانطور که در زیر مشاهده می شود توجه داشته باشید که در گسترش موج پنجم، بسیار مهم است که همپوشانی وجود نداشته باشد. همچنین باید توجه داشته باشید که نمودارهایی مانند این دلیلی است که من هنوز در مورد bitcoin نزولی هستم. تجزیه و تحلیل bitcoin زیر را بررسی کنید. اگر موافق هستید، لطفاً لایک کنید و نظرات خود را در نظرات به اشتراک بگذارید. بازخورد همیشه قدردانی می شود.
RektMyMom
(XVS)VENUS 61.8 RETRACE☑️ WHAT NEXT?

در آخرین تجزیه و تحلیل ونوس خود، در مورد اینکه چگونه قیمت می تواند تا سطح حمایت 61.8% فیب کاهش یابد، همانطور که در زیر نشان داده شده است صحبت کردیم. حالا که به آن سطح رسیده ایم، سوال این است که بعد چه اتفاقی می افتد؟ علاوه بر کانال روند صعودی که در دفعه قبل ایجاد کردیم، قیمت توانست در یک کانال روند نزولی نیز نفوذ کند که در تحلیل قبلی ما مورد توجه قرار نگرفت. یک ورود مطمئن این است که منتظر بمانید تا قیمت کانال روند نزولی را به کانال روند صعودی بازگرداند و قبل از خرید مجدداً آزمایش کنید، یا منتظر بمانید تا برای دومین آزمایش حمایت از کانال روند نزولی اگر قبلا وارد نشده اید. ما همچنین یک بهروزرسانی را به تحلیل اصلی خود اضافه کردیم و به این اشاره کردیم که میتوانیم در منطقه 123.6 fib با 161.8 که بدترین سناریو است همانطور که در زیر نشان داده شده است، پایین بیایم. توقف های خود را زیر منطقه 161.8 و hodl داشته باشید اولین هدف - قبلی هدف دوم - مقاومت فیب 1.382 هدف سوم- مقاومت فیب 0.1.618 اگر موافق هستید لطفاً لایک کنید و نظرات خود را در نظرات به اشتراک بگذارید همیشه ریسک های خود را مدیریت کنید
RektMyMom
I BOUGHT MORE QTUM (POTENTIAL 10X PLAY)

به سری تجزیه و تحلیل QTUM ما خوش آمدید در اولین تحلیل ما، همانطور که در نمودار زیر نشان داده شده است، به مناطق خرید برای پایین بودن احتمالی اشاره کردیم. با دیدگاهی متفاوت. در دو تحلیل قبلی خود، 2 خط روند ترسیم کردیم که قیمت همچنان به آنها احترام میگذارد، همانطور که در زیر نشان داده شده است. بسته به مدت زمانی که دوباره مقاومت را آزمایش می کنیم، هدف حداقل 80 تا 100 دلار دارد و با موج پنجم ما که در نهایت در مقاومت فیب 1.382-1.618 قرار می گیرد، همسو می شود. ایده های قبلی در زیر پیوند داده شده اند. در خط روند دیگری اضافه شده است. در حال اجرا در سراسر نمودار برای رد احتمالی و یک منطقه سود. به این ترتیب، اگر 80 دلار دریافت نکنیم، میتوانیم رشد موج 5 و 1 را تقریباً برابر یا نزدیک به هم داشته باشیم، حتی اگر هنوز از نظر فنی کوتاهتر از موج 3 باشد. Bitcoin شیرجه بزنید، ما به احتمال زیاد قبل از حرکت به سمت بالا، حمایت 4 دلاری را دوباره آزمایش کرد. اگر با این موافق هستید، لطفاً یک لایک و نظرات خود را در بخش نظرات بگذارید. مثل همیشه، بازخورد قابل قدردانی است. 2>. منطقه مورد علاقه بعدی همانطور که قبلاً گفته شد، سطح دلار 4.4 دلار بود. احتمال زیاد تعداد موج در این مورد باطل می شود، اما اجازه می دهد تا ببینیم چگونه پیش می رود.
RektMyMom
BACK TO MY ORIGINAL GAMEPLAN. MONSTER MOVE COMING FOR LITECOIN!

اگر برای مدت طولانی دنبال کننده بوده اید، پس از داستان نام کاربری من و برنامه من برای بازگرداندن همه چیز در آن زمان می دانید. خوب، وقت آن است که دوباره از آن برنامه بازدید کنید. با نگاهی به نمودار بالا، عملکرد فعلی قیمت نشان دهنده است. برای تایید یک امتداد موج اول. گسترش موج اول و حرکت ضربه ای است که از 5 موج ضربه ای تشکیل شده است، 3 موج به سمت بالا (1، 3 و 5) و 2 اصلاحی waves (2 و 4)، که موج 1 همیشه طولانی ترین و موج 5 کوتاه ترین است. موج 3 بدون توجه به تمدید نمی تواند کوتاه ترین باشد. اکنون، همانطور که از پایین در اوایل سال 2015 می بینیم، قیمت افزایش یافت و در مجموع رشد 83700 درصدی را پیش از یافتن حمایت در ناحیه فیب 0.382 افزایش داد (این اولین مورد است. مرحله گسترش موج اول). با تشکیل یک کانال در فرآیند پس از دو نقطه لمس قیمت در مقاومت، لمس دوم در پشتیبانی در دومین آزمایش مجدد ناحیه فیب 0.382 انجام شد. اگر این واقعاً یک گسترش موج اول باشد، ما هدف موج 3 خود را دقیقاً زیر مقاومت فیب 1.618 داشت، بنابراین، مقاومت فیب 1.382-1.5 باید معیار خوبی برای رد شدن قیمت باشد و کاملاً با کانال و فراکتال ما همسو می شود. (تقریباً برای فراکتال) اگر Bitcoin همانطور که در تجزیه و تحلیل اخیر من توضیح داده شد (link در زیر) باید پایین است، پس این باید برای لایت کوین نیز پایین باشد، در غیر این صورت خطر می کنیم که پشتیبانی افقی (نارنجی) را یک بار دیگر آزمایش کنیم. و یک فتیله احتمالی به منطقه 0.618 (74 دلار) اگر با این ایده موافق هستید، لطفاً یک لایک و نظرات خود را در بخش نظرات بگذارید. مثل همیشه، بازخورد قابل قدردانی است. توقف بعدی برای litecoin اگر این محدوده را از دست دادیم، نباید از منطقه سبز (123.6) رد نشوید، در غیر این صورت قبل از یافتن انتهایی به سمت 161.8 مستقیم می رویم.
RektMyMom
EVER HEARD OF THE SEX GODESS NAMED POLKADOT???

با سلام خدمت شما تاجران امروز جفت معاملاتی نقطه/USDT را در نظر می گیریم با نگاهی به نمودار بالای خود، میتوانیم ببینیم که از زمانی که dot فهرست شد (یا حداقل پس از تغییر نام تجاری)، قیمت همچنان به خط روند صعودی احترام میگذارد و در عین حال یک الگوی مثلث صعودی را در فرآیند تشکیل میدهد. در حال حاضر near از خط روند پشتیبانی میکند، و همچنان در اصلاح موج 2 بزرگتر، قیمت تقریباً به کف رسیده است. با نگاهی به rsi ما، از زمانی که موج 1 بالا و قیمت به مقاومت مثلث ما برخورد کردند، یک واگرایی نزولی شکل گرفت که هم اقدام قیمت و هم rsi ما را به مناطقی برای ولگردی خرید، به ویژه rsi به منطقه فروش بیش از حد و قیمت فرستاد. به انباشت. اگر همان الگوی خود تکرار شود (و به نظر می رسد که ممکن است)، ما می توانیم انتظار داشته باشیم one آخرین بازگشت به پشتیبانی خط روند قبل از آماده شدن برای حرکت موج ضربه ای دیگر برای تکمیل موج 3. منطقه سود با در نظر گرفتن طول مثلث از ابتدا تا مقاومت و قرار دادن آن در بالای مثلث به همراه برخی تلاقی های دیگر بر روی ابزار فیبوناچی محاسبه می شود. تجارت idea: --dca راه خود را به پشتیبانی مثلث پایین می آورید -منطقه سود هدف برای سودهای سریع - بقیه را تا رد قیمت strong نگه دارید. اگر با این ایده موافق هستید، لطفاً یک لایک و همچنین نظرات خود را در بخش نظرات بگذارید. مثل همیشه، بازخورد قدردانی می شود!
RektMyMom
IS THE SANDBOX MADE UP OF QUICK SAND? (BUY ZONES!!!) METAVERSE

با سلام به سرمایه گذاران! امروز ما جفت معاملاتی SAND/USDTA را در نظر می گیریم، خب، بیایید شروع کنیم!Sand از زمانی که در آگوست سال گذشته فهرست شد، شاهد رشد قیمت قابل توجهی بوده است و کانالی صعودی را تشکیل می دهد که هر بار که آزمایش شده است، قیمت همچنان رعایت می شود. سوال این است که آیا این بار به آن احترام میگذارد؟ با نگاهی به RSI، یک شکل پایین شروع به شکلگیری کرد و در عین حال یک محدوده انباشته در عمل قیمت ایجاد کرد و با جهش دوم در حمایت rsi قبل از شکست از محدوده تأیید شد. رشد 1537٪ از بالای محدوده بود. به زودی، Sand برای کانال فعلی خود (هم در قیمت و هم در RSI) مقاومت ایجاد می کند که یک بالا را علامت گذاری می کند و آن را با یک تجمع کوچک در Price و RSI (دایره آبی) تأیید می کند. ، قبل از رد شدن در حمایت کانال، شکستن به زیر سطح rsi 50 و همچنین خط روند آن و تایید پایین بودن با جهش های متعدد در منطقه بیش فروش RSI و عمل قیمت پس از موج 3 بالا. هر بازه انباشته از شکست به بالا بازدهی کاهشی داشت، از این رو بسته به زمان کاهش یا آزمایش مقاومت یک بار دیگر، پیش بینی های چندگانه نشان داده می شود.ENDGAME: منتظر باشید تا قیمت به منطقه اشباع فروش RSI یا پشتیبانی کانال برای خرید بازگردد. باندهای action.ATR پیشنهاد میکنند که یک حرکت تند نیز در راه است. اگر این بار این دو همگام نشدند، سناریوی پایینی گسترش موج پنجم را رد نکنید. اگر با این ایده موافق هستید، لطفاً لایک و اشتراک بگذارید🙏 و همچنین نظرات خود را در بخش نظرات. مثل همیشه، از بازخورد استقبال میشود. توجه: مدت زمان پیشبینی موج ممکن است نادرست باشد! منطقه آبی باید بخواند، در صورتی که گسترش موج اول در پایین باشد، نه گسترش موج سوم. می تواند یک علامت صعودی باشد، ما استراتژی DCA خود را ادامه می دهیم
RektMyMom
KADENA WILL ENTER PRICE DISCOVERY! UNDERVALUED PROJECT
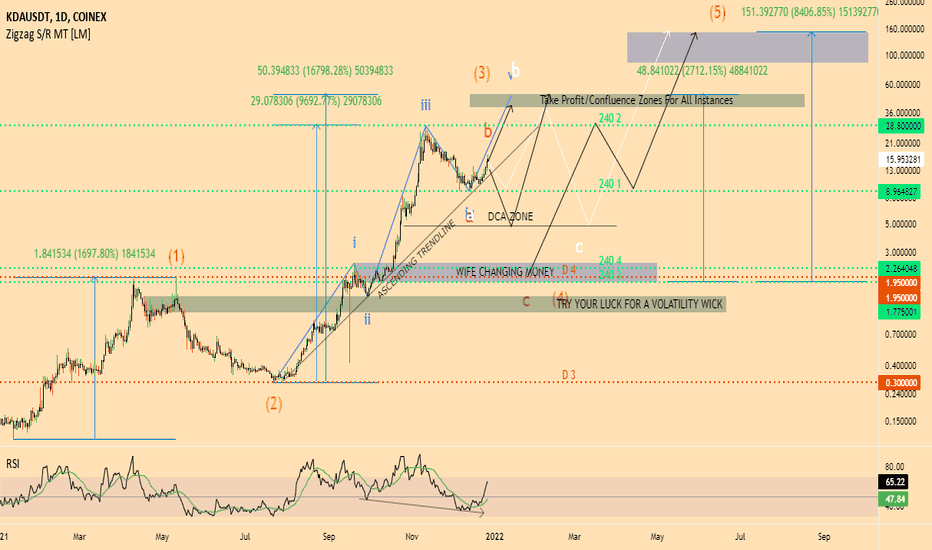
سلام معامله گران! امروز ما جفت معاملاتی KDA/USDTFirst-off را از نقطه نظر بنیادی در نظر گرفت، Kadena یک پروژه قوی با موارد استفاده جذاب است که یکی از اولین مقیاس پذیر آماده برای کاربرد، بلاک چین بافته شده عمومی، امنیت را ارائه می دهد. و توان عملیاتی، با ماموریت متحد کردن برنامه های کاربردی عمومی، بلاک چین های خصوصی، و سایر بلاک چین های قابل همکاری در یک مکان، هدایت ترافیک به سمت کامپیوتر با پهنای باند بالا در قلب بلاک چین عمومی Kadena. دوم از solana. 480,000 تراکنش در ثانیه در مقایسه با 2,777 سولانا، همه به لطف زنجیره های بافته شده آن است. با حرکت به سمت جنبه فنی چیزها، نمودار بالا نشان می دهد که Kadena همراه با اصول آن کمتر از ارزش گذاری شده است. واگرایی صعودی چیزهای پیچیده ای را تشکیل می دهد، بنابراین اگر سناریوهای متعدد را در نظر نگیریم. همه. در حال حاضر در یک حرکت ضربه ای 5 جهته بزرگ (نارنجی)، اقدام قیمت هنوز موج سوم را تکمیل نکرده است. ) ثابت موج می زنند، یا روی موج برای پنجمین موج ضربه ای آن برای تکمیل موج 3 درجه بزرگتر. (هنوز خط روند صعودی خود را حفظ کرده اید، مسیر سفید در حال حاضر معتبر به نظر می رسد) مسیرهایی که قیمت می تواند دنبال کند، مشخص شده است، که هر کدام از قوانین شمارش امواج پیروی می کنند. پشتیبانی منطقه DCA/240(1) منطقه خوبی برای گرفتن برخی از آنها صرف نظر از اینکه کدام یک است. سناریو اجرا می شود. منطقه پشتیبانی آبی در ناحیه پشتیبانی D4 (پشتیبانی 0.618) بهترین مکان برای خریدهای بزرگ است. هدف اصلی باید موج 5 بسیار طولانی تر از موج 1 باشد. در هر صورت، موج 3 طولانی ترین به نظر می رسد و این را به یک پسوند موج سوم تبدیل می کند. فراموش نکنید که صرافی های اصلی لیست شده در حال حاضر KuCoin، Coinex، Bittrex و Gate.io هستند. بایننس، کوینبیس، FTX، Bitstamp، OKEX، Crypto.com، Poloniex، Huobi Global، Uniswap، Upbit و صرافیهای دیگر هنوز فهرست نشدهاند KADENA. ما زود هستیم! به روز رسانی به نمودار! به نظر میرسد منطقه DCA ما یک توقف احتمالی برای قیمت بود، اگر RSI الگوی خود را تکرار کند. قیمت توانسته راه خود را به منطقه DCA ما بیابد و ما چند مسیر را در فرآیند حذف کردهایم. عمل قیمت روز به روز واضحتر میشود. !
RektMyMom
UNISWAP BEARISH DIVERGENCE 4H TIMEFRAME. SHORT POSSIBILITY!

با برداشتن از جایی که دیروز در تجزیه و تحلیل خود در UNISWAP ترک کردیم (پیوند شده در زیر)، به نظر میرسد که قیمت بالاتر از پرچم شکسته شده است در حالی که یک واگرایی نزولی در فرآیند ایجاد میکند. ممکن است فرصت کوتاهی باشد و به احتمال زیاد تا زمانی که باطل نشود، تقلبی بود. البته. ایده تجارت؛ قبل از کوتاه شدن منتظر بمانید تا قیمت به زیر مقاومت بسته شود. با یک توقف ضرر بالاتر از رد شدن و حمایت هدف از نشان وارد شوید. اگر با این ایده موافق هستید، لطفاً یک لایک و همچنین افکار خود را در قسمت زیر بگذارید. بخش نظرات. مثل همیشه، بازخورد قابل قدردانی است. واگرایی نزولی پنهان تأیید شد و اکنون معامله انجام شده است. در supportTrade کامل سود بردید. یک دقیقه از به روز رسانی گذشته است، اما معلوم شد که معامله به نفع ما بوده است و راه اندازی انجام شده است. واقعا درسته اگر این معامله را انجام دادید، تبریک می گوییم.
سلب مسئولیت
هر محتوا و مطالب مندرج در سایت و کانالهای رسمی ارتباطی سهمتو، جمعبندی نظرات و تحلیلهای شخصی و غیر تعهد آور بوده و هیچگونه توصیهای مبنی بر خرید، فروش، ورود و یا خروج از بازارهای مالی نمی باشد. همچنین کلیه اخبار و تحلیلهای مندرج در سایت و کانالها، صرفا بازنشر اطلاعات از منابع رسمی و غیر رسمی داخلی و خارجی است و بدیهی است استفاده کنندگان محتوای مذکور، مسئول پیگیری و حصول اطمینان از اصالت و درستی مطالب هستند. از این رو ضمن سلب مسئولیت اعلام میدارد مسئولیت هرنوع تصمیم گیری و اقدام و سود و زیان احتمالی در بازار سرمایه و ارز دیجیتال، با شخص معامله گر است.