
mukit1
@t_mukit1

What symbols does the trader recommend buying?
Purchase History
پیام های تریدر
Filter
mukit1
XLMUSD: Will price ever catchup with the realworld use cases?

When XLM removed it's inflationary tokenomics and make 50 billion supply-cap, my thought has been that it would be a real contender for XRP, even though the coin started as a beef with XRP in the first place. A lot changed since and XLM has curved its own path. With nations building UBI funds, very stable, stable coins, Visa partnership, real scaling that is not some BS metric, XLM has a lot going on. But price hasn't been reflecting the real progress that has been made. XRP has made a new ATH with BTC and ETH, but XLM made yet another lower high. Good news is, structurally, we are looking at a textbook triangle. At this point, to stay a triangle, price cannot break below $0.07. At the moment, it is looking to finish the final C wave leg to complete the 8 yearlong correction. Generally, the longer the energy generates, the more explosive the release. Crypto markets as a whole might be dealing with the downturn for another 4 to 6 months. XLM could also take that time to finish up. The second half of 2026 is looking to be the cycle that never came in 2025! My target for the primary C wave is in the double digits. That could mean $250 billion to $300 billion market cap for XLM, similar to what ETH has been in this market cycle. Will it happen, we will need to wait and see. The market cap might need to come at a cost of many other BS tokens to finally get liquified to make room for the real world assets. The industry is maturing and so are the retail investors. Right now, looking for price go head down to about $0.16 to $0.11 to reload.
mukit1
چرا قیمت SUI سقوط کرد؟ راز فشار سنگین توکنسوزیها فاش شد!

The series of massive token unlocks is not helping the price for SUI. Fundamentally, the project is strong and building solutions for easy development platforms and scaling. The side projects such as Walrus and Nautilus make it a fully self-sustaining ecosystem. Along with ETF filings and defi growth, the multi chain expansions are nothing but excellent performance. However, the price chart looks like a meme coin crash! What on earth is going on over there? The answer to this question lies in their tokenomics. Unlike other chains, they have monthly dilutions and pretty hefty ones. Since May 2025, SUI has been flooding the market with 1-2% of supply every first of the month. This is putting a massive pressure to an already weak market. the October unlock lined up with the overall crypto market flash crash and the price hasn't recovered since. Now, we may have only one path to see this correction through. We may see a yearend rally back to $1.7, but that will most likely be a wave C of 2. At this point, the Unlock schedules next year will again put massive downward pressure. We might see a slow bleeding downwards until April or May of next year. By the time SUI completes a complete 5 waves moves, price might go below $.50. There is a support zone between $.45 and $.35. If that breaks, then the floor might not exist. Overall crypto market might need another 3 - 6 months to find the long-term bottom. Until we get some kind of excitement coming back in the market, it is not the time to put the USD to use.
mukit1
پیشبینی قیمت دوج کوین: آیا ریزش بزرگ در راه است؟ (تحلیل امواج الیوت)

So far looks like an expanding ending diagonal to complete wave C of 2. At the moment We might see some sideways to down action for wave b of 4 and a rally to complete wave c of 4. Wave 4 should go above $0.15 to breach wave 1 territory. After that another 3 waves down to complete the sequence. This idea will be wrong if price moves above $0.187. Doesn't mean that the correction is over, only means it is a different shape. It could also be a triangle for Y wave which may drag on for another few months. For now, looking for wave 4 and 5 to finish.
mukit1
NVDA: Wave 4!!
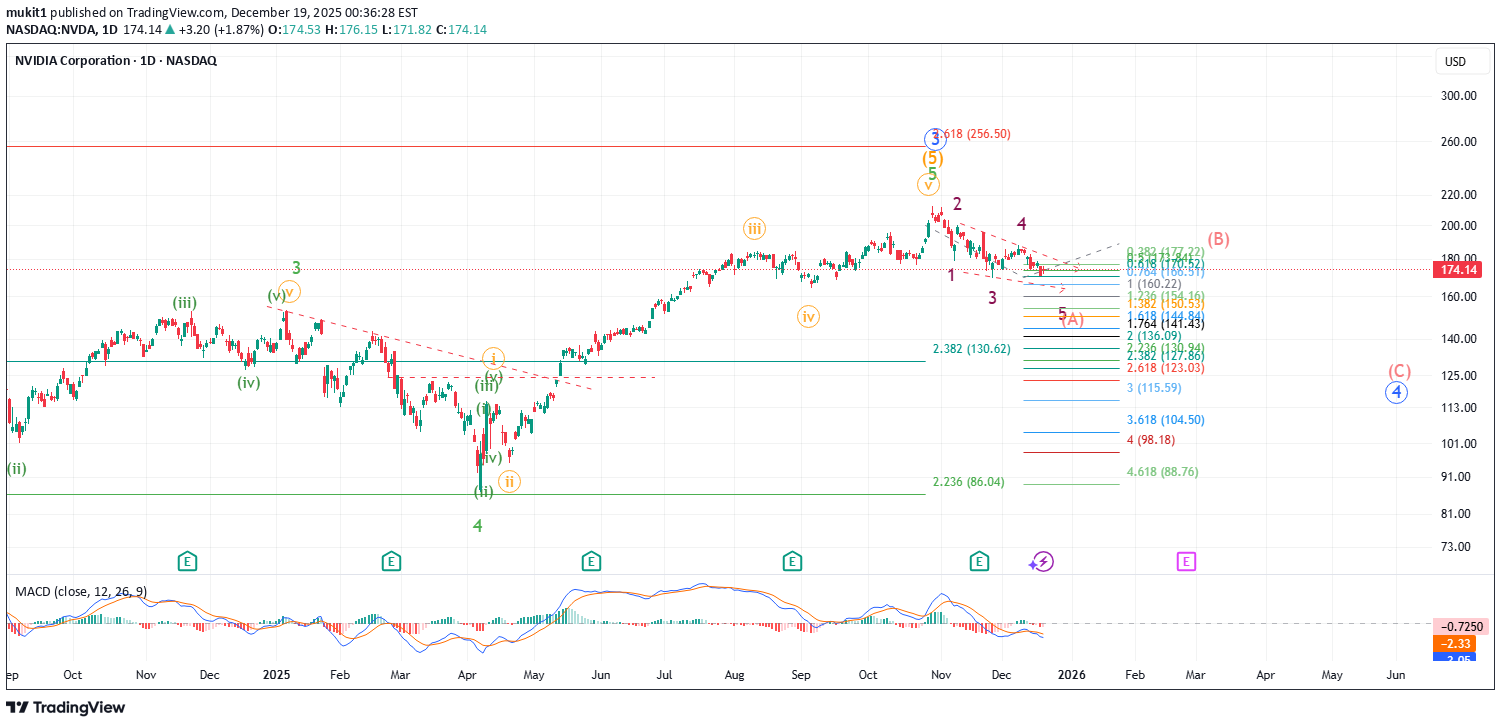
At the moment the price action for NVDA is looking like a contracting diagonal to the downside finishing up the final abc for leg 5. That means the October high has marked the very powerful primary degree wave 3. Primary wave 4 can take any shape between, flat, zigzag or triangle. The primary wave 2 was a very sharp and dramatic zigzag during the 2007-2009 great financial crisis. As a probability of alternation, wave 4 could be a long sideways wxy or a triangle. This initial leading diagonal could be the wave 1 or wave A leg of the correction. With some prominent figures publicly shorting the stock and competitors trying to catch up, NVDA might start to see some volatility. Wave 4s are designed to shake people out of their positions, both long and short. And we might see exactly that. It is time to stop being passive and start to watch movements very closely. Primary wave 4 can last for one year to 18 months for stock that has 26 years of price action and a wave 2 that lasted 1 year. We can even see higher highs if the corrections take a shape of an expanded correction. But one thing for sure, short-term traders will see BTC like price action that they dream of. Long term holders need to be careful. Active management is very important for the near future. Price targets will be very difficult to predict more than a couple of weeks out. For now, the diagonal should make a lower low below $169.55 and complete above $160.22 to stay a contracting diagonal. If price breaks above $188 before making the lower lor or breaks below $160, then it is not a diagonal and maybe a wxy to complete the first wave. There are many open scenarios, so until some more time passes, I will be watching the price action and maybe take a small very short-term swing trades.
mukit1
آیا بیت کوین به پایان راه رسید؟ تحلیل ترسناک و فرصتهای پنهان!
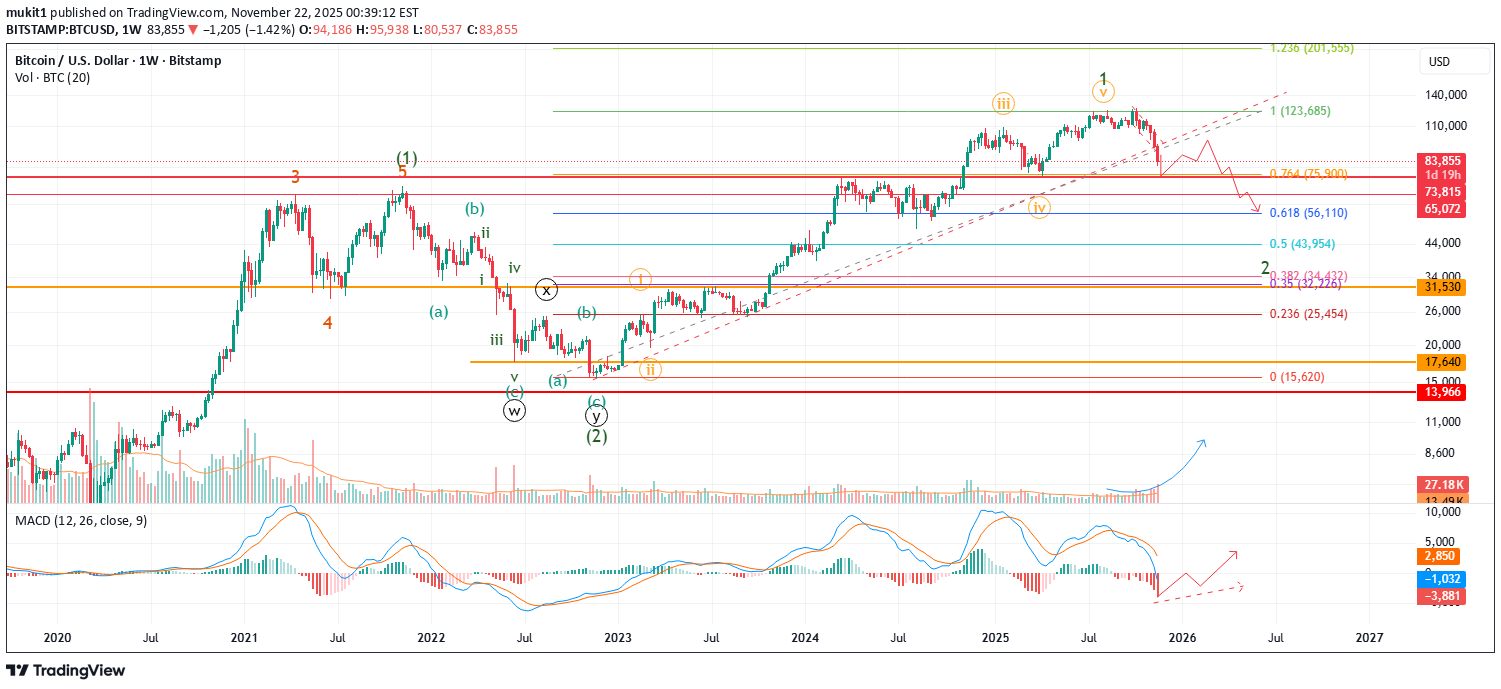
No, we are not, not yet! But more pain is ahead, most likely. The weekly volume is increasing with the price drop, but still not significant enough to confirm capitulation. The retrace so far, has not come down significantly enough to confirm wave 2 yet. If next week, price comes down below $75.4 k and confirms a lower low and 0.764 retrace It could officially be marked as wave 2 of the Minor degree. This drop is comparable to 2014, 2018 and 2021 drops. In 2014, price made a big markup only to crash again and make a lower low. In 2018 we had the infamous 6k to 3k drop which marked the historic low will never be revisited again most likely. In both of those crashes, BTC was already struggling for a while in a long bear market. The current price action looks similar to 2021. First in Q1 there was a top, then after the correction, price made a slightly higher high in Q3, only to grab the breakout players and crush all hopes and dreams. For this cycle, we can count the bear market start from the August top. September top is most likely an extended B wave of either Minute or Minuette degree (we will find out much later). If that fractal is playing out this time, then we should see a B wave bounce soon and another sharp C wave into the first half of 2026. Now, whatever point creates the bounce we need to watch if it is in 3 or 5 waves on the same degree. I will not be easy, but we need to be patient here. C wave can be very painful, but at the same time, it will be an opportunity to reload the boat. Do not get excited on the bounce and get 100x leverage. This has been so far the best bear market in the entire life of BTC. We have only seen a 35% decline thans to extended b wave. Now, the name of the game is to accumulate before the bounce and take some profit at the resistance areas to prepare for another drop. If price still drops again, at 60k, everyone will declare BTC as dead. At 45k, institutions will start to offload. If, by any chance price goes to 32k, there will be not a single bull left. But I will be accumulating on those levels regardless. No leverage, not my life savings, not putting anything on mortgage. Just use the dry powder, save up what I can and put in BTC. Because the next move up with be the move for the history books (wave 3 of 3 of 3 of 3).....
mukit1
اتریوم در کف قیمتی؟ تحلیل مهم سطوح حمایتی و زمان احتمالی انفجار بزرگ بعدی
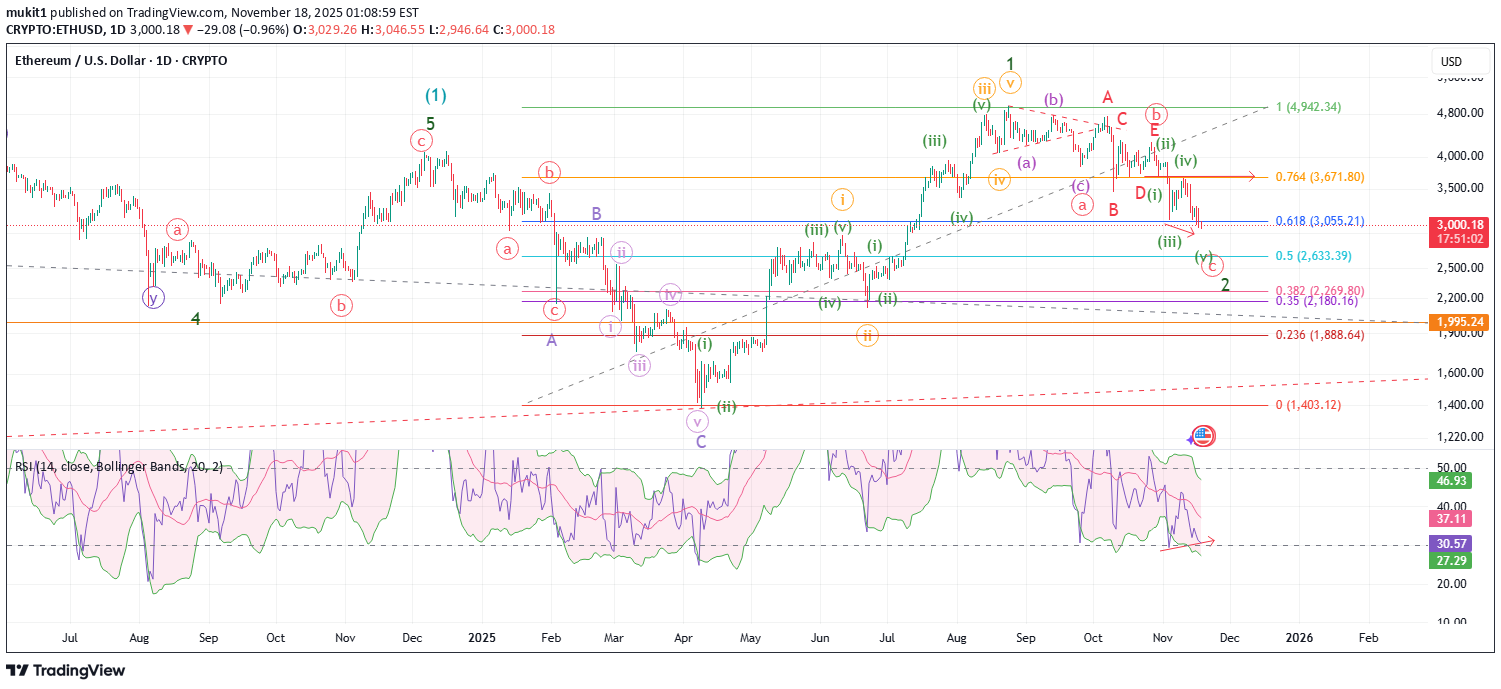
ETH is at a make or break area at the moment. $2870-$2950 is a super major support zone for ETH. If price wants to go down a bit more, then the 0.5 fib level at $2730-$2630 would be another very strong support. The last bit of support would be the golden zone area between $2270 - $2180. Elliott wave perspective, ETH might have come to a spot where no one would complain if it turned around from here. RSI is showing bullish divergence. We can make a case for a full 5 waves for C. If market has other ideas, then this could be a larger wave 3 for a nested 1/2, 1/2. If that is the case, then price might head down to the lower levels mentioned above. But, for now, it does seem like capitulation has taken place, and the sell pressure has peaked. Until price is above at least $4285, it can still be a larger AB with another leg down for C. Ideally, we would want to see another ATH with a complete 5 waves sequence up before we know for sure. My plan is to start nibbling ASAP to add back to my bag with a stop loss. When the sentiment is this bearish, it has always worked out, at least in the short term. If the minor Wave 2 is indeed over, then we should start prepping for massive fireworks. On macro cycle minor wave 3s are the strongest. We'll see how things go, but I am hopeful; until market decides to throw dirt in my eyes!
mukit1
آکاش نتورک (AKT): اسب سرکش رمزارز برای انفجار هوش مصنوعی!
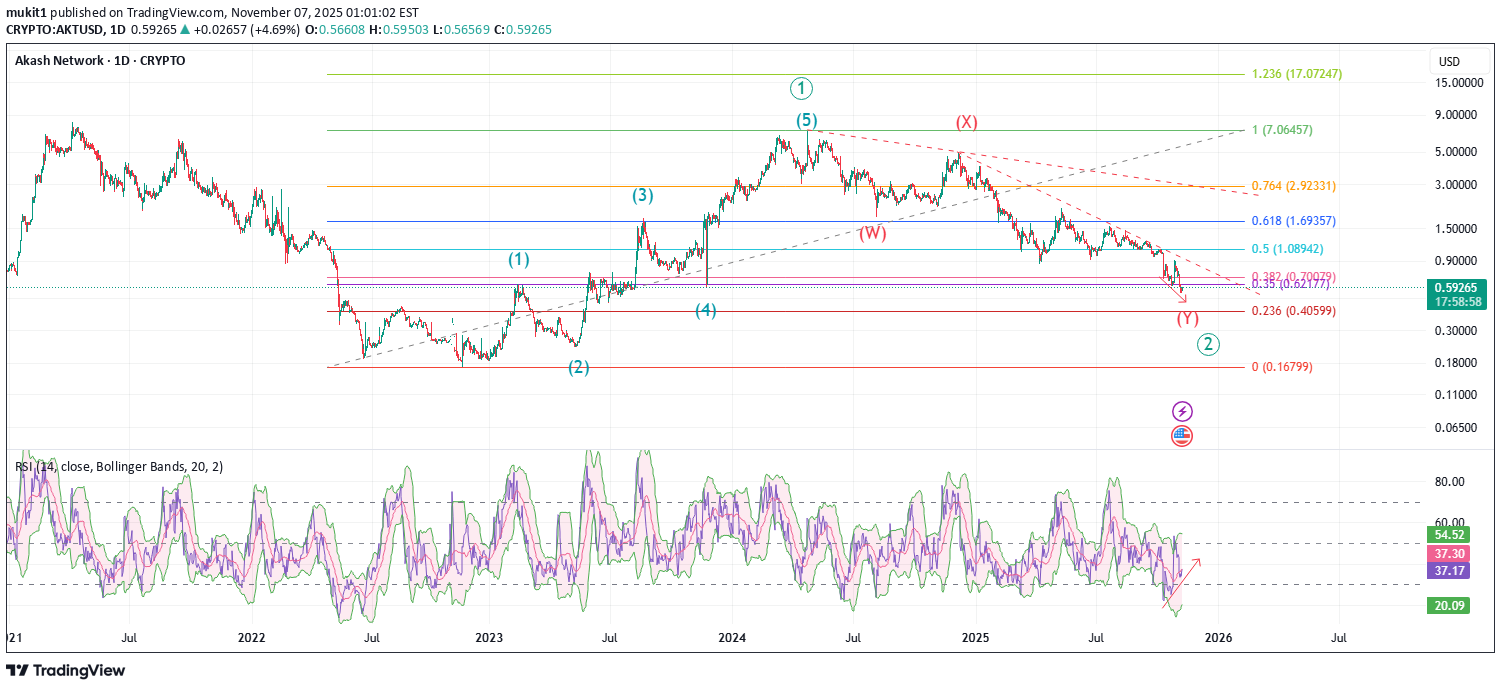
I have been researching assets that fall into the cross section of AI compute and Crypto. Some more prominent ones like RNDR, FIL etc. are ok, but I was looking for something with 100x potential; something that have been severely depressed. I found Akash Network. Cosmos chain has been terrible for the ecosystem and has done nothing for the true potential of the chain. The fundamentals are pretty solid. They are not in the business of competing against AWS or Azure. But they are perfect for cheap and fast infrastructure to run AI agents and rag tools. They need to find a new home same as RNDR moved into SOL. If they can do this without any major fallout, I think now is the time, the price will start to reflect the potential. Chart technicals are showing strong bullish divergence in RSI. EW structure is looking pretty text book completion or near completion. I started to accumulate at the golden zone. Will accumulate a bit more if price hits $0.4. But, I would expect a solid bounce to come very soon. At the moment, the market is a bit risky, so, I will not go in too deep. Long term, this could be a good alt to hold for a few years.
mukit1
آیا کف قیمت گرَیت (GRT) رسیده است؟ زمان خرید استراتژیک فرا رسید!
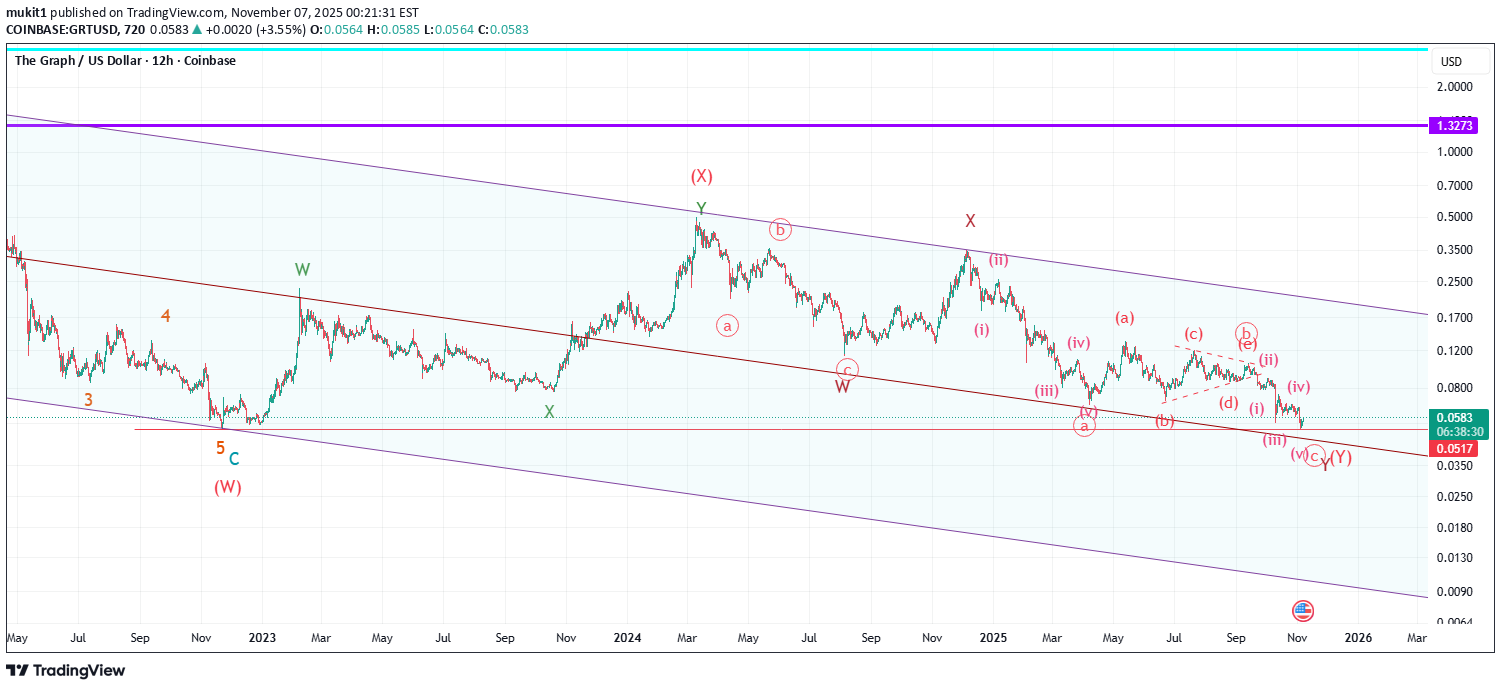
I haven't looked at GRT for a while. This coin still holds a lot of potential, but not much to show for. Throughout this cycle, the price has only gone down. If the bottom has been reached is anyone's guess, but Eliott Waves technicals are pointing at an end of cycle. The last leg might already be done, or we have wave 1 of 5 of C and price might head lower. If the low is in, or about to be in, we should see a 5 waves structure upward to complete wave 1. If price is about to hit lower, then it should start making new lows for wave 3 right away. Either way, I will be interested to see this run to come to an end. I might start to nibble if price breaks down and touches the mid line of the channel. If price goes up and finishes a 5 wave structure, I will start to nibble on the wave 2 retrace. Bottom line, I would accumulate a little bag in the next couple of months. At the least, I would expect a healthy bounce towards the top of the channel.
mukit1
پایان تب و تاب صعودی سولانا (SUI)؛ دو سناریوی شگفتانگیز برای آینده قیمت!

SUI bullish price action stalled when it failed to break higher in September, putting an end to a series of 1/2 moves to bed then crashing into the October low. The actual low is debatable, but Binance seems to have gotten hit the hardest, so let's go with that. Now the 5 wave moves in between seem to be parts of a and C waves of various degrees. Depending on how the next price action unfolds, there could be 2 bullish options. 1. Less bullish leading diagonal: In this scenario, we should see 3 wave move up to make new highs for primary wave 3. The lazier the start, the stronger validation for this scenario. Depending on, if the structure is expanding or contracting, the target could be somewhere in between $11 to $70 in the next two years or so. Lazier the action, lower the target. As long as the last wick low holds SUI can chug along. 2. More bullish 1/2, 1/2: In this scenario, the current price action is even a lower degree, maybe a minute degree 1/2 in progress. In this scenario, there is no room for additional downtime. Price needs to move soon and very strongly. Price can correct a bit more, maybe test the $1.5 support, but things cannot drag on for months. Decision time should be in a couple of weeks give or take one week. After that, macro wave 3 or 3 of 3 of 3 should be the strongest and longest leg for SUI. 3. Bear case: If the black Friday wick low is lost, then things will look really nasty. It may take a while for SUI to recover. I still believe in the technological fundamental that drives the hype. In theory it is the perfect fit for AI driven economy and content. Will it translate into real life use cases, we will have to wait and see. I did add to my bag during the crash and still holding. If price falls below $1.5, then will need to reassess the whole situation.
mukit1
سقوط بیت کوین: آیا بازار صعودی تمام شد؟ سطوح حیاتی پیش رو!

One thing for sure, Uptober has flopped big time! Market recovery is not on the horizon just yet. BTC is more likely to shed some more value in terms of dollars. Major Alts are back above major support, but if those will hold or not, will be found out in the upcoming weeks. The big question is, if the bull market done? If we go by the 4 year halving cycle, then one could make an argument that the bull market is over for the next 18 months. To be completely honest, all major price targets have been hit for this cycle. Not only for BTC, but also for SPX, NDX, Gold, major Alts, etc. So, what is there to complain about? Well, first of all, this crash is totally manmade (AHEM!!!). And second, Crypto industry was just getting its very first legitimate institutional led headwind and it stalled before it could really take off! Frustrating, for sure; unexpected, not really! Now, in terms of how bad it can get, we need to look if support levels can hold. I will have a few stop losses to get me out of this mess if things start to fall apart. First is the 108k level. It almost gave in, but holding on. If that fails, then 89k level. It is very important to hold. If we see daily closes or weekly close below it, then 74k pivot will be tested and most likely fail. If that fails then the 70k-65k cluster and if that is not enough then 50K. Below 50k, I don't think any institution will be comfortable to hold on. So, if that fails, it is really game over! No one knows what will really happen. In past cycles, big draw downs have marked a low, but this time it is a bit different. Previous drops like this have been in the bottom of the cycle and this time it's at the top. So, unless BTC can shrug this off and take advantage of the dollar decline and start to head back up, we need to prepare for the bear market. The bull market is still intact if BTC can bounce off one of the fib levels and start making new highs. If that happens, then we will see the last leg of the extended wave 5 move! We do not want to see price closing below $89k on daily closing basis.
Disclaimer
Any content and materials included in Sahmeto's website and official communication channels are a compilation of personal opinions and analyses and are not binding. They do not constitute any recommendation for buying, selling, entering or exiting the stock market and cryptocurrency market. Also, all news and analyses included in the website and channels are merely republished information from official and unofficial domestic and foreign sources, and it is obvious that users of the said content are responsible for following up and ensuring the authenticity and accuracy of the materials. Therefore, while disclaiming responsibility, it is declared that the responsibility for any decision-making, action, and potential profit and loss in the capital market and cryptocurrency market lies with the trader.