
money_magnet2
@t_money_magnet2

What symbols does the trader recommend buying?
Purchase History
پیام های تریدر
Filter
money_magnet2
XAUUSD 30M CHART PATTRN
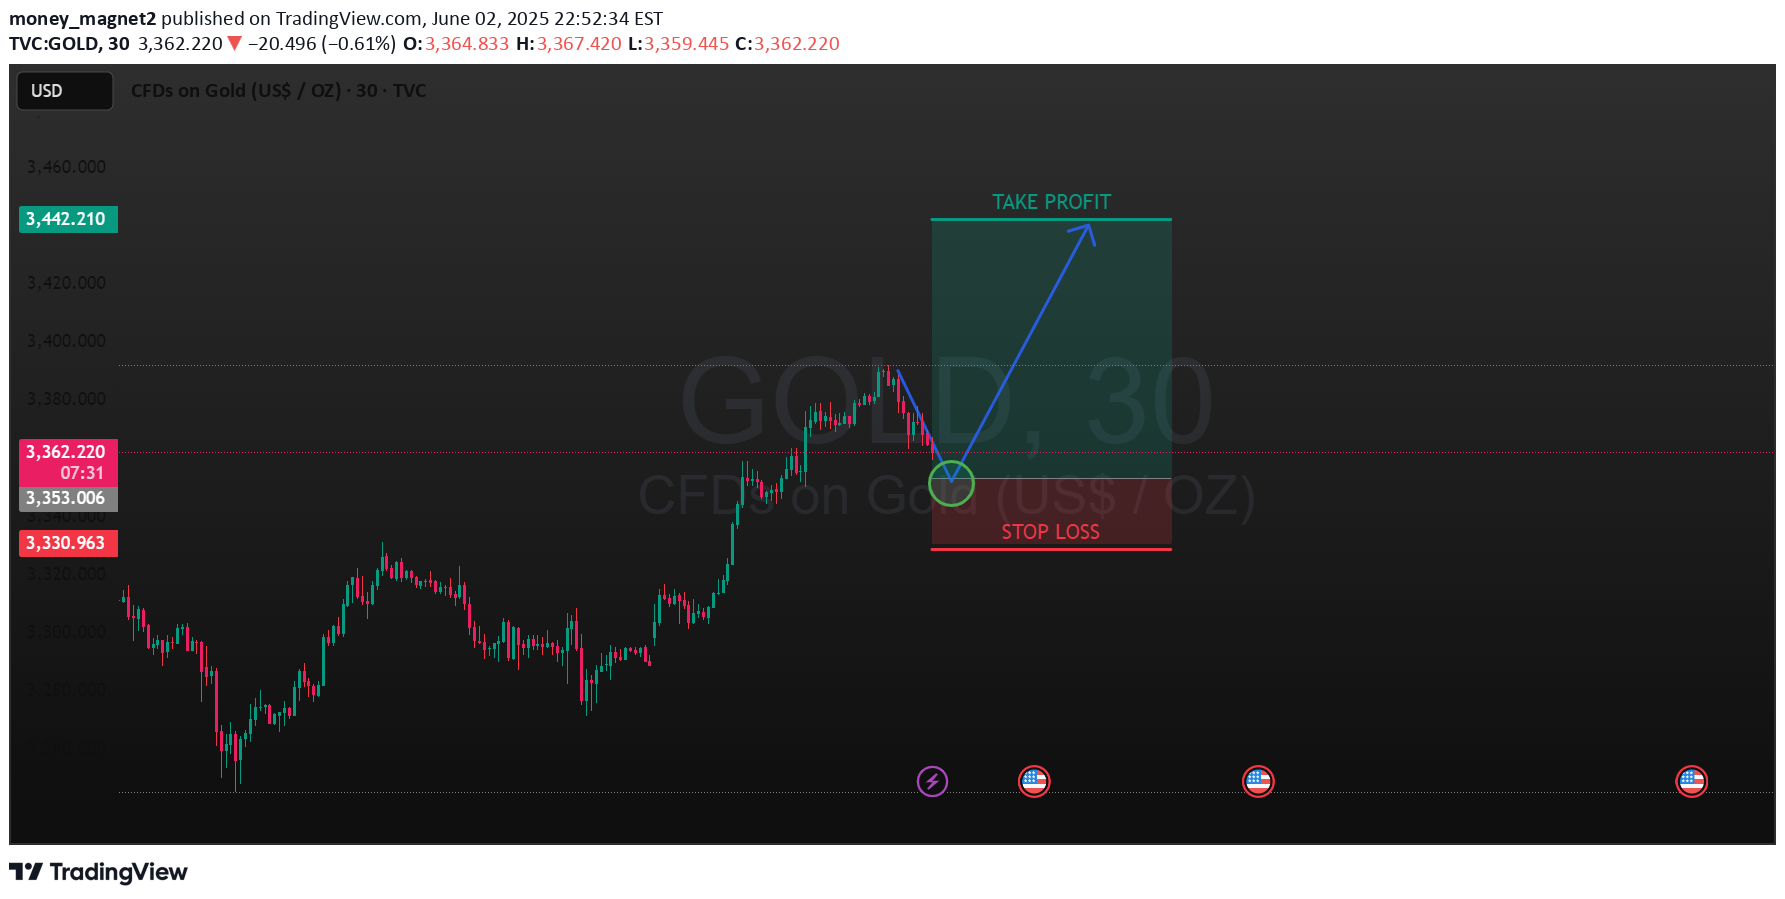
This chart shows a long (buy) trade setup for Gold (CFDs on Gold in USD per ounce) on the 30-minute timeframe. Here's a breakdown of what’s depicted:Chart Analysis:Current Price: ~3361.66Buy Entry Zone: Indicated by the green circle near current price level.Take Profit: Marked at a significantly higher price level.Stop Loss: Set below the current price level.Risk/Reward Ratio: Visually favorable, suggesting a high potential reward relative to the risk.Interpretation:The trader expects the current down-move to reverse, hence the suggested long entry.The chart assumes that price will bounce off this level (possibly support), then move up to the take-profit target.This setup appears to be based on trend continuation or support bounce logic.Key Considerations:Look for confirmation such as candlestick reversal patterns, volume increase, or RSI divergence before entering the trade.Be mindful of news/events that might affect gold prices—those red icons below the chart could indicate upcoming economic events.Would you like help analyzing whether this trade setup is strong based on technical indicators or news?ACTIVE TRADE
money_magnet2
BTCUSD 30M CHART PATTERN
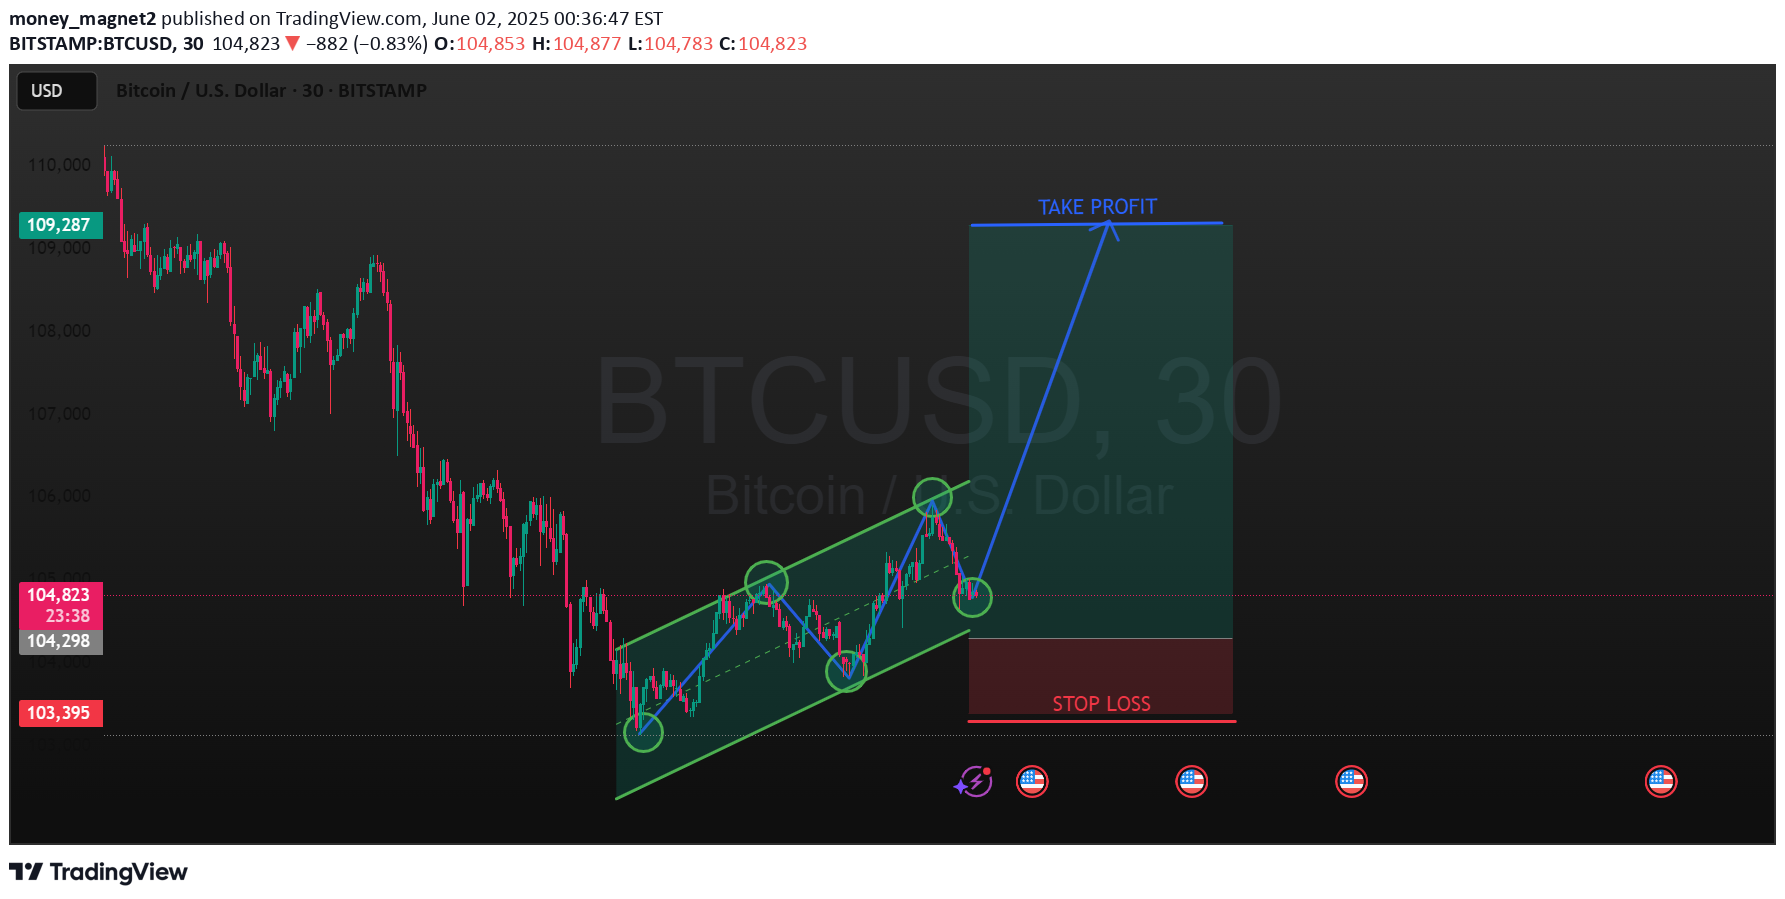
The chart you’ve shared is a BTC/USD (Bitcoin to US Dollar) 30-minute timeframe from TradingView. Here's a breakdown of the technical analysis depicted:Key Observations:1. Ascending Channel (Green Parallel Lines):The price appears to be following an upward sloping channel, suggesting a bullish trend in the short term.Multiple points (circled) show price bouncing off support and resistance within the channel.2. Buy Setup:The price is currently near the lower trendline (support) of the channel.A potential long (buy) position is suggested here based on the expected bounce off the support.3. Trade Plan:Entry: Around current price level (~104,877).Stop Loss: Below the channel and marked clearly in red (~103,395), indicating risk protection if the setup fails.Take Profit: Near the upper price target indicated by the large green box and arrow (just above 109,000), suggesting a reward area.4. Risk-Reward:This appears to be a favorable risk-to-reward setup (approximately 1:4 or better), which is attractive for traders.---Summary:This chart indicates a bullish price pattern within a rising channel, suggesting a buy opportunity near the support level, with a well-defined stop loss and take profit target. As always, real-time confirmation and broader market context are crucial before taking action.Would you like help backtesting this setup or generating a script for TradingView (Pine Script)?ACTIVE TRADE
money_magnet2
XAUUSD 30M CHART PATTERN
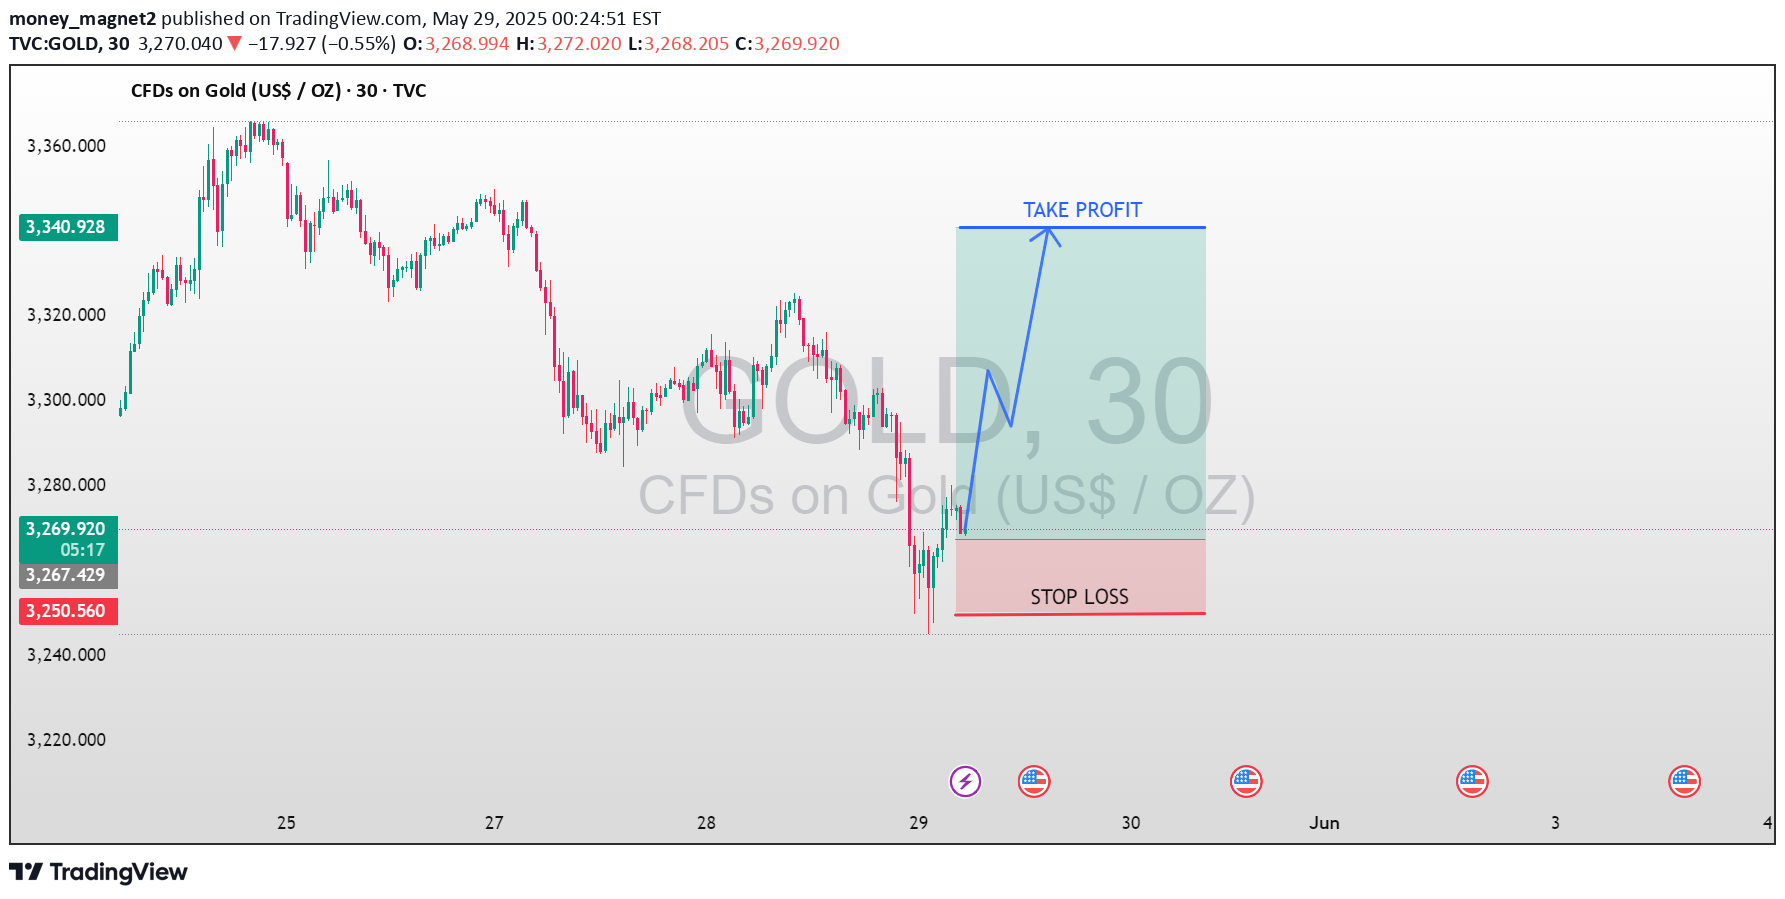
This chart is a 30-minute timeframe for CFDs on Gold (US$/OZ), showing a potential long (buy) trade setup with clearly defined risk and reward parameters:Key Elements:Entry Zone: Around the current price level (approx. 3,271.44).Take Profit (TP): Targeted near 3,340.93, suggesting a bullish move toward previous highs.Stop Loss (SL): Set just below 3,250.56, indicating a cutoff in case the price declines.Observations:Bullish Setup: The price has bounced from a recent low and shows a possible reversal pattern. This is further supported by the expected upward trajectory.Risk/Reward Ratio: Visually, the TP zone is significantly larger than the SL zone, indicating a favorable risk/reward setup.Market Context: The chart shows recent volatility with sharp moves, so risk management is critical.Would you like help calculating the exact risk/reward ratio or analyzing whether this is a high-probability setup based on technical indicators or patterns?ACTIVE TRADE
money_magnet2
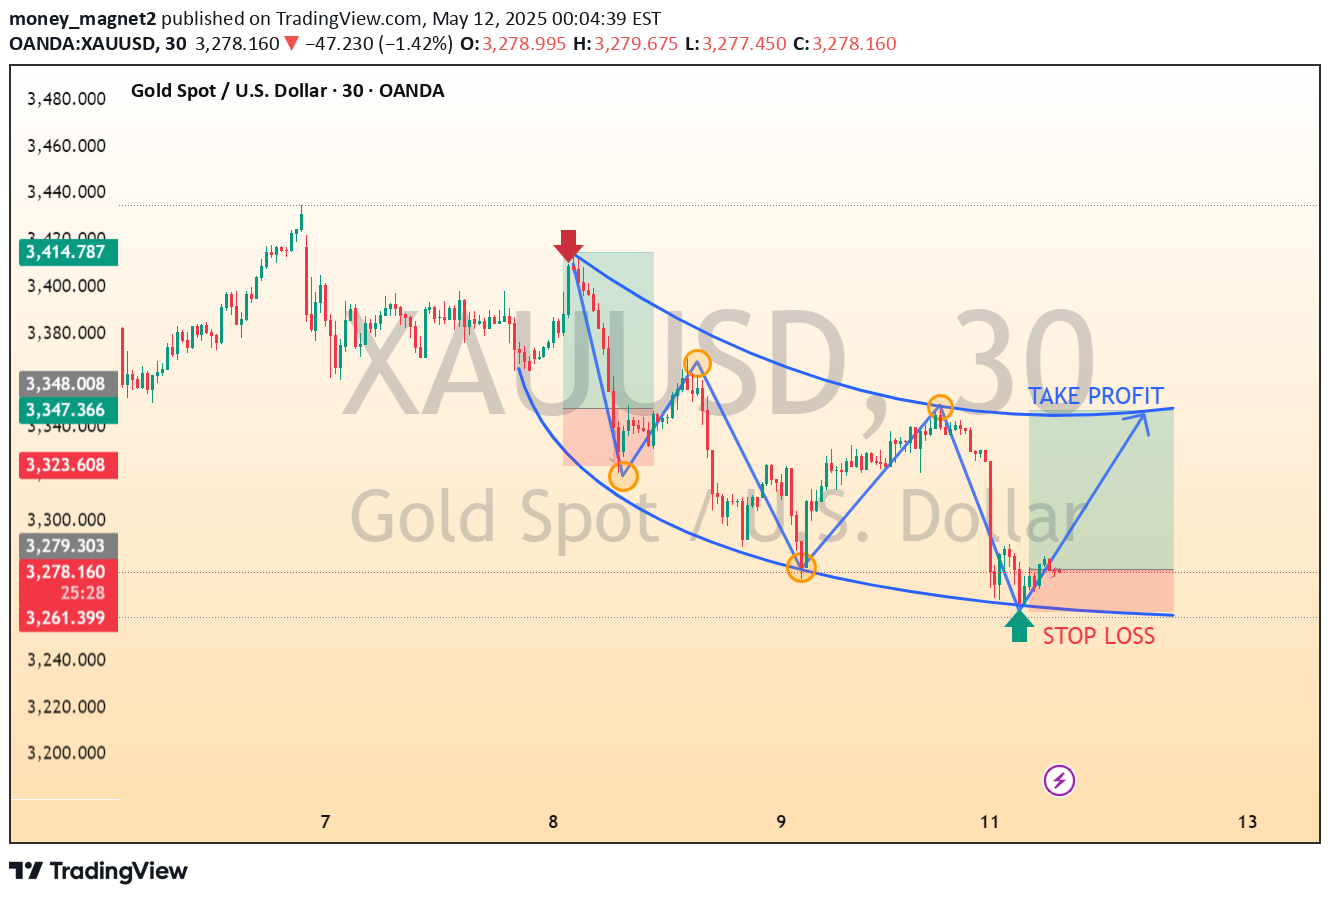
XAUUSD 30M CHART PATTERN
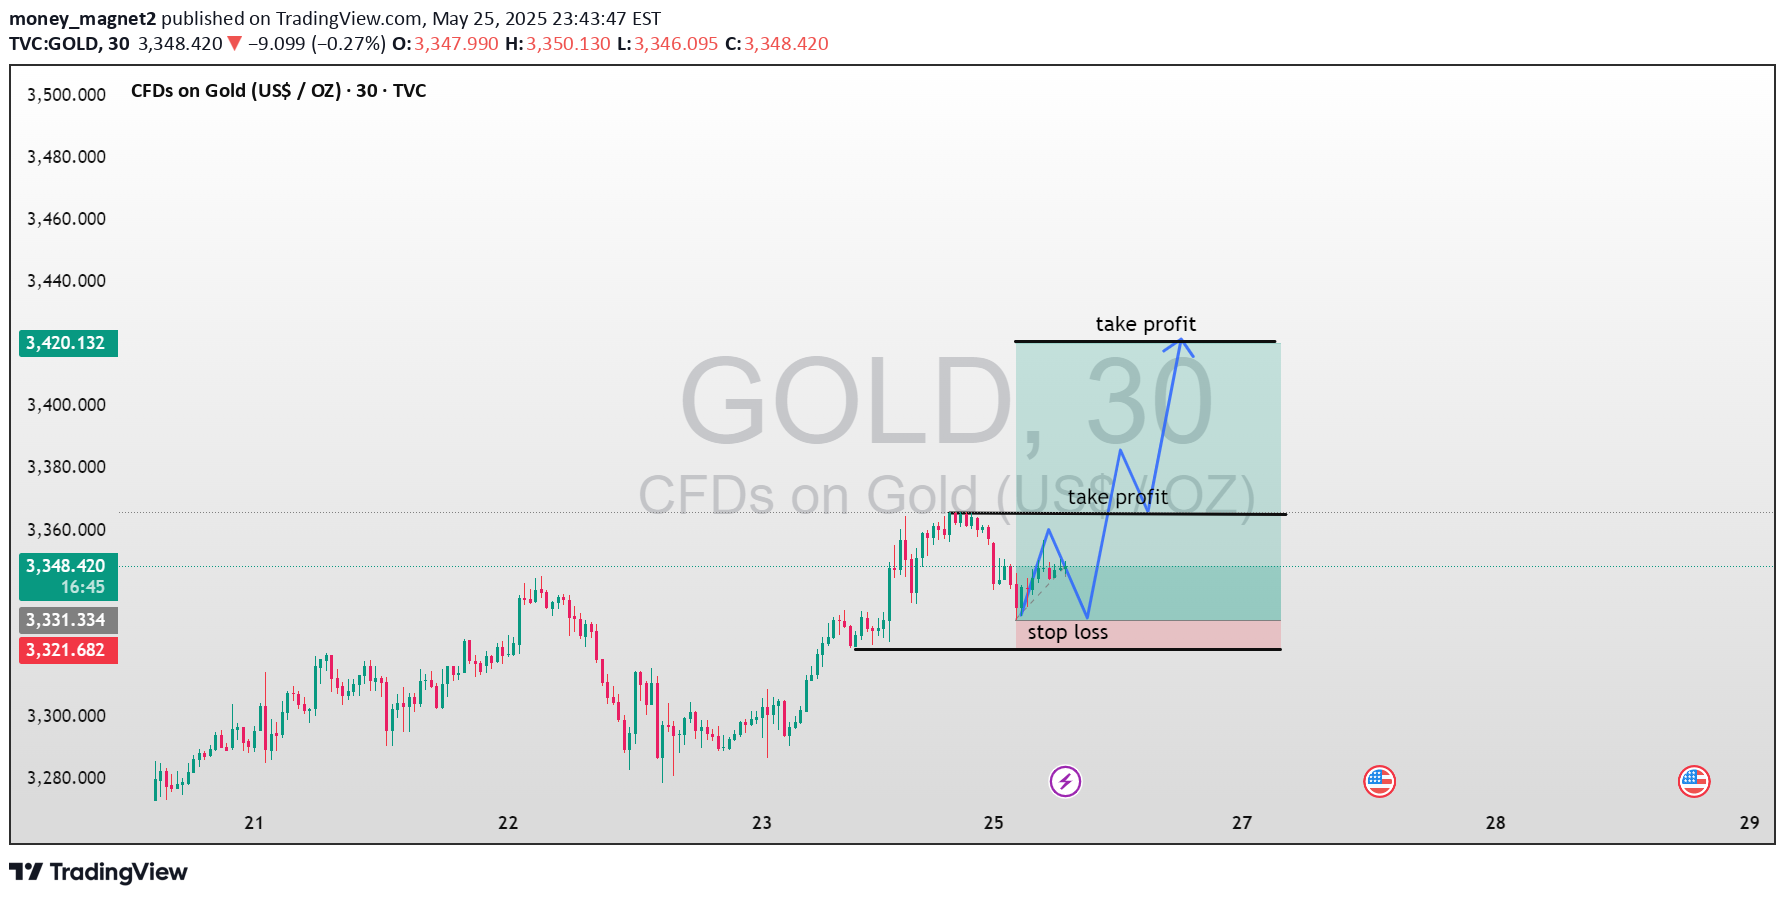
This chart is a 30-minute timeframe for CFDs on Gold (US$/OZ). It shows a bullish trade setup with:Stop Loss below recent support (around 3,321).First Take Profit level around 3,420.Final Take Profit level near 3,500.The expected price movement is marked by a blue zigzag arrow, indicating a bullish reversal after a minor drop.This setup appears to be a long position strategy based on a potential support bounce and trend continuation. Let me know if you'd like a detailed analysis of the risk-reward ratio or other setups.ACTIVE TRADE
money_magnet2
XAUUSD 30M CHARTPATTERN
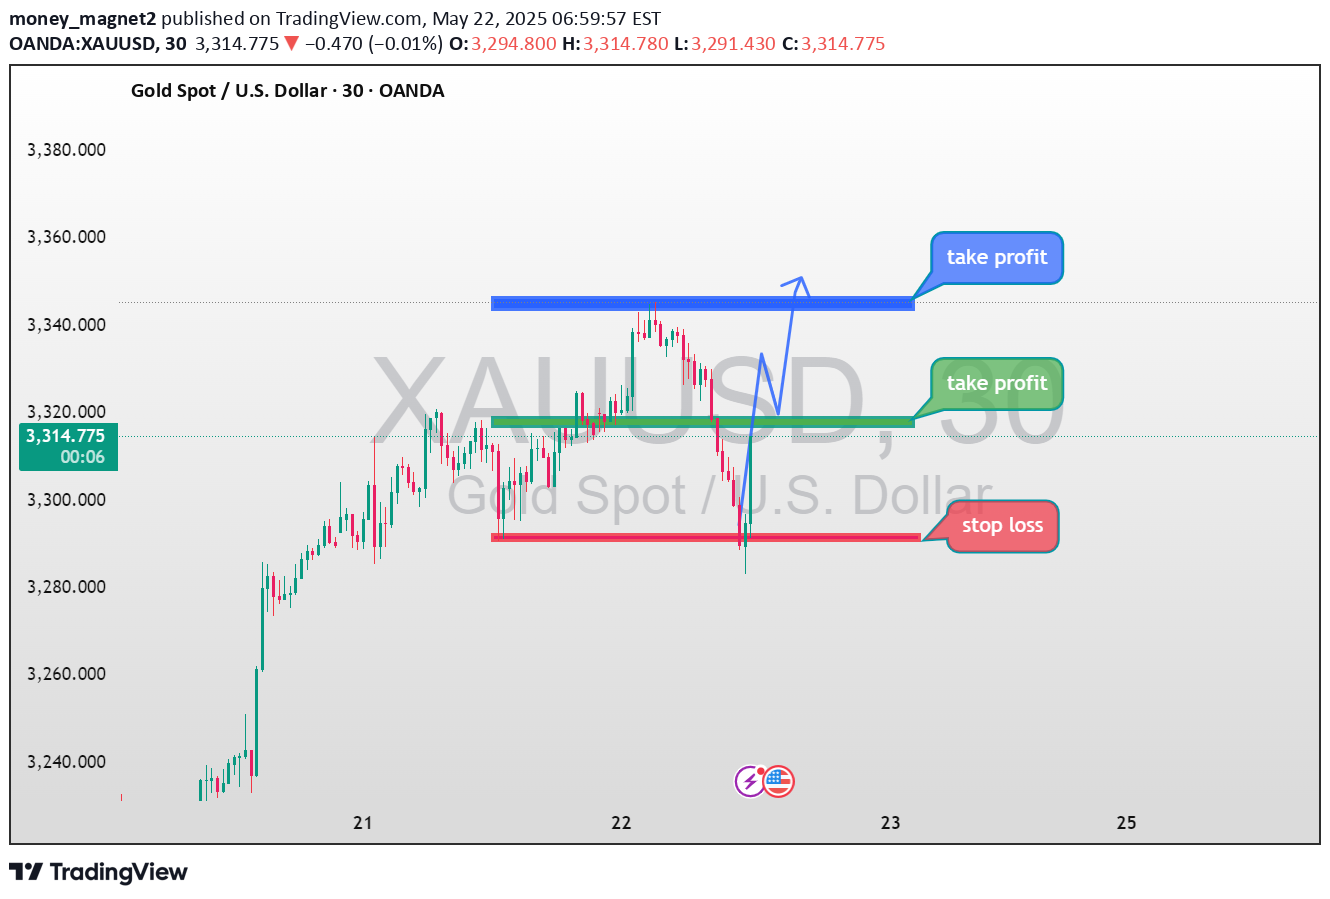
The chart you've provided is a technical analysis setup for XAUUSD (Gold vs. USD) on the 30-minute timeframe. Here's a breakdown of what's shown:Current Price: Around 3,303.950Buy Zone: Appears to be at or near the current price, with a bounce off the red support zone suggesting a potential entry.Stop Loss: Placed just below the red support level (~3,290), to minimize risk if price continues downward.Take Profit Targets:First TP (green zone): Around the 3,320–3,325 range, indicating a conservative profit level.Second TP (blue zone): Around 3,340–3,345, a more aggressive target if price breaks resistance.The blue projected line indicates a bullish scenario where price first retraces, breaks resistance (green zone), and then pushes higher toward the upper TP.This setup suggests a long (buy) position with a clear risk management plan and staged profit-taking. Let me know if you want help analyzing the strategy, optimizing the risk-reward ratio, or automating this logic.ACTIVE TRADE
money_magnet2
XAUUSD 30M CHART PATTERN
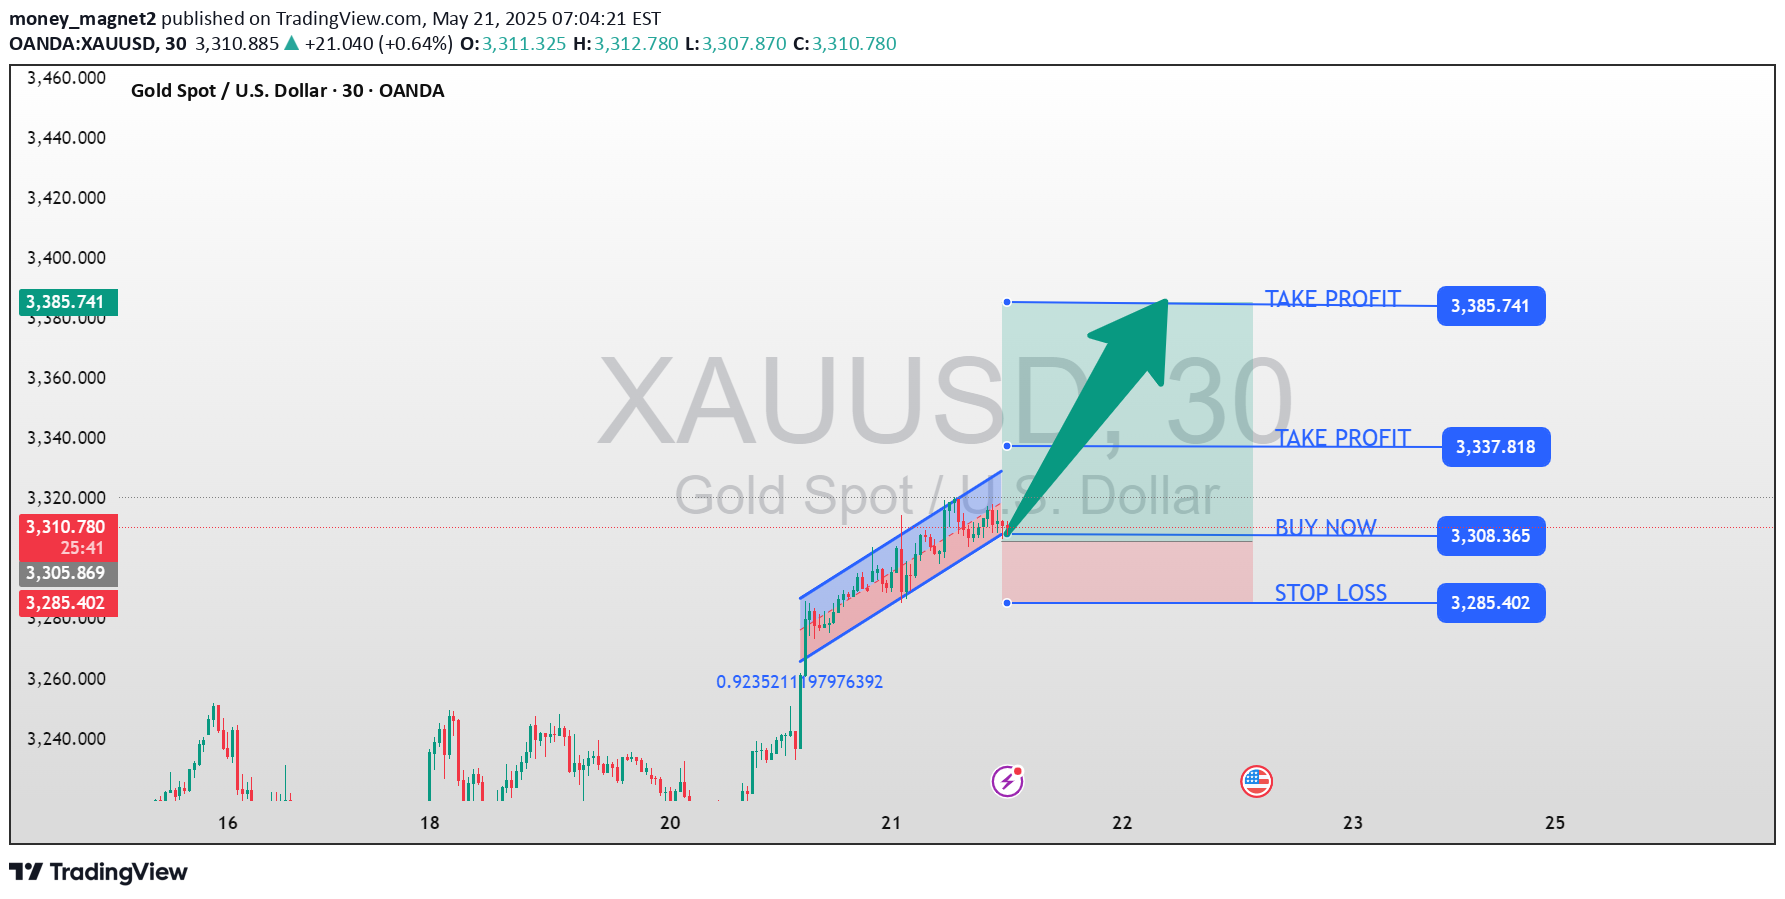
This chart shows a trading plan for Gold Spot vs. U.S. Dollar (XAU/USD) on the 30-minute timeframe, published on May 21, 2025. Here's a breakdown of the trade setup:BUY NOW Level: 3,308.365This is the suggested entry point for a long (buy) trade.STOP LOSS: 3,285.402If the price falls to this level, the trade should be exited to limit losses.TAKE PROFIT 1: 3,337.818This is the first target level to take partial or full profit.TAKE PROFIT 2: 3,385.741This is the more optimistic target, where the rest of the position might be closed for maximum gain.Trend Direction: Upward (indicated by the green arrow and ascending channel).The price has recently broken out of an ascending channel, suggesting bullish momentum.This strategy implies a favorable risk-reward ratio with a bullish bias. If you'd like, I can help calculate the exact risk-reward ratio or provide more analysis.ACTIVE TRADE
money_magnet2
XAUUSD 30M CHART PATTERN
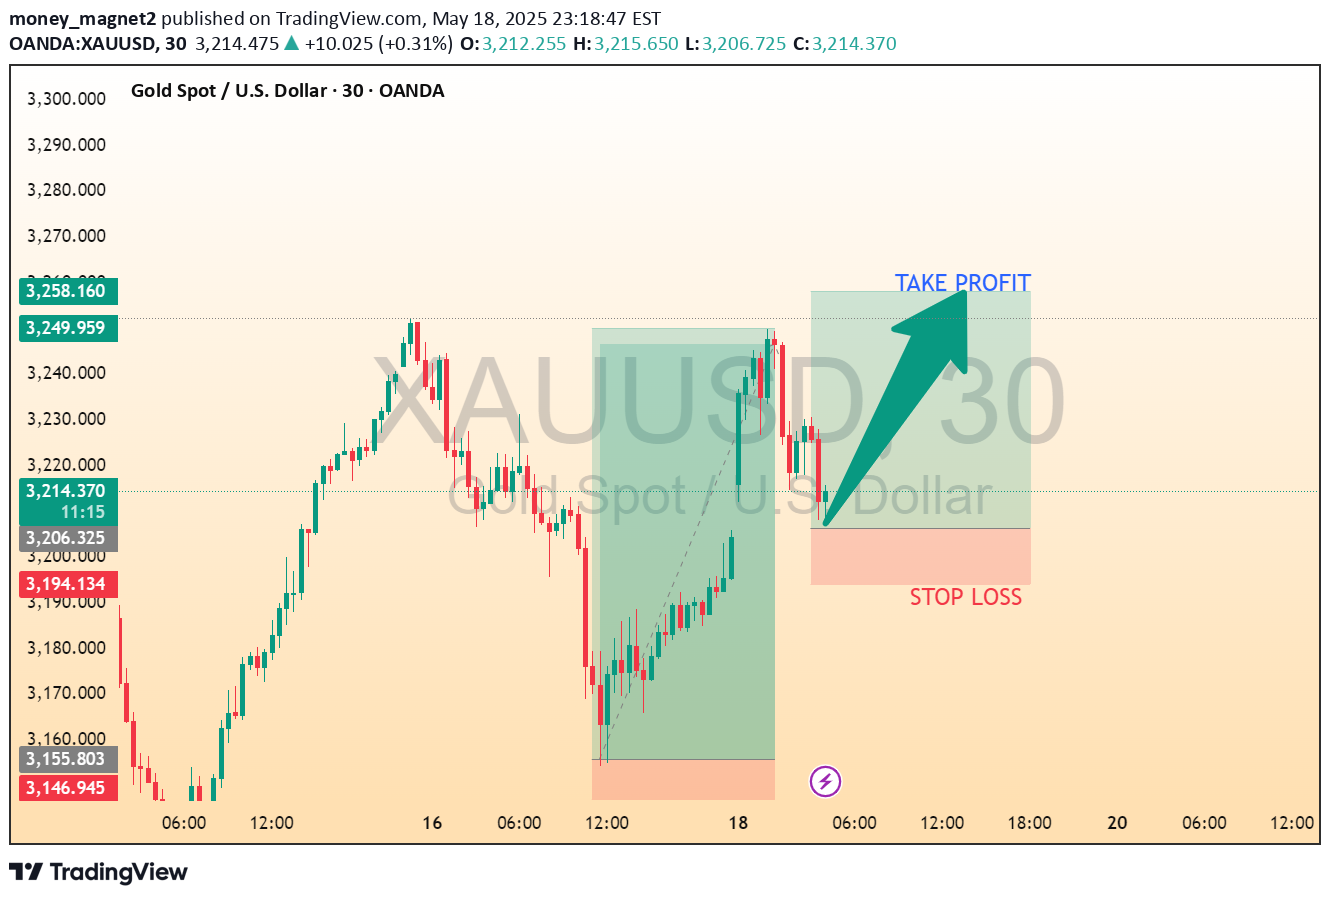
This is a 30-minute candlestick chart for XAU/USD (Gold vs US Dollar) from TradingView. Here's a quick breakdown of what the image shows:1. Current Price Area: Around 3,211.150 USD.2. Trade Setup:Entry Point: Near the bottom of the recent dip, around the current price level.Take Profit Zone: Marked above the entry point, suggesting a bullish move is expected.Stop Loss Zone: Below the entry point, managing risk in case the market moves down.3. Trade Direction: Long (Buy), as indicated by the upward green arrow.This setup seems to follow a bullish reversal or retracement continuation after a corrective move. It's a common price action strategy, likely using support/resistance or candlestick pattern confirmation.Would you like a technical analysis of
money_magnet2
BTCUSD 30M CHART PATTERN
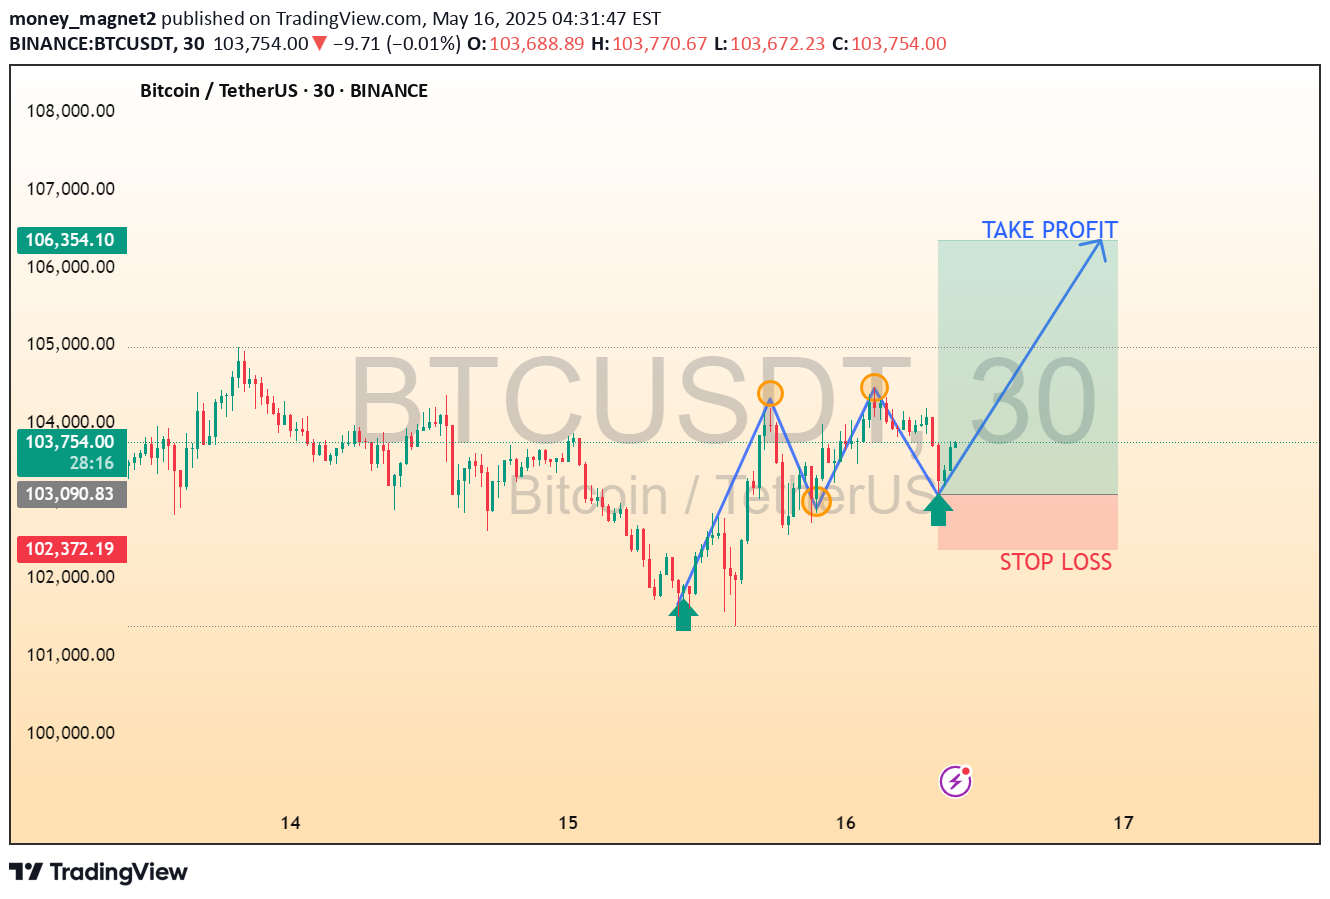
This chart shows a bullish trading setup for BTC/USDT on the 30-minute timeframe, suggesting a potential upward breakout after a pattern that resembles an inverse head and shoulders formation.Key Elements:Green Arrows: Indicate potential buy entry points.Orange Circles: Highlight the formation of two shoulders and a head (classic signs of a reversal pattern).Blue Arrow and Zone:Take Profit: Around the $106,354 level.Stop Loss: Slightly below $102,372.Current Price: ~$103,740Interpretation:The chart suggests a long trade setup:Entry Zone: Near $103,000–$103,740Target: ~$106,354Stop Loss: Below $102,372This strategy relies on a breakout confirmation after the inverse head-and-shoulders pattern. Always manage risk appropriately and confirm signals with volume or other indicators before entering. Let me know if you want a breakdown of the risk-reward ratio or additional technical indicators.ACTIVE TRADE
money_magnet2
XAUUSD 30M CHART PATTERN
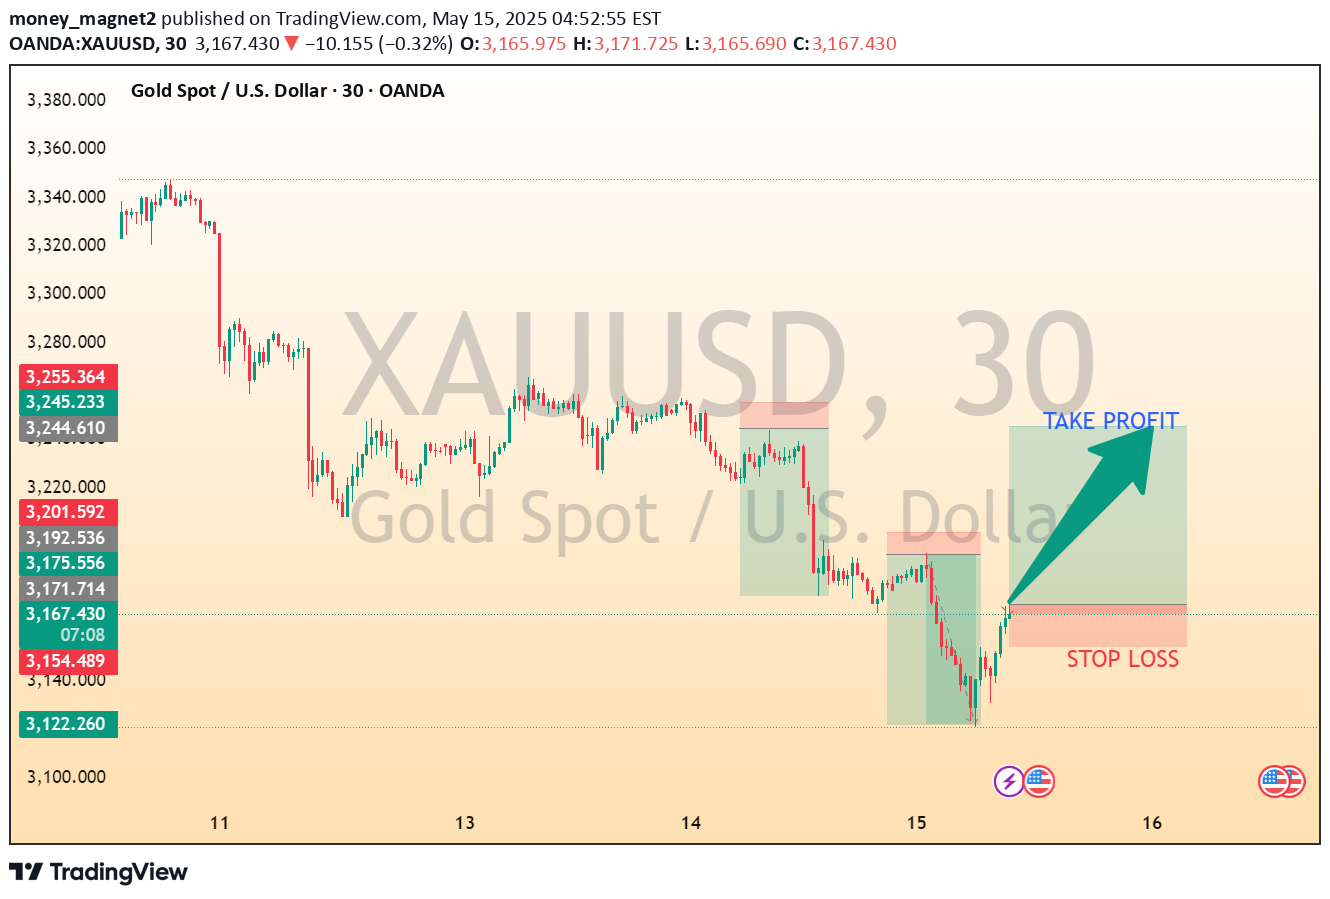
This chart shows a trading setup for the Gold Spot price against the US Dollar (XAU/USD) on a 30-minute timeframe. Here's a breakdown of what it indicates:Buy Signal: The chart suggests a potential long (buy) entry point where the price recently started to reverse upwards.Stop Loss: Placed below the recent swing low to minimize losses if the market moves against the trade.Take Profit: Placed above the current level, indicating the expected target if the price continues upward.Risk/Reward Ratio: The green zone (potential profit) is significantly larger than the red zone (potential loss), indicating a favorable risk/reward setup.This setup likely anticipates a bullish reversal after a downward trend. However, always confirm with additional indicators or analysis before entering a trade. Would you like help analyzing the trend further or calculating risk/reward values?ACTIVE TRADE
money_magnet2
XAUUSD 30M CHART PATTERN
This chart displays a technical analysis pattern on the XAU/USD (Gold/US Dollar) 30-minute timeframe. Here's a breakdown:Pattern Identified: This appears to be an inverse head and shoulders or a rounded bottom pattern, signaling a potential trend reversal from bearish to bullish.Entry Point: Marked by the green arrow, indicating a potential buying opportunity.Stop Loss: Placed slightly below the lowest point in the pattern to limit risk.Take Profit: Set near the upper boundary of the pattern’s resistance zone.Strategy Insight:This setup suggests a bullish bias, expecting the price to rise after forming a rounded bottom and breaking the neckline (resistance). The trader aims to profit from this breakout.Would you like help calculating the exact risk-to-reward ratio or backtesting this setup?ACTIVE TRADE
Disclaimer
Any content and materials included in Sahmeto's website and official communication channels are a compilation of personal opinions and analyses and are not binding. They do not constitute any recommendation for buying, selling, entering or exiting the stock market and cryptocurrency market. Also, all news and analyses included in the website and channels are merely republished information from official and unofficial domestic and foreign sources, and it is obvious that users of the said content are responsible for following up and ensuring the authenticity and accuracy of the materials. Therefore, while disclaiming responsibility, it is declared that the responsibility for any decision-making, action, and potential profit and loss in the capital market and cryptocurrency market lies with the trader.