Technical analysis by money_magnet2 about Symbol PAXG: Buy recommendation (5/19/2025)

money_magnet2
XAUUSD 30M CHART PATTERN
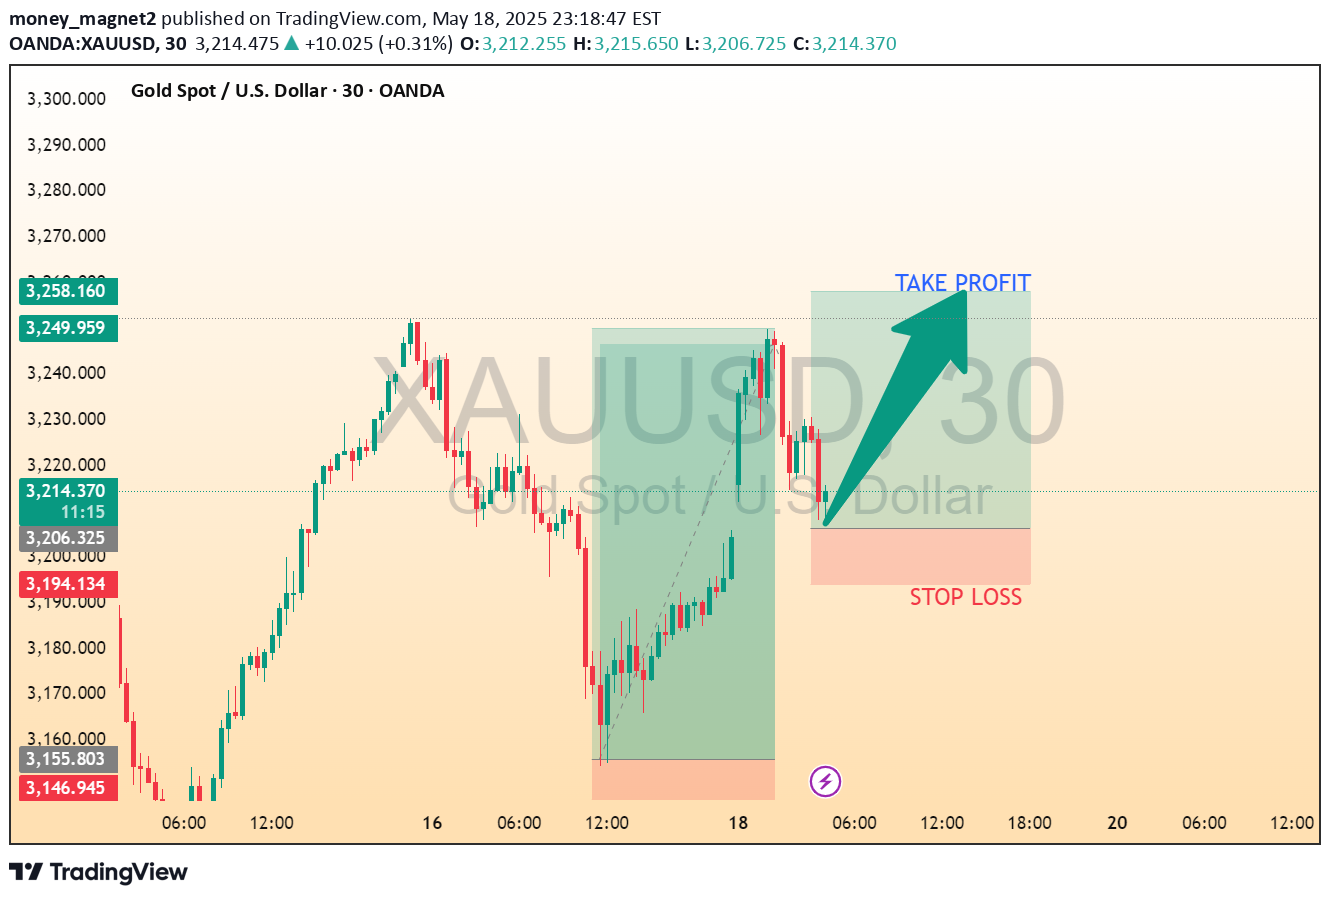
This is a 30-minute candlestick chart for XAU/USD (Gold vs US Dollar) from TradingView. Here's a quick breakdown of what the image shows:1. Current Price Area: Around 3,211.150 USD.2. Trade Setup:Entry Point: Near the bottom of the recent dip, around the current price level.Take Profit Zone: Marked above the entry point, suggesting a bullish move is expected.Stop Loss Zone: Below the entry point, managing risk in case the market moves down.3. Trade Direction: Long (Buy), as indicated by the upward green arrow.This setup seems to follow a bullish reversal or retracement continuation after a corrective move. It's a common price action strategy, likely using support/resistance or candlestick pattern confirmation.Would you like a technical analysis of