Technical analysis by money_magnet2 about Symbol PAXG: Buy recommendation (5/22/2025)

money_magnet2
XAUUSD 30M CHARTPATTERN
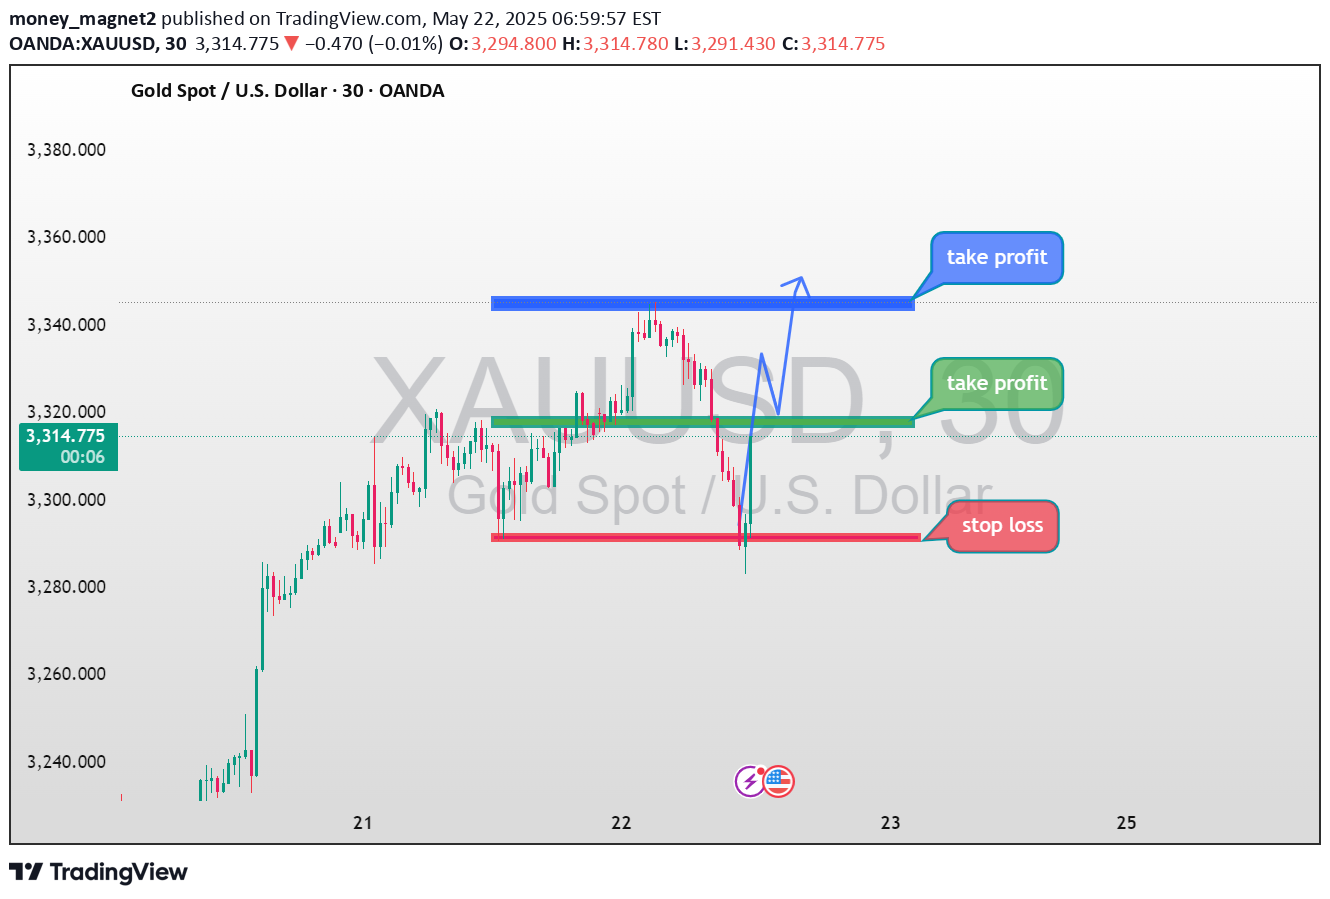
The chart you've provided is a technical analysis setup for XAUUSD (Gold vs. USD) on the 30-minute timeframe. Here's a breakdown of what's shown:Current Price: Around 3,303.950Buy Zone: Appears to be at or near the current price, with a bounce off the red support zone suggesting a potential entry.Stop Loss: Placed just below the red support level (~3,290), to minimize risk if price continues downward.Take Profit Targets:First TP (green zone): Around the 3,320–3,325 range, indicating a conservative profit level.Second TP (blue zone): Around 3,340–3,345, a more aggressive target if price breaks resistance.The blue projected line indicates a bullish scenario where price first retraces, breaks resistance (green zone), and then pushes higher toward the upper TP.This setup suggests a long (buy) position with a clear risk management plan and staged profit-taking. Let me know if you want help analyzing the strategy, optimizing the risk-reward ratio, or automating this logic.ACTIVE TRADE