Technical analysis by money_magnet2 about Symbol BTC: Buy recommendation (5/16/2025)

money_magnet2
BTCUSD 30M CHART PATTERN
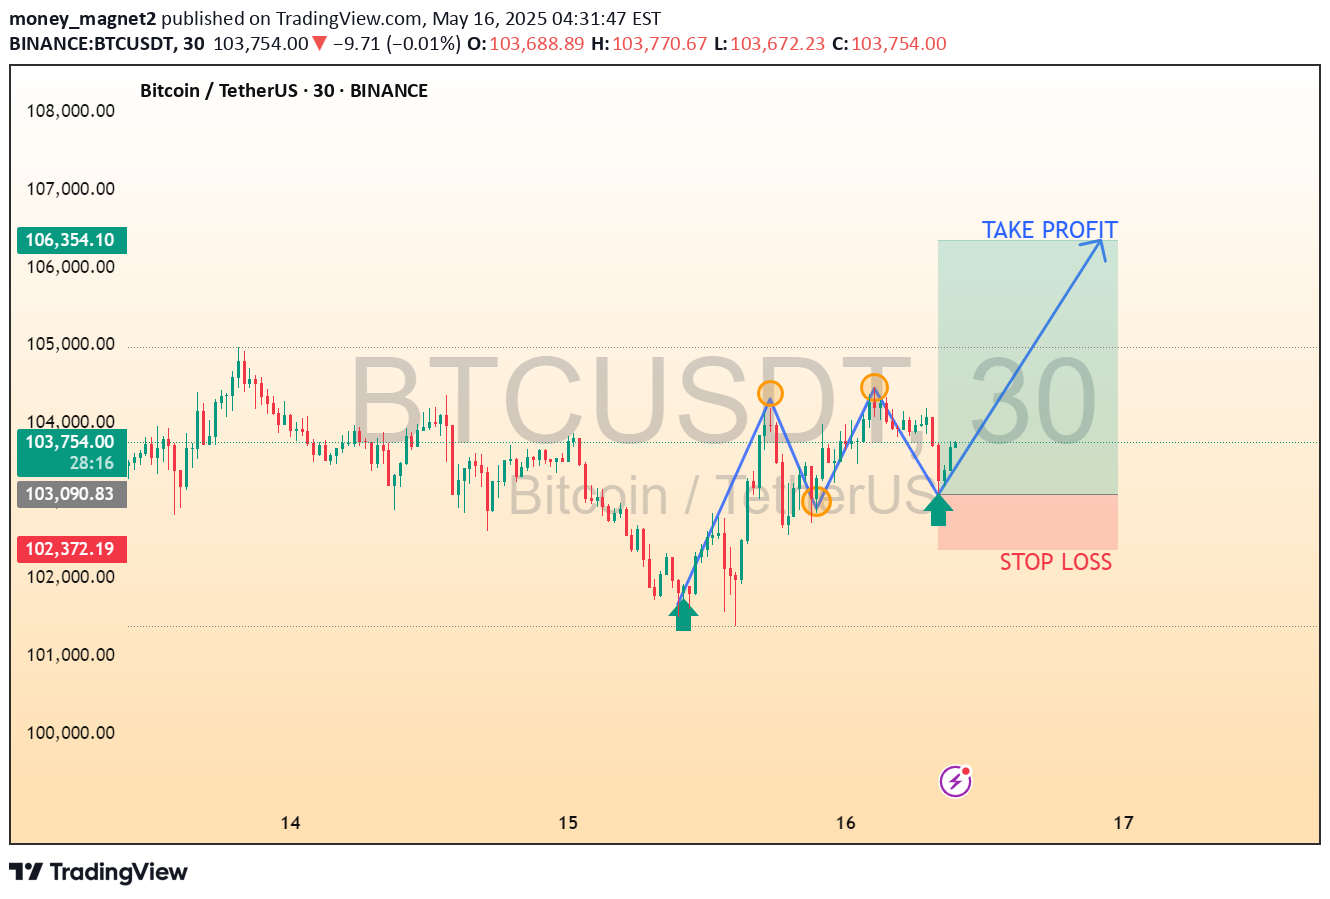
This chart shows a bullish trading setup for BTC/USDT on the 30-minute timeframe, suggesting a potential upward breakout after a pattern that resembles an inverse head and shoulders formation.Key Elements:Green Arrows: Indicate potential buy entry points.Orange Circles: Highlight the formation of two shoulders and a head (classic signs of a reversal pattern).Blue Arrow and Zone:Take Profit: Around the $106,354 level.Stop Loss: Slightly below $102,372.Current Price: ~$103,740Interpretation:The chart suggests a long trade setup:Entry Zone: Near $103,000–$103,740Target: ~$106,354Stop Loss: Below $102,372This strategy relies on a breakout confirmation after the inverse head-and-shoulders pattern. Always manage risk appropriately and confirm signals with volume or other indicators before entering. Let me know if you want a breakdown of the risk-reward ratio or additional technical indicators.ACTIVE TRADE