Technical analysis by money_magnet2 about Symbol BTC: Buy recommendation (6/2/2025)

money_magnet2
BTCUSD 30M CHART PATTERN
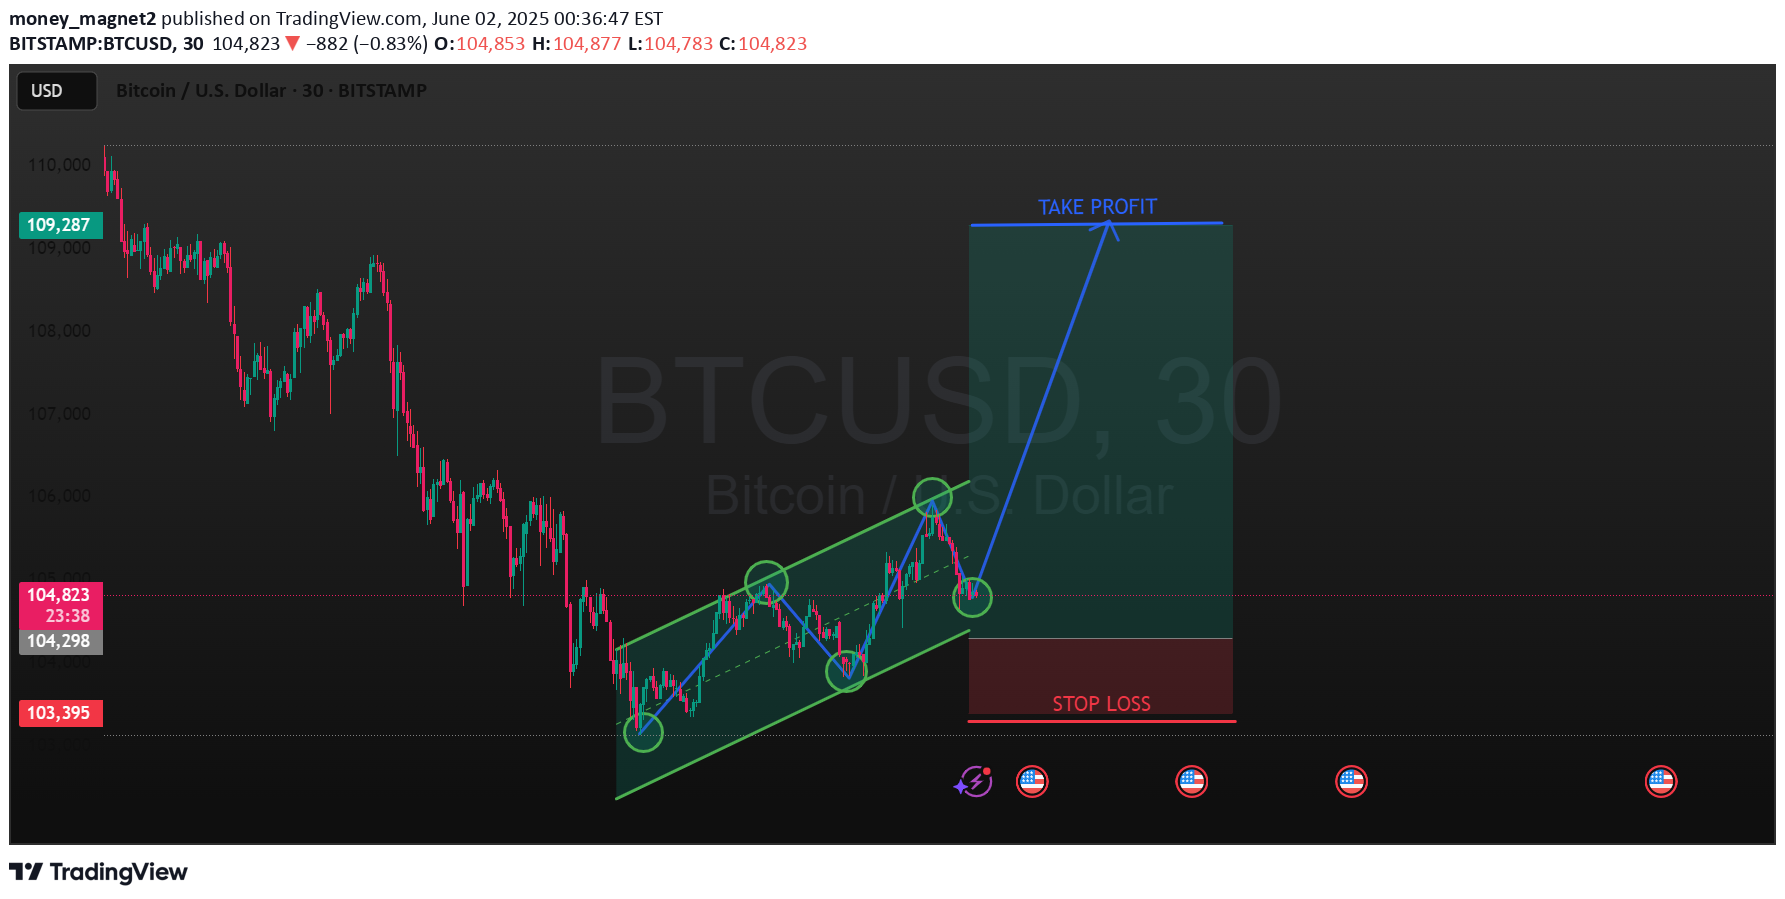
The chart you’ve shared is a BTC/USD (Bitcoin to US Dollar) 30-minute timeframe from TradingView. Here's a breakdown of the technical analysis depicted:Key Observations:1. Ascending Channel (Green Parallel Lines):The price appears to be following an upward sloping channel, suggesting a bullish trend in the short term.Multiple points (circled) show price bouncing off support and resistance within the channel.2. Buy Setup:The price is currently near the lower trendline (support) of the channel.A potential long (buy) position is suggested here based on the expected bounce off the support.3. Trade Plan:Entry: Around current price level (~104,877).Stop Loss: Below the channel and marked clearly in red (~103,395), indicating risk protection if the setup fails.Take Profit: Near the upper price target indicated by the large green box and arrow (just above 109,000), suggesting a reward area.4. Risk-Reward:This appears to be a favorable risk-to-reward setup (approximately 1:4 or better), which is attractive for traders.---Summary:This chart indicates a bullish price pattern within a rising channel, suggesting a buy opportunity near the support level, with a well-defined stop loss and take profit target. As always, real-time confirmation and broader market context are crucial before taking action.Would you like help backtesting this setup or generating a script for TradingView (Pine Script)?ACTIVE TRADE