
cryptodailyuk
@t_cryptodailyuk

What symbols does the trader recommend buying?
Purchase History
پیام های تریدر
Filter
cryptodailyuk
ETH/USDT 1D CHart Long-Term
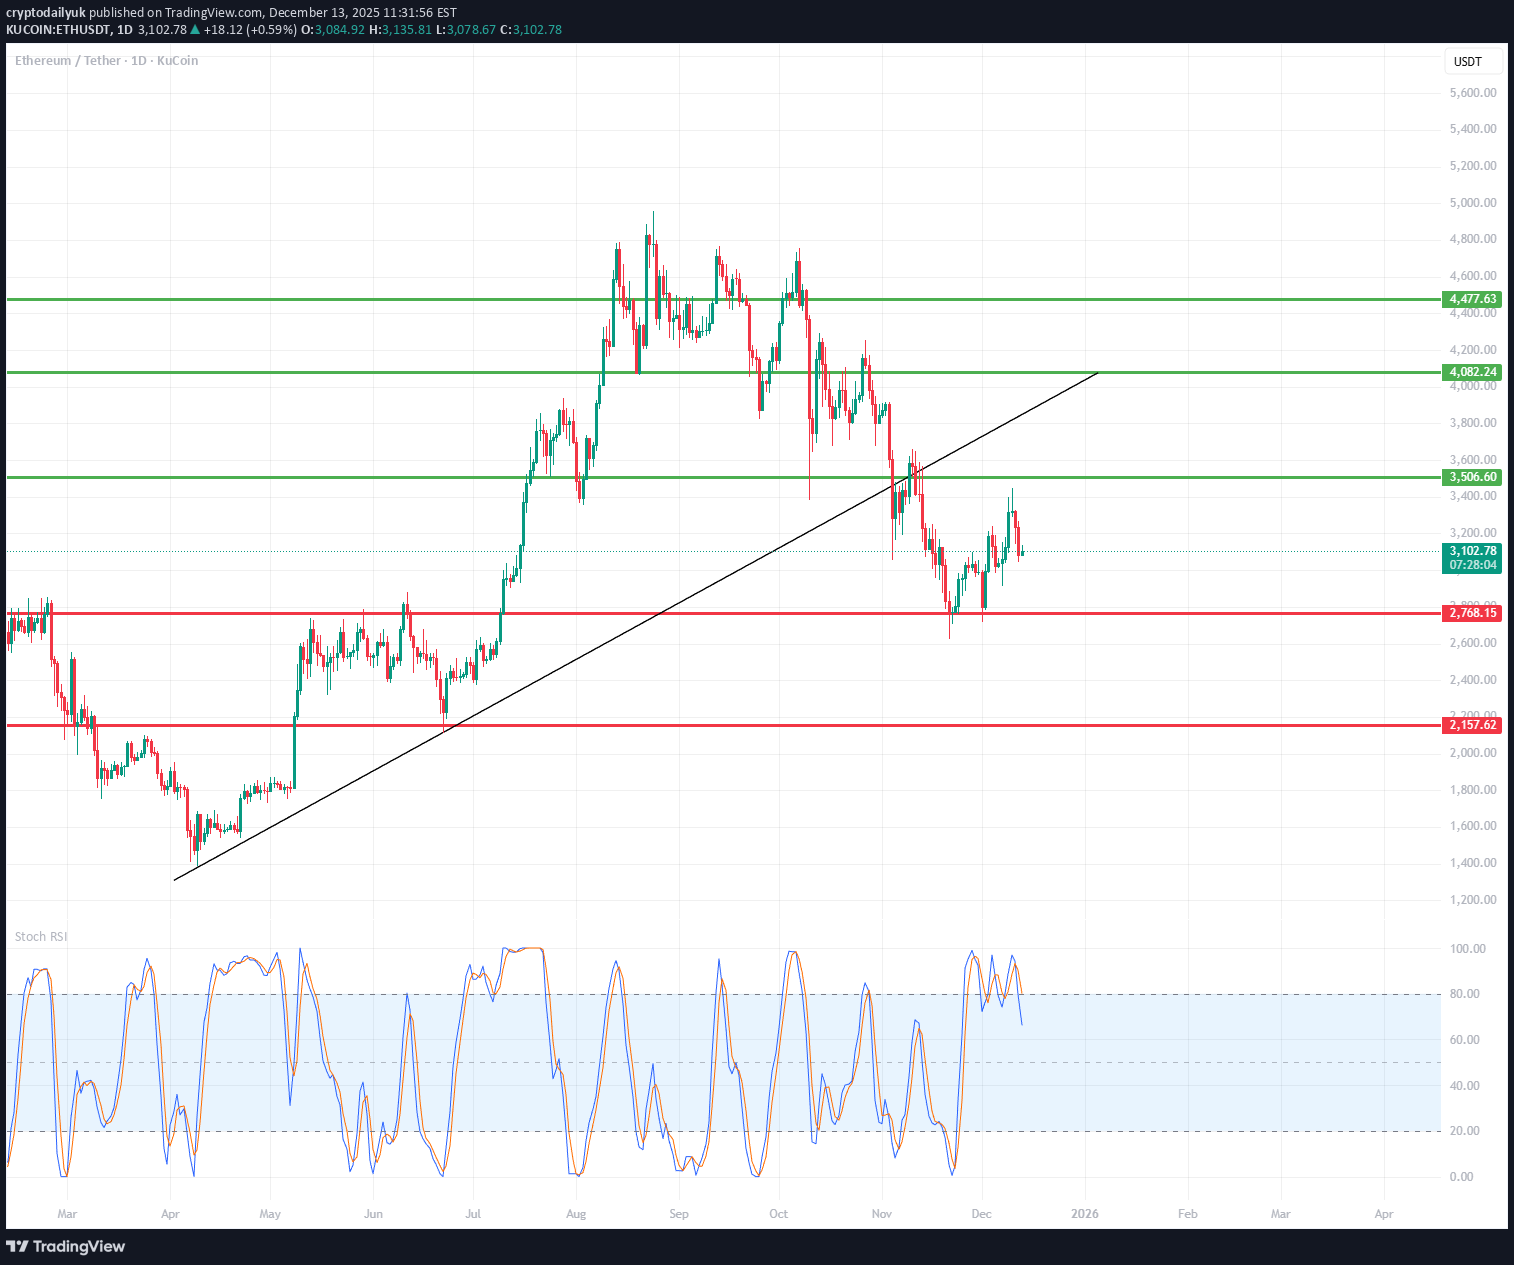
. 🔍 Market Structure (Price Action) 1️⃣ Trend Long-term: The uptrend has been broken (a downward breakout from the black trend line). Medium-term: A sequence of lower highs and lower lows → a downtrend. The current rebound is a correction in the downtrend, not a confirmed reversal. 📐 Key Levels (very well marked) 🔴 Support 2768 USDT – key support (current local bottom). 2157 USDT – final support from the previous structure (if 2768 breaks → a very real pullback). 🟢 Resistance 3506 USDT – current nearest resistance (retest after a downward breakout). 4101 USDT – strong supply zone + former support. 4477 USDT – main structural resistance (region of previous highs). 👉 Price is now exactly in the decision zone between 2768 and 3506. 📉 Trendline Breaked and rejected (retest ended with a decline). This is a classic signal of a downtrend continuation. Until the price returns above 3506 and sustains, there is no uptrend. 📊 Stochastic RSI The oscillator frequently reaches the 80–100 zone. Currently: Moving out of overbought → signal of weakening upward momentum. No bullish divergence → no confirmation of a trend change. 🧠 Scenarios 🐻 Baseline scenario (more likely) Rejection of 3506 Return to around 3000 → 2768 Breakthrough of 2768 = open path to ~2150 🐂 Alternative (conditional) scenario Daily close above 3506 Retest of 3506 as support Only then is a move towards 4100 possible 🎯 Final conclusions This is not a market for longs without confirmation. The current rebound looks like a pullback in a downtrend. Safeest: Short at resistance (3506 / 4101) Long only after a breakout and holding of 3506
cryptodailyuk
TECHNICAL ANALYSIS BNB/USDT
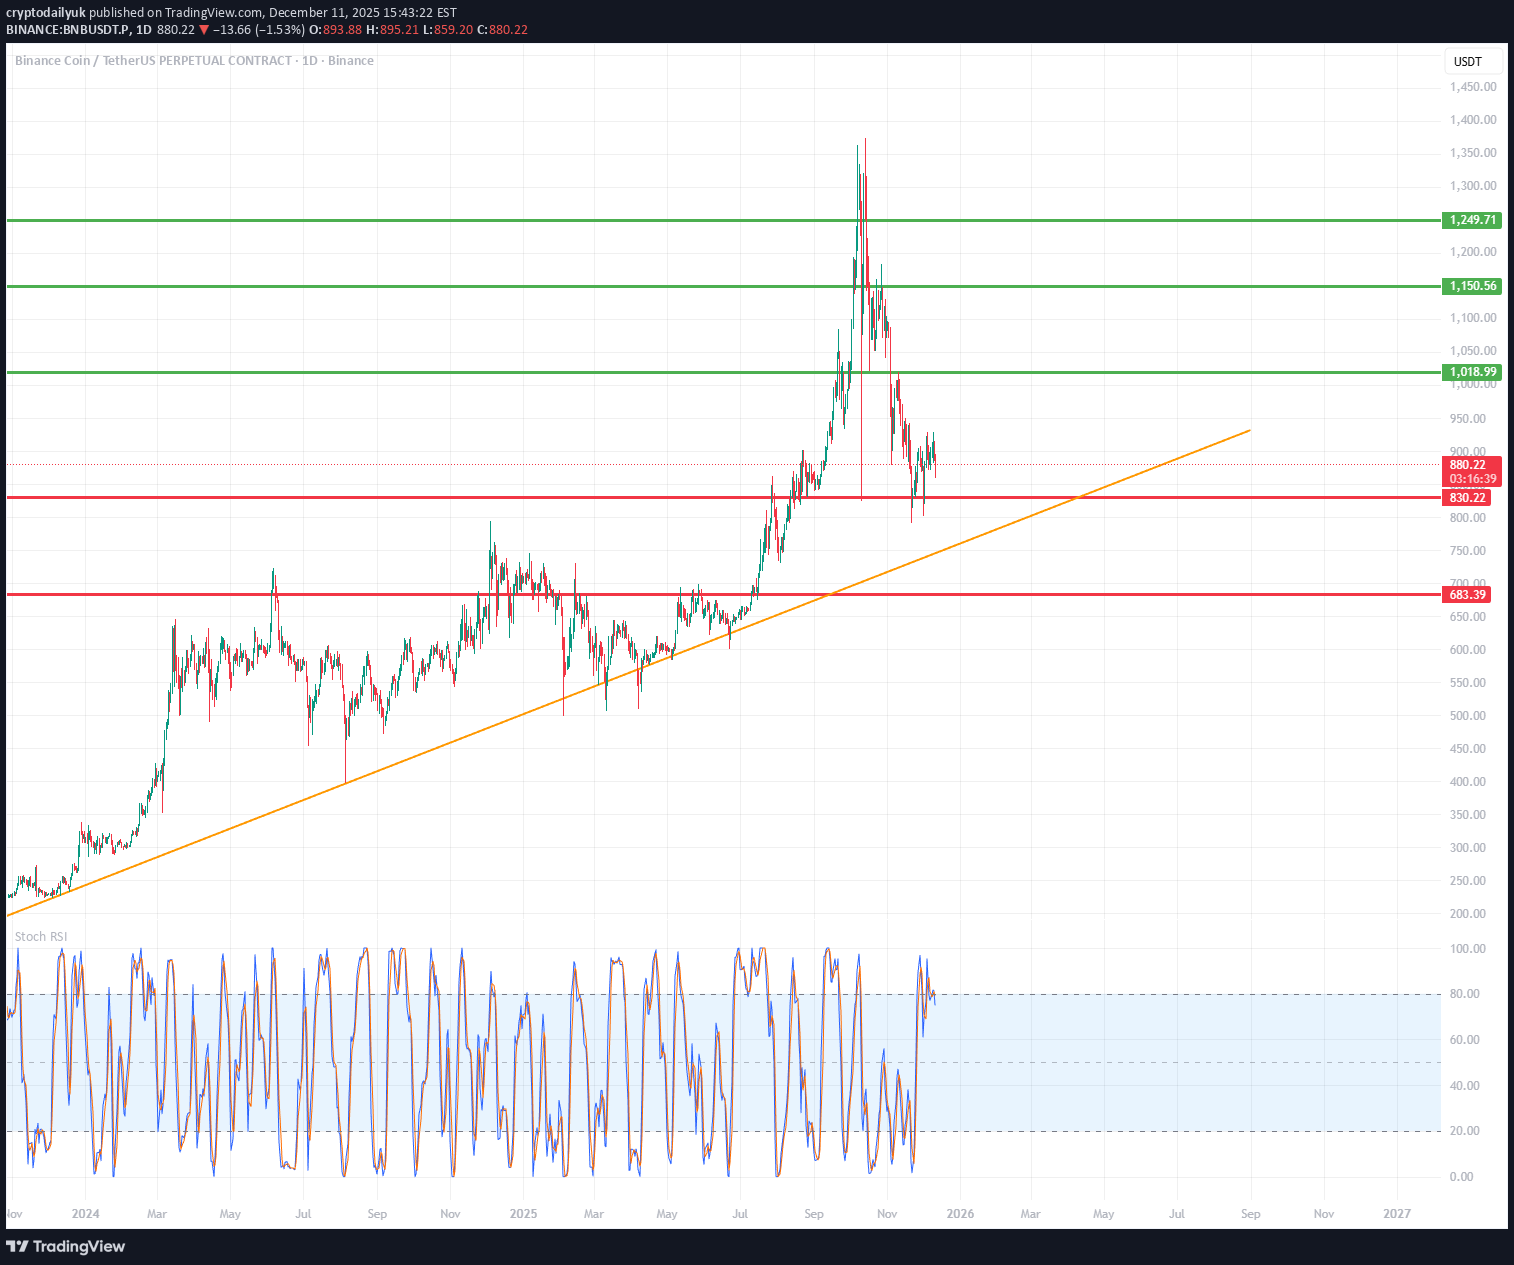
1️⃣ Market Structure and Trend The chart shows a long-term uptrend, confirmed by a very clean ascending trendline (orange), which has been acting as dynamic support for over a year. After a strong breakout to ~1380, the price began a correction but still hasn't broken the higher low structure → the uptrend is intact. 2️⃣ Key Levels (exactly from your chart) 🟢 Resistance Levels (green): ~1018 USDT ~1150 USDT ~1249 USDT These are potential targets for a renewed uptrend. 🔴 Support Levels (red): ~879 USDT – the closest important support ~838 USDT – a key defensive level ~683 USDT – deep support / last HTF trendline The price is currently trading directly above the first support level. 3️⃣ Trendline (orange) Your trendline is: strong, multi-point drawn on the D1 timeframe currently around 850–880 USDT ➡️ If the price falls, the trendline perfectly aligns with the 838–879 zone, strengthening this zone as a "must defend." 4️⃣ Oscillators – Stoch RSI (bottom) Currently: The oscillator is in a high zone (above 80) → indicating local overbought However, there is no clear downward crossover yet. Meaning: 👉 Upward momentum is still active, but we are closer to a local high than a low. 5️⃣ Scenarios 🟢 Upside scenario (more likely as long as the trendline holds) Condition: Maintaining the 879/838 levels and the trendline. Targets: 1018 USDT – first resistance 1150 USDT – important medium-term resistance 1249 USDT – main HTF target The longer the price consolidates above the orange trendline, the greater the chance of a renewed attack on 1150–1249. 🔴 Downside scenario (less likely, but crucial) Condition: Downside breakout of 838 USDT and closing of the D1 candle below the trendline. Then: the market could enter a deeper correction phase the target would be the 683 USDT level – this is also the main support level, where reactions were previously strong This is a "capitulation" scenario, but it doesn't seem to be dominant given the current price action. 6️⃣ What can we see on the chart "here and now"? ✔️ The price has rebounded from the local low ✔️ It is still between support at 879 and resistance at 1018 ✔️ The uptrend is intact ✔️ A potential HTF higher low has formed ✔️ The Stoch RSI shows momentum, but caution is warranted ➡️ The market is consolidating within the uptrend, with a high chance of a breakout upwards – provided support is maintained.
cryptodailyuk
تحلیل تکنیکال بیت کوین (4 ساعته): سطوح کلیدی و سناریوهای صعودی/نزولی آینده
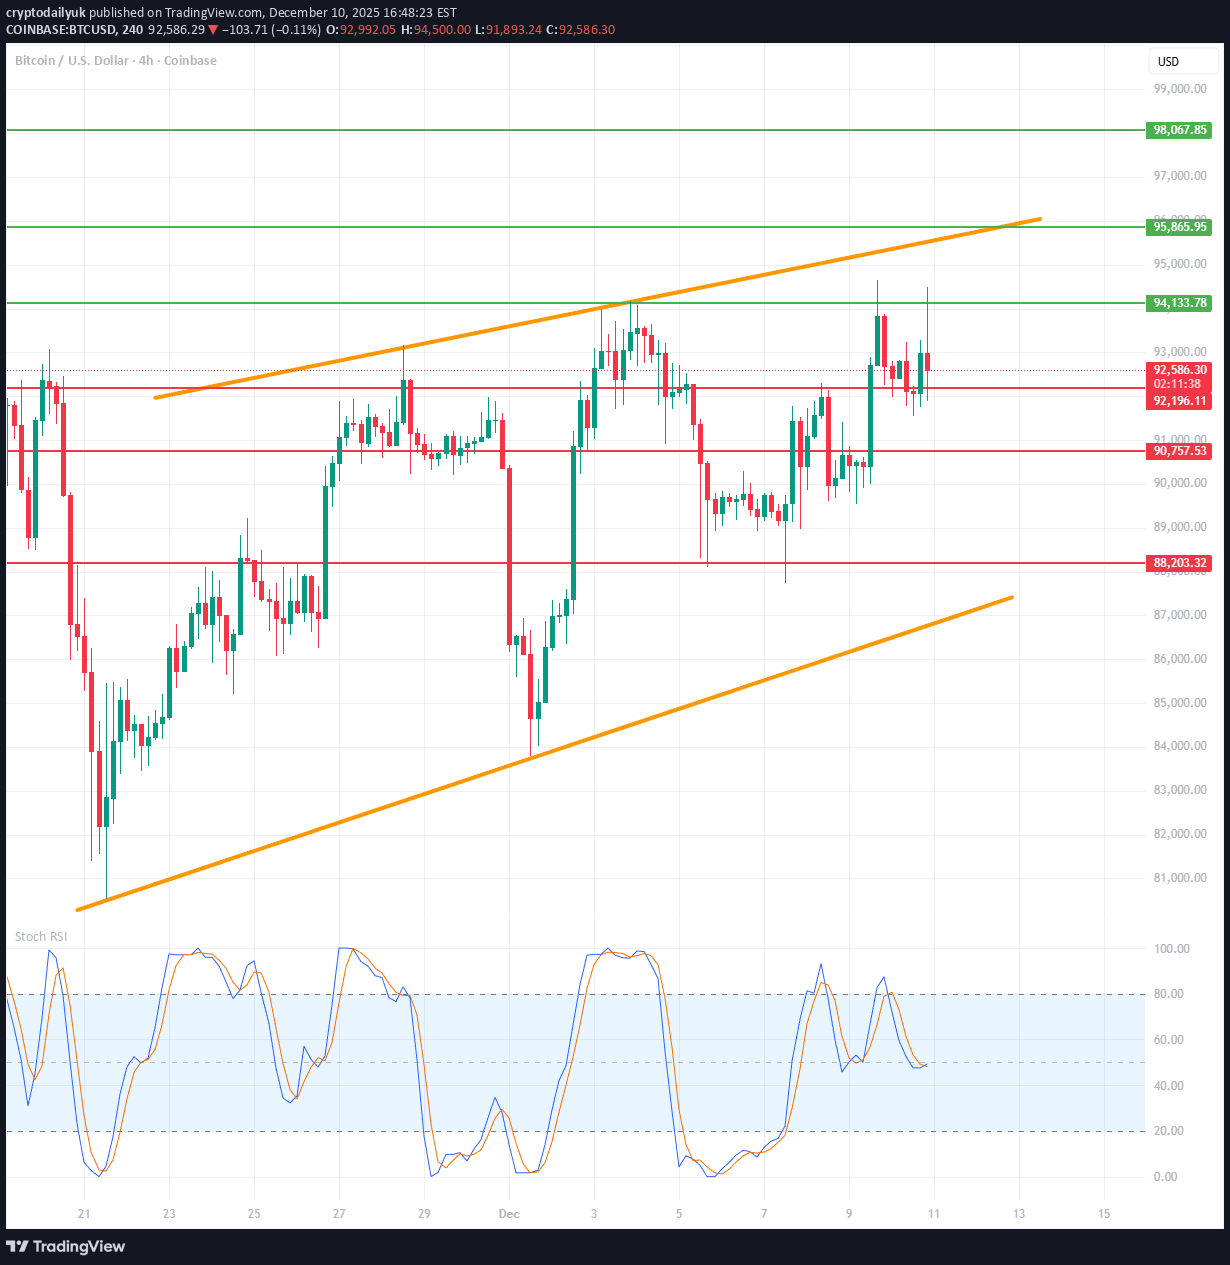
1. Market Structure: Ascending Channel (Orange) The chart clearly shows an ascending trend channel – the upper and lower orange lines. Lower Channel Support: ~$87,000 Upper Channel Resistance: ~$96,000 Medium-term trend = uptrend as long as the price remains within this channel. 2. Key Levels You Have Marked Resistance $94,133 – local resistance from which the price recently rejected. $95,866 – upper boundary of the resistance zone + near-upper channel line. $99,067 – high target upon channel breakout. Support $92,190 – price is currently within this zone, struggling to maintain it. $90,757 – important intraday support; a breakout opens the way lower. USD 88,203 – strong support, converging with the lower part of the channel. 3. Price action Currently, I see: Rejection from the 94.1k level, which is resistance. Attempt to return to the center of the structure, but the candlestick is rejected from above. The market is making a short-term lower high → slight weakening of momentum. 4. Stoch RSI Stoch RSI (4h): The lines are in a downward trend from the upper levels, meaning a short-term correction is just beginning. There is no signal for an upward reversal yet → momentum favors a move to lower support levels. ⭐ 5. Scenarios for the next hours/1–2 days BULLISH (if BTC maintains 92k–90.7k) Condition: No break below $90,757 Potential moves: Consolidation at 92k–91k Stoch RSI begins to curve upward Attack: $94,133 $95,866 (upper channel resistance) Target: → $96,000 → possible test of $99,000 with a strong breakout BEARISH (if BTC breaks $90,757 down) This is a key level. If it breaks: A quick decline to $88,203 High probability of a retest of the lower channel line (~87k) This still won't destroy the uptrend, but it will open the door to buying lower.
cryptodailyuk
تحلیل تکنیکال اتریوم (ETH): آیا نوسان صعودی یک تله است؟ (بررسی سطوح کلیدی)
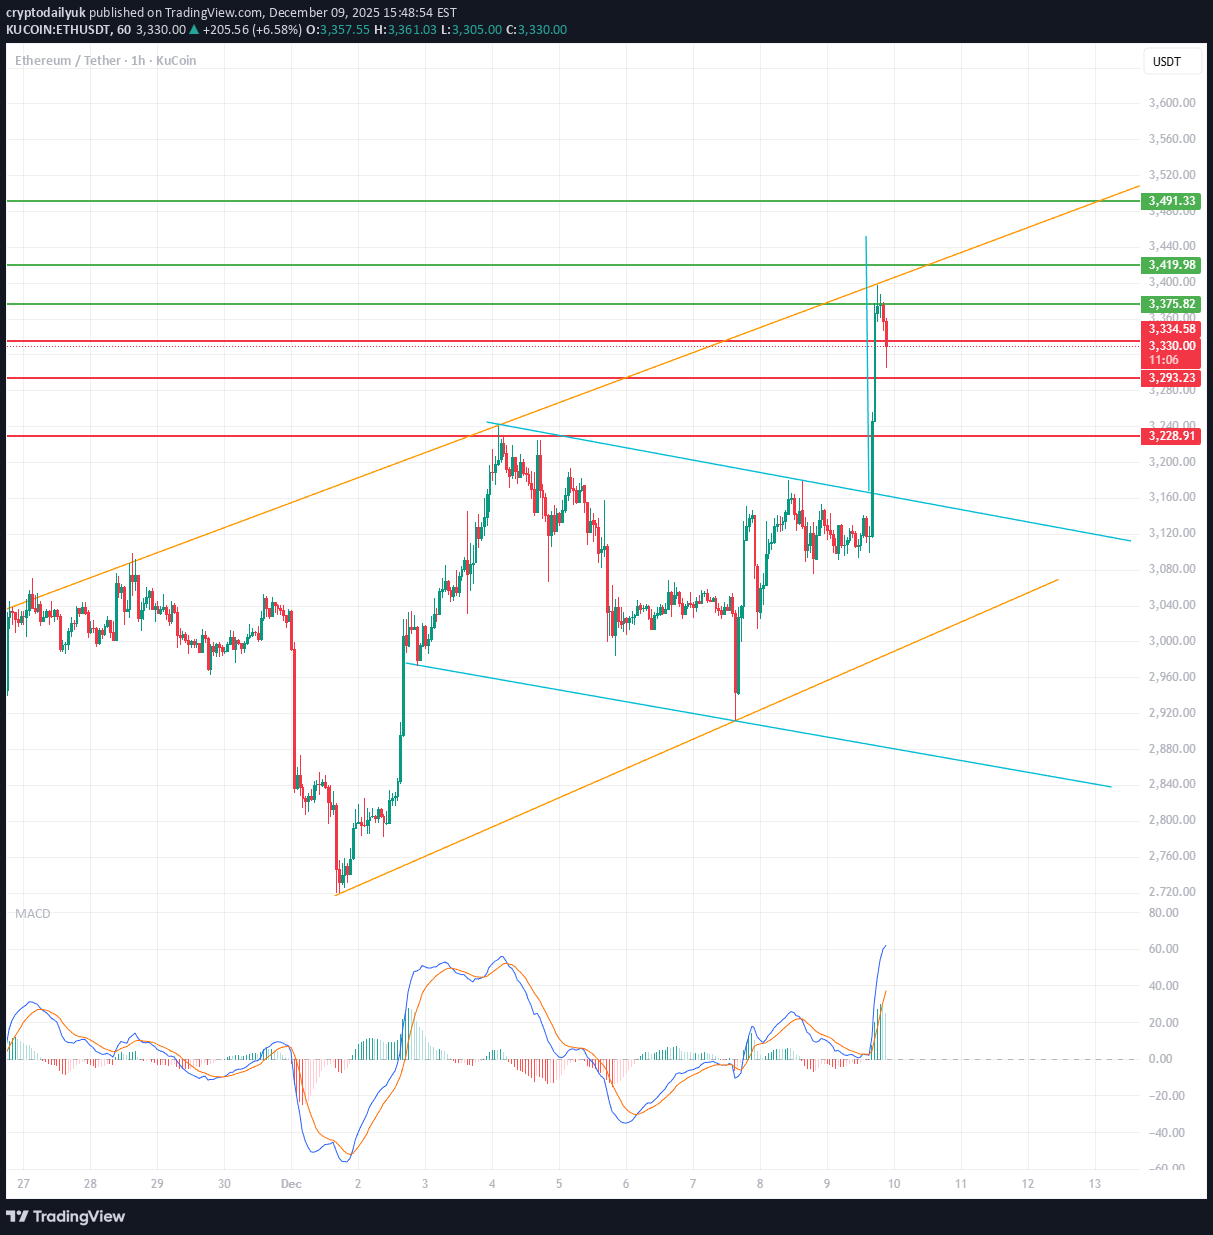
📊 ETH ANALYSIS – 1h 🔥 1. Key Fact on the Chart We have a very strong upward impulse that: Breaked the upper band of the descending channel (blue) Touched the upper line of the ascending channel (orange) Was immediately rejected (long wick) The MACD shows extreme overbought + potential divergence in the making Such a move usually indicates a short squeeze + profit-taking → i.e., a temporary weakening and a retest of the breakout. 🎯 2. Price areas I see on your chart Green (resistance/TP for longs): 3479–3490 – structural highs, strong resistance 3420 – local resistance 3375 – first real resistance after the breakout Red (support/defense levels of the structure): 3338–3348 – first test zone after the breakout 3293 – key level — sustain = trend continuation 3180–3200 – consolidation zone broken (likely retest) 📉 3. What does the current wick mean? This giant wick signals: short liquidations lack of demand for a continuation after the first resistance breakout high probability of a return to the range possibility of a retest of the breakout (around 3185–3210) This doesn't look like a classic breakout with a continuation, but rather a fakeout and the need for a correction. 📈 4. Scenarios ➡️ Bullish (more likely if 3293 holds) Price falls to the 3338–3293 zone Builds a local HH/HL Starts a move to 3375, then 3420 If 3420 breaks → target 3480–3500 ➡️ Bearish (if price loses 3293) Retest from the bottom of 3293 Return to the blue channel Target: 3185–3200 If this level breaks → 3050–3080 (lower band of the channel) 📟 5. MACD MACD is: extremely stretched signal line begins to collapse histogram decreases after Explosion → This almost always means a local intraday high + a drop to support.
cryptodailyuk
ETHUSD 1D chart
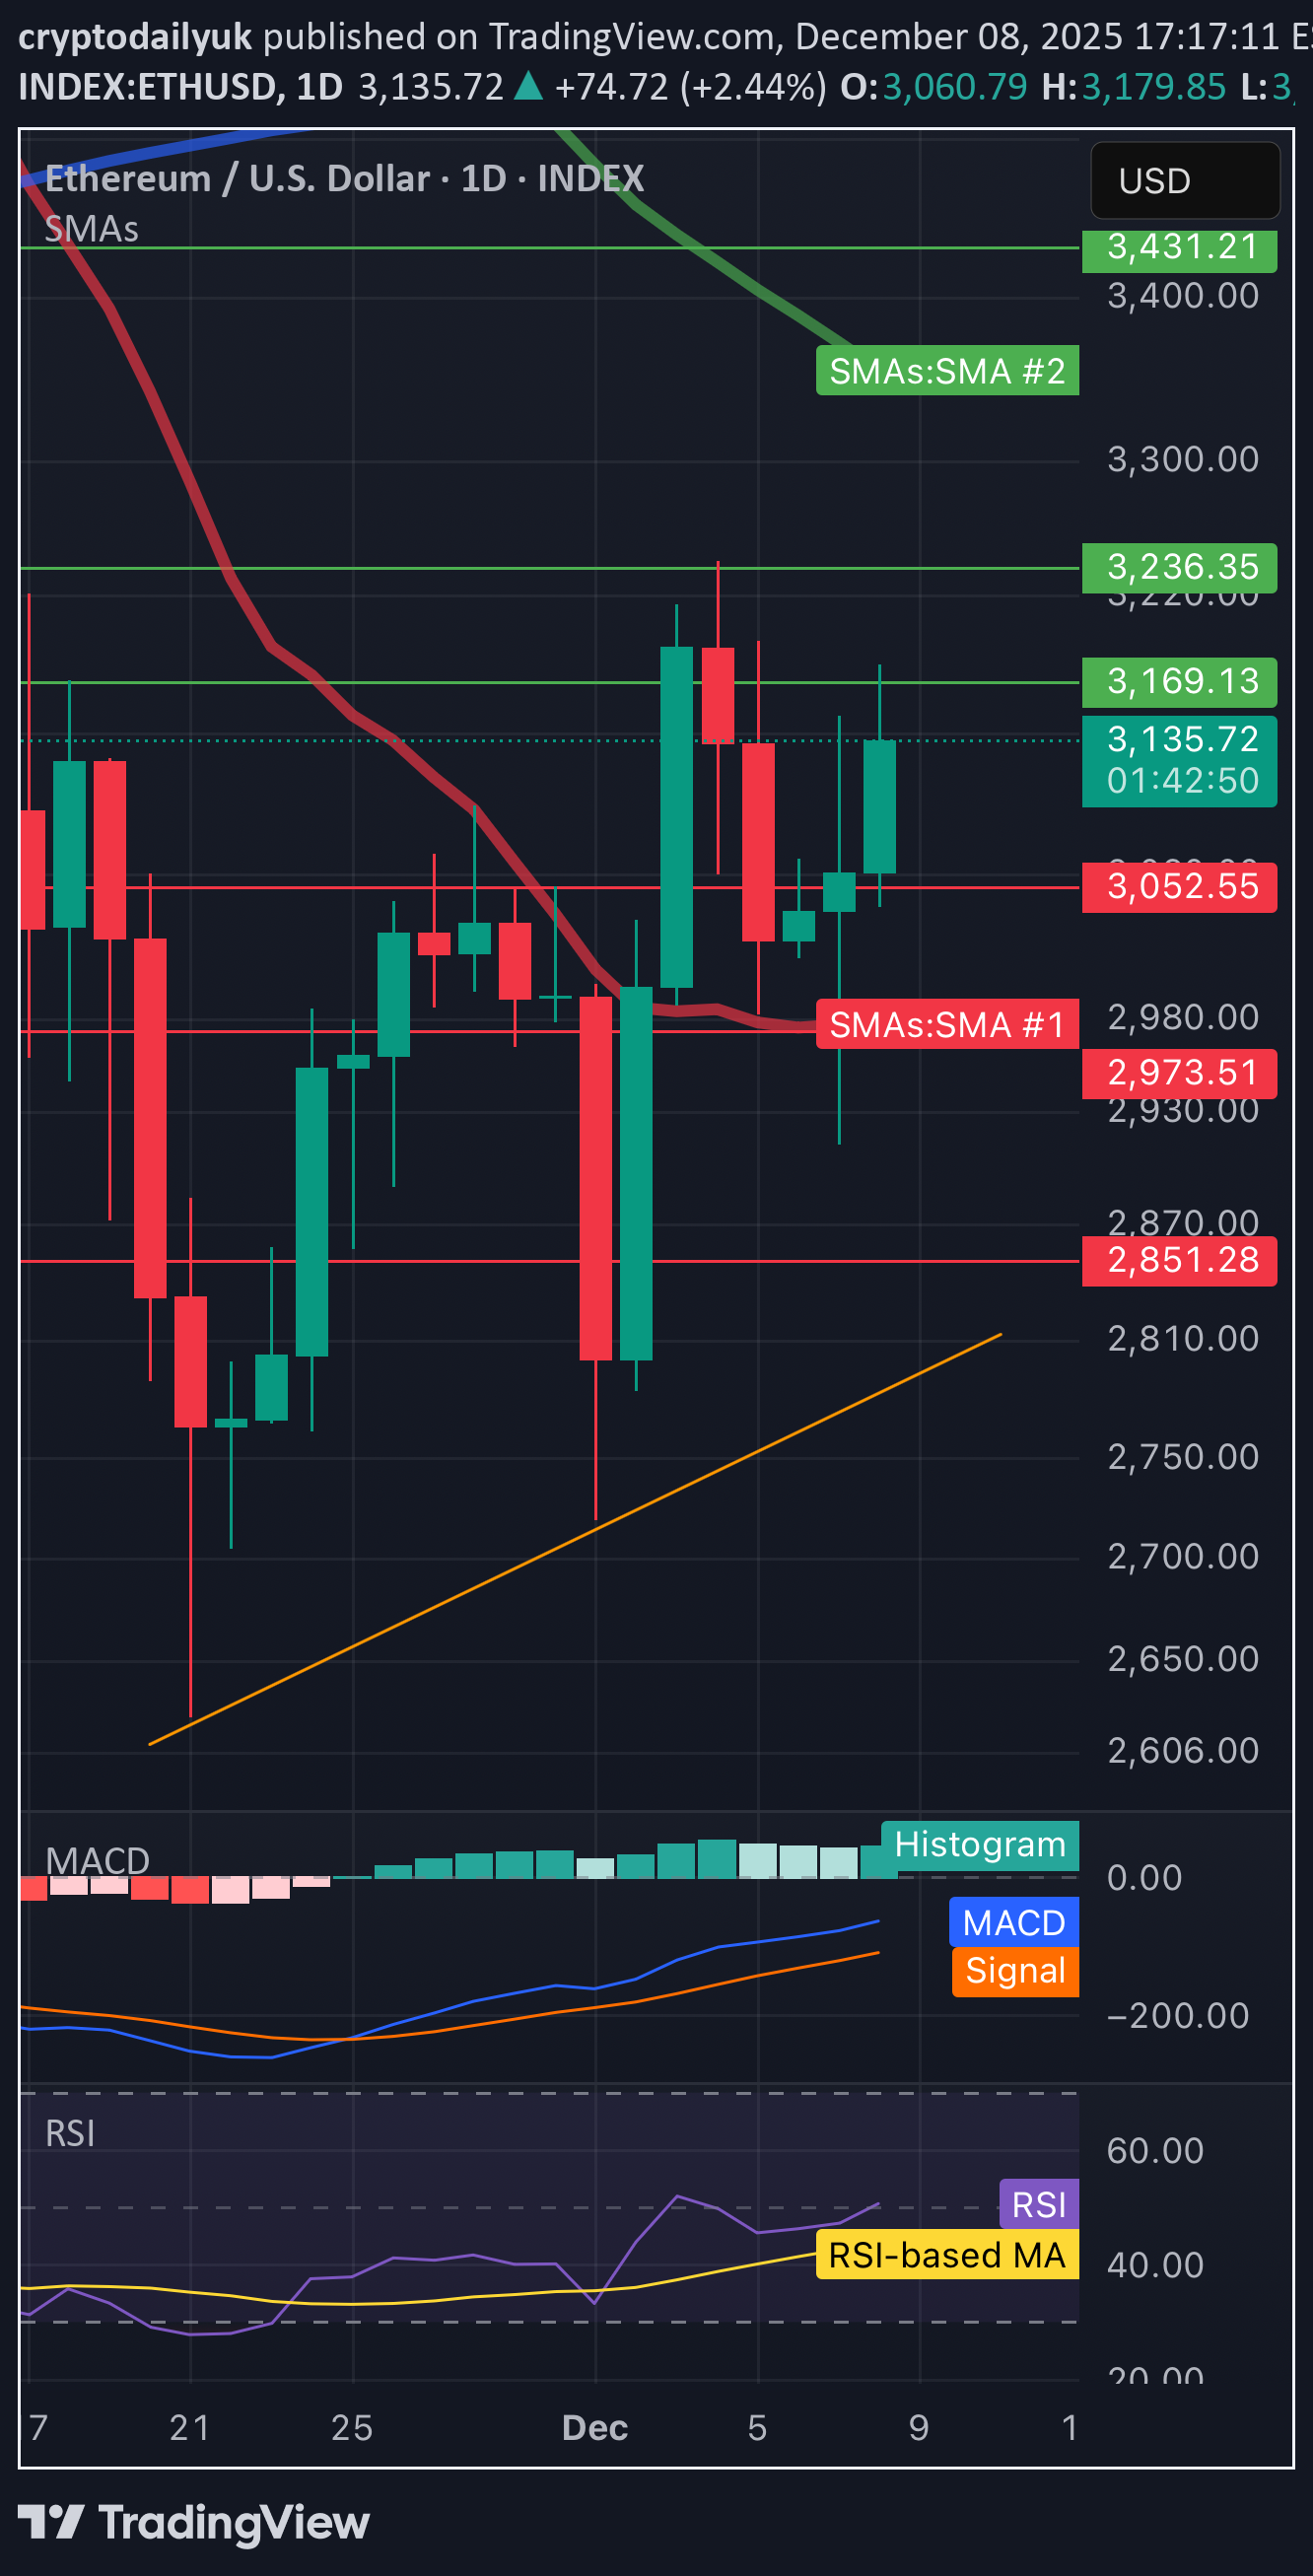
1️⃣ Trend and key levels Trend • The overall neutral-growth trend, but with clear consolidation. • The price rebounded dynamically from the bottom (approx. USD 2,850), which creates the first higher low structure → the potential beginning of an upward impulse. Support • $2,973-$3,000 – SMA #1 + local support. • USD 2,851 – strong support from which the candle made a very large wick upwards. Resistances • USD 3,169 – the first strong resistance, several candles bounced from this level. • $3,236 – key daily resistance. Breakout = signal of strong momentum and opening the way to USD 3,300-3,430. ⸻ 2️⃣ Candle formation and behavior • A bullish candle with a long lower wick appeared → this is a signal of buyers. • The price is making a series of higher lows, but no higher high yet → the market is waiting for a breakout of USD 3,236 to confirm the uptrend. ⸻ 3️⃣ SMA (moving averages) 🔴 SMA #1 (short-term) • Price is just above it → acts as support. • If the daily candle closes below $3,000, the downside momentum returns. 🟢 SMA #2 (long term, ~$3,430) • Is high above the price → long-term bearish pressure until the price returns to the price area. ⸻ 4️⃣ RSI (momentum) RSI around 45–50 • Neutral territory. • Zero overbought/oversold. • Slight upward trend in RSI → buyer momentum is growing, but without an overheating signal. Conclusion: The market has room to move higher before the RSI becomes high. ⸻ 5️⃣ MACD • MACD is above the signal line → slight, early bullish signal. • The histogram increases, but there is no significant acceleration. Interpretation: increases are possible, but without strong momentum yet.
cryptodailyuk
تحلیل بیت کوین (BTC/USDT): فرصت صعود به کانال 94,500 دلار یا ریزش؟
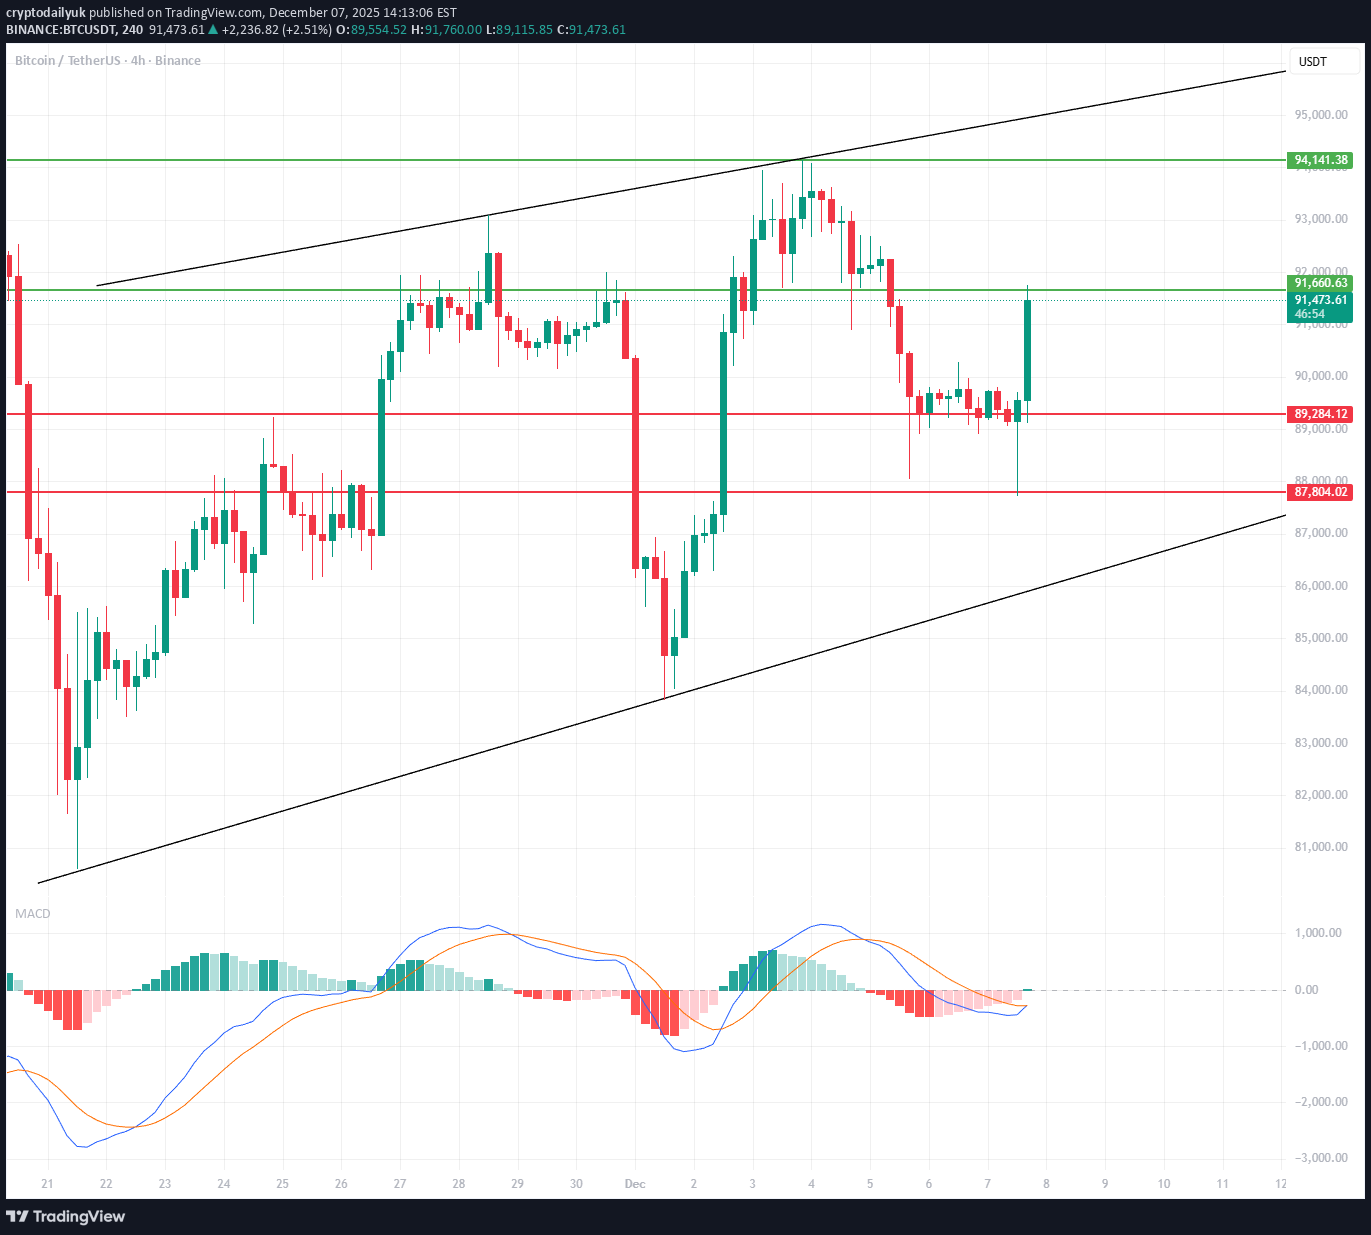
🔍 MARKET STRUCTURE The chart shows a broad ascending channel in which BTC has been moving for several days: Lower trend support: ~$87,500 – $88,000 Upper trend line: ~$94,500 – $95,000 The price has clearly rebounded from around $89,200, an important demand level. 📈 KEY LEVELS Support USD 89,284 – local support from which a rebound occurred USD 87,804 – the next, much stronger support level consistent with the trendline Resistance USD 91,466 – currently being tested USD 94,141 – key resistance and the upper band of the channel 📊 CHART SITUATION (4 hours) 1. Price action The price has made a strong upward impulse from support at USD 89,280. It is currently reaching local resistance at USD 91,450 – USD 91,700. If this level is broken, the target is USD 94,000 – USD 94,500. If it fails, a pullback to USD 90,200/USD 89,300 can be expected. 📉 MACD Your MACD shows: Bullish crossover – buy signal. The histogram changes from red to green → momentum is increasing. The curves are diverging, confirming the strength of the move. This indicates that the short-term trend is turning bullish. 📌 TWO TRADING SCENARIOS 🟢 BULLISH Scenario (more likely) Condition: H4 candle breakout and close above USD 91,700. Targets: TP1 → USD 92,800 – USD 93,200 TP2 → USD 94,000 – USD 94,500 (upper channel) Stop-loss (if you were going long): below USD 90,500 Safer below USD 89,280 MACD confirms this scenario. 🔴 BEARISH Scenario Condition: rejection of USD 91,700 and a close below USD 90,500. Targets: TP1 → USD 89,300 TP2 → USD 87,800 (key trendline) A drop to USD 87,800 would be an ideal place for large players to buy again.
cryptodailyuk
تحلیل نمودار 4 ساعته بیت کوین (BTC/USDT): آیا ریزش ادامه دارد؟ (سطوح کلیدی حمایت و مقاومت)
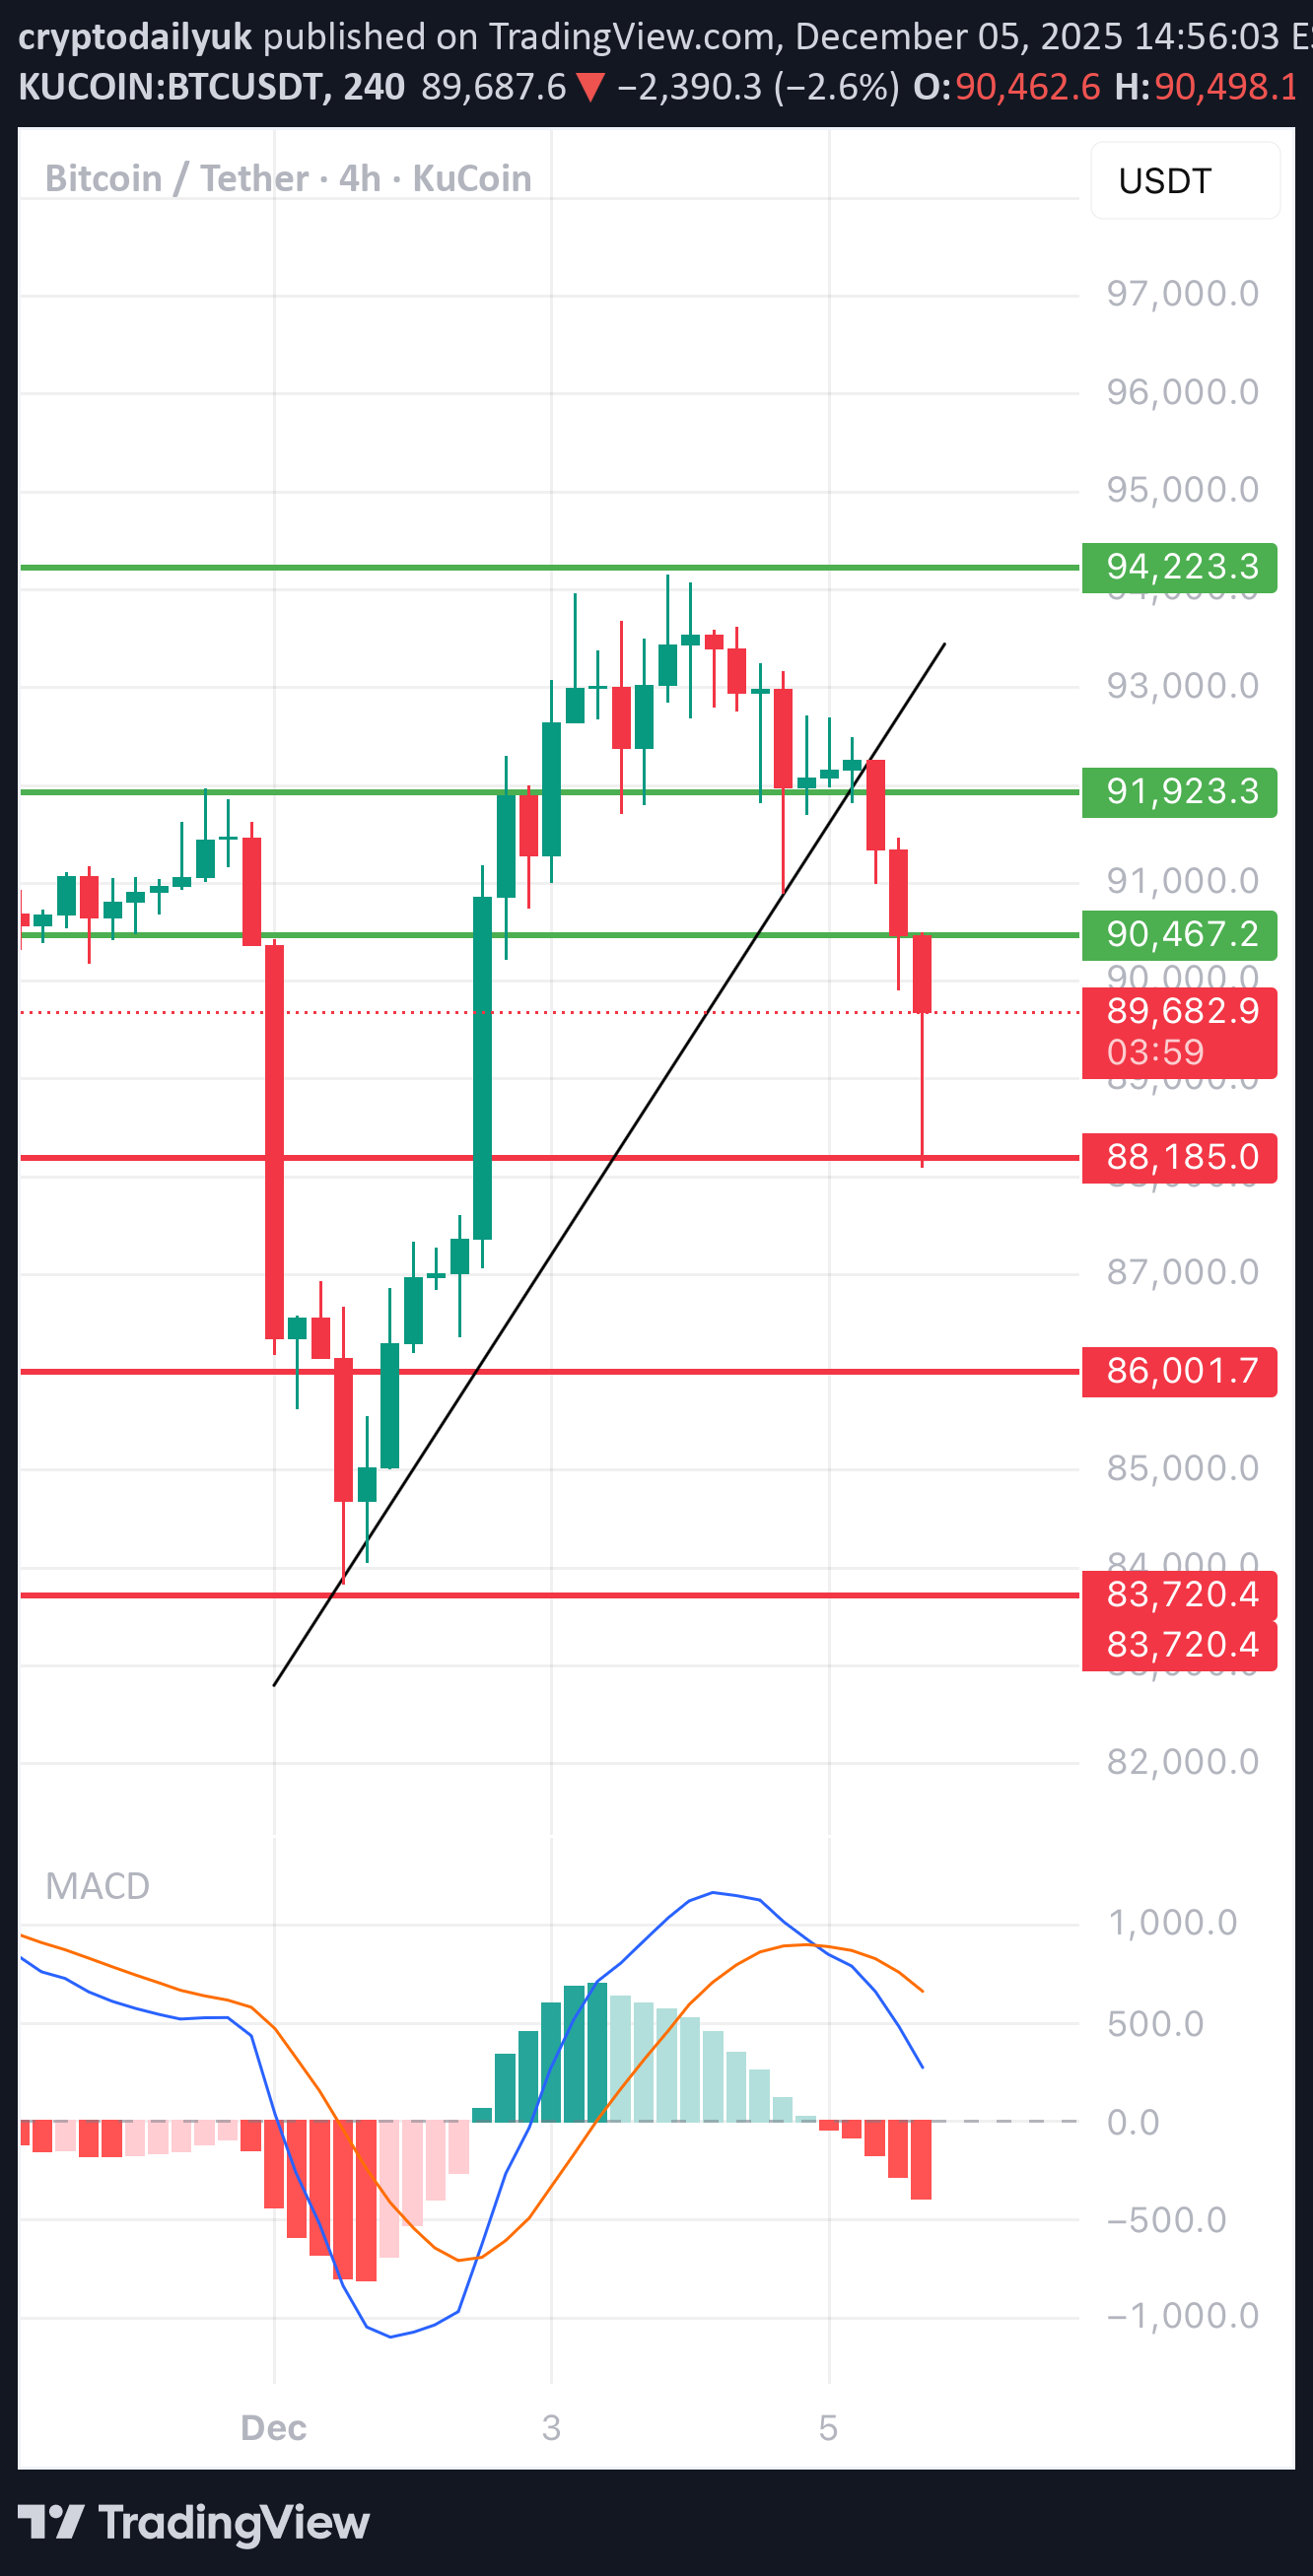
📉 1. Market structure – short-term 4H trend In the chart I see: • Breaking the upward trend line (black diagonal) – a classic signal of weakening momentum. • After the breakout, there was a quite strong downward impulse, which confirms that the intraday trend has turned bearish. • The price is currently testing around USDT 89,500-90,000, where a reaction is emerging, but not strong yet. 👉 Conclusion: 4H is now in a bearish correction and the market looks ready to test further lower supports. ⸻ 🧭 2. Support and resistance levels (from your chart) Upcoming supports: 1. 89,500–89,000 – the current level at which the market is trying to defend itself. 2. 88 185 – clear red line, first logical support lower. 3. 86,001 – next demand level, big candle from the past. 4. 83,720 – deeper support to which the market returns when there is great fear. The nearest resistances (which need to be recovered to return to growth): 1. 90,467 – first key resistance; now it will work as a "flip". 2. 91 923 – stronger resistance; This is where the declines began. 3. 94,223 - only breaking this level shows that the bulls are back. 👉 The market is currently sitting BELOW the key resistance of 90,467, so downward pressure is active. ⸻ 📉 3. Analysis of candles and price behavior • The last 4-6 candles are large red bodies, which shows the clear dominance of supply. • After the breakout of the trendline, there is no strong pullback - this means that the bears do not allow for a rebound. • The lower shadow on the last candle indicates buyer reaction, but no confirmation yet. 👉 If 89,500 is broken, a move to 88,185 is very likely. ⸻ 📉 4. MACD – negative signal MACD shows: • Bearish cross – the blue line crossed the orange line from above. • The histogram turns into red bars - the downward momentum is increasing. • MACD is below zero → confirmed downward trend in the 4-H interval. 👉 MACD confirms what we see on the chart: momentum is falling and a rebound is unlikely without consolidation.
cryptodailyuk
تحلیل نمودار 4 ساعته بیت کوین: آیا کانال صعودی میشکند؟ (سطوح کلیدی 90,000 دلار)
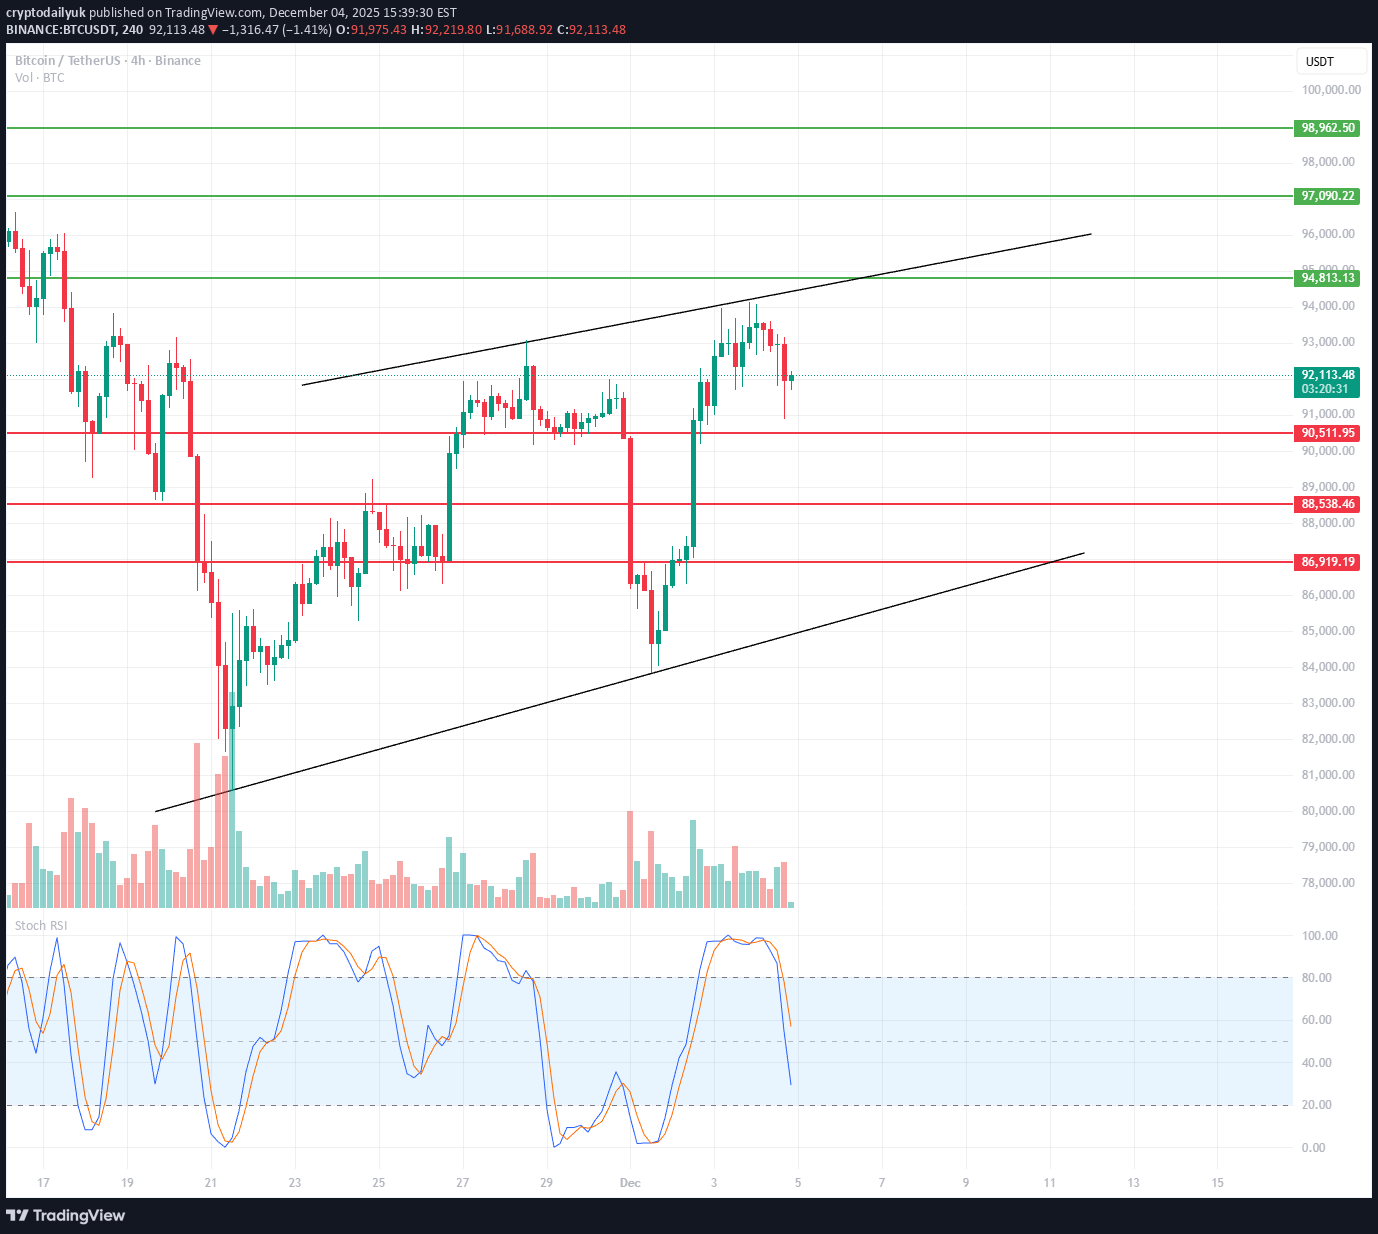
1. Market Structure: Rising Channel (Upward Wedge / Rising Channel) The chart clearly shows that BTC is moving within an ascending channel, with: the upper boundary around USD 95,000–95,500, the lower boundary currently reaching USD 86,500–87,000. This is a potentially exhausting formation, and lower breakouts are often dynamic. 2. Current Situation: Rebound from the upper band and Stoch RSI overbought → decline The price has stopped exactly at the upper resistance of the channel and has begun a correction. This is typical behavior – the market usually returns to the middle or lower edge of the channel. Stoch RSI on 4H – has made a strong reversal from the overbought zone → a signal for a short-term correction has already been generated. 3. Support Levels (most important): 🔴 USD 90,500–90,000 A very important zone – previous resistance ⇒ now support. Breakout = increased risk of a deeper breakout. 🔴 USD 88,500–88,000 A strong demand level for the 4-hour period, also aligned with the MA and local lows. 🔴 USD 86,500–87,000 The lower band of the channel – the most likely place for buyers to become active. 4. Resistance Levels: 🟢 USD 94,800 Previous local high – a breakout will be bullish. 🟢 USD 98,000–98,900 Strong resistance on the chart, likely target after a breakout of the channel to the upside. 5. Scenarios for the coming hours: 📉 Correction scenario (more likely based on the Stoch RSI) The price could fall to one of the following zones: 92,000 → test in progress 90,500–90,000 USD → main market decision level If it loses 90,000 → a move to 88,500–88,000 is natural. Deeper correction: test of the lower channel line – ~86,500 USD. In this scenario, we remain in an uptrend unless the channel breaks below. 📈 Uptrend scenario The current decline could only be: a local correction, a retest of the previous demand zone. Uptrend condition: ➡️ 4-hour candlestick retracement and close above ~94,000 USD. Then the target: 94,800 95,500 and after the channel breakout → $98,000–$99,000
cryptodailyuk
تحلیل بیت کوین BTC/USDT: سقوط ادامه دارد؟ سطوح کلیدی 79 هزار و 75 هزار کجاست؟
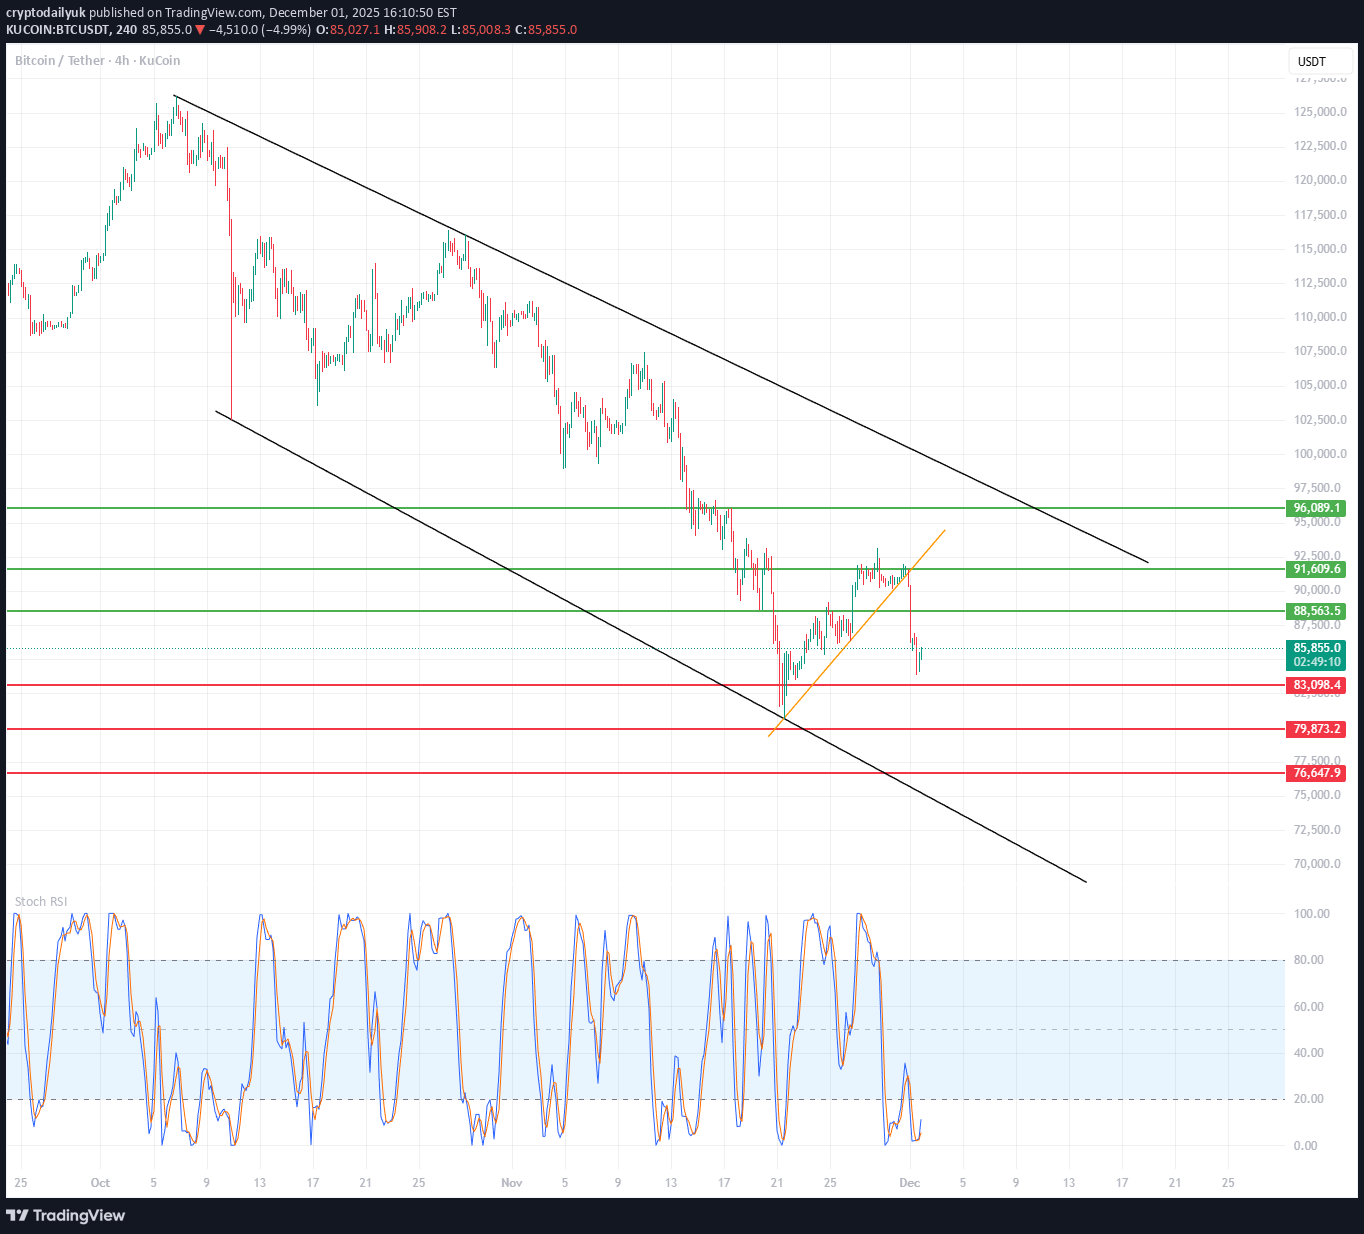
🧭 1. Main Market Structure The chart shows: A broad downward channel that has been in place since the end of October. The price bounced off the upper line of the channel, made a local upward impulse (orange trend line), and then broke it, returning back towards the lower regions of the channel. ➡️ This means that the dominant trend is still downward, and upward bounces are corrections. 🧨 2. Current Chart Situation BTC has broken through: the local uptrend (orange line) fell below the 88,500–89,000 zone (green) is heading towards further support levels Currently, the price looks like a typical retest of the broken structure and a continuation of the decline. 🟩 3. Key Price Levels (S/R) Resistance (upper – green): 91,600 – 92,000 – key level, a breakout would negate the local downtrend 95,000 – 97,500 – upper range of the descending channel Support (lower – red): 85,300 – 85,800 – local support (price is currently reacting here) 83,000 – 83,100 – strong horizontal support 79,800 – strong support, historically strong in this timeframe 76,600 75,000 – lower band of a potential drop + near the lower boundary of the channel ➡️ The most logical downside targets are 83,000 and 79,800. 📉 4. Descending Channel (black) (lines) The price has rebounded from the upper range of the channel and is heading towards the lower range. The middle line of the channel has been broken down → a signal of trend continuation. The lower boundary of the channel indicates a potential low around 75,000–78,000. 🔄 5. Stoch RSI Currently oversold in the oversold zone, it is starting to curve upwards. In a downtrend, long signals are weaker, but a short-term rebound is possible. 🧭 6. Scenarios 📉 Bearish scenario (more likely) Technical rebound to 88,500 – 89,000 Rejection from this zone → continued decline Targets: 83,000 79,800 Extremes: 76,000 – 75,000 ➡️ This scenario is consistent with the trend and a rebound from the upper channel.
cryptodailyuk
تحلیل BNB/USDT: نقطه عطف حیاتی؛ خریدار یا فروشنده برنده است؟
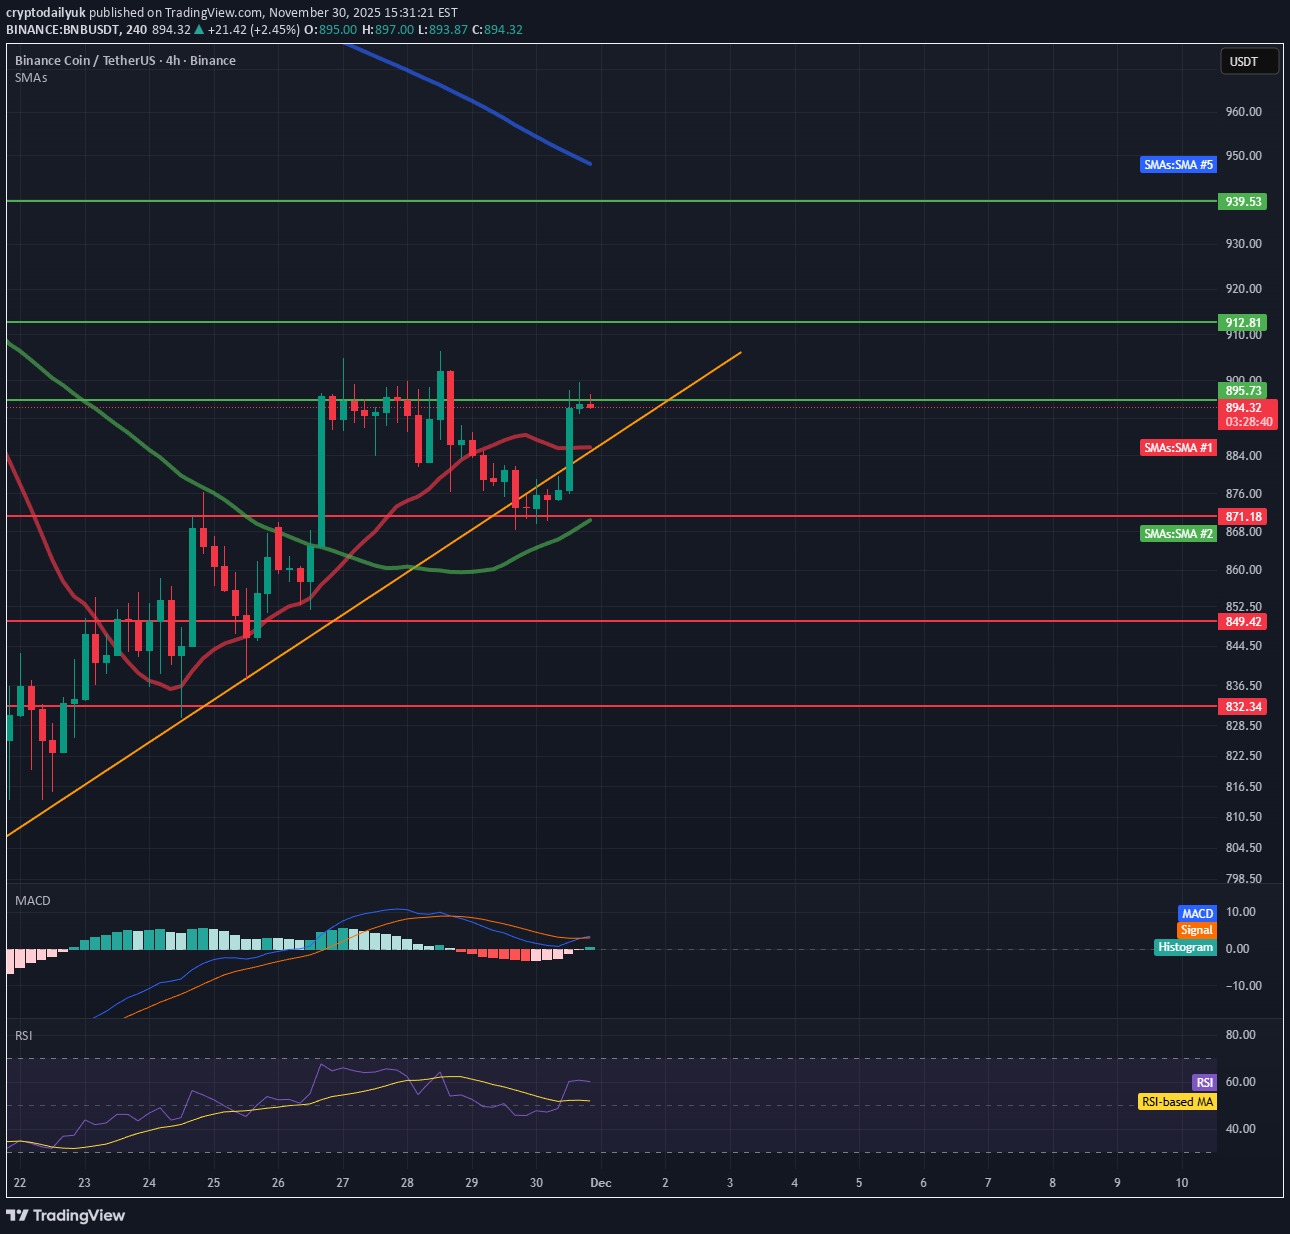
🔶 1. Current Trend and Market Structure The chart shows: A clear short-term uptrend – the price is respecting the ascending yellow trend line. An increase after a bounce from the SMA 50 (green). However, there are still no new higher highs – the market is consolidating between 888–910. ➡️ Short-term trend: up ➡️ Medium-term trend: neutral/consolidation 🟩 2. Key Support/Resistance Levels Resistance: 910–912 USDT – currently a key resistance, tested multiple times. 930–935 USDT – local higher resistance (green zone on your chart). 957–960 USDT – stronger resistance from D1 (blue SMA95 visible in the screenshot). Supports: USDT 889–893 – local support and the current battleground. USDT 871 – SMA 50 + previous swing low. USDT 849 – powerful support from the HTF. USDT 837 – the final “lifeline” of the bullish structure. 📈 3. Indicators (MACD, RSI) MACD MACD > 0 – positive. The MACD line is starting to point upwards → a signal of bullish momentum. No divergence. ➡️ MACD supports the bullish scenario. RSI RSI ~59 – a healthy zone, far from overbought. RSI breaks the local downtrend → increasing buyer strength. ➡️ RSI confirms the bullish trend. 🟧 4. Key Price Action Now The price is currently approaching resistance at 910–912 USDT and simultaneously touching the local trend line. This is the market's decision point. A breakout → opens the way to 930–935. A rejection → a return to 889, and below 871.
Disclaimer
Any content and materials included in Sahmeto's website and official communication channels are a compilation of personal opinions and analyses and are not binding. They do not constitute any recommendation for buying, selling, entering or exiting the stock market and cryptocurrency market. Also, all news and analyses included in the website and channels are merely republished information from official and unofficial domestic and foreign sources, and it is obvious that users of the said content are responsible for following up and ensuring the authenticity and accuracy of the materials. Therefore, while disclaiming responsibility, it is declared that the responsibility for any decision-making, action, and potential profit and loss in the capital market and cryptocurrency market lies with the trader.