Technical analysis by cryptodailyuk about Symbol ETH on 18 hour ago

cryptodailyuk
ETH/USDT 1D CHart Long-Term
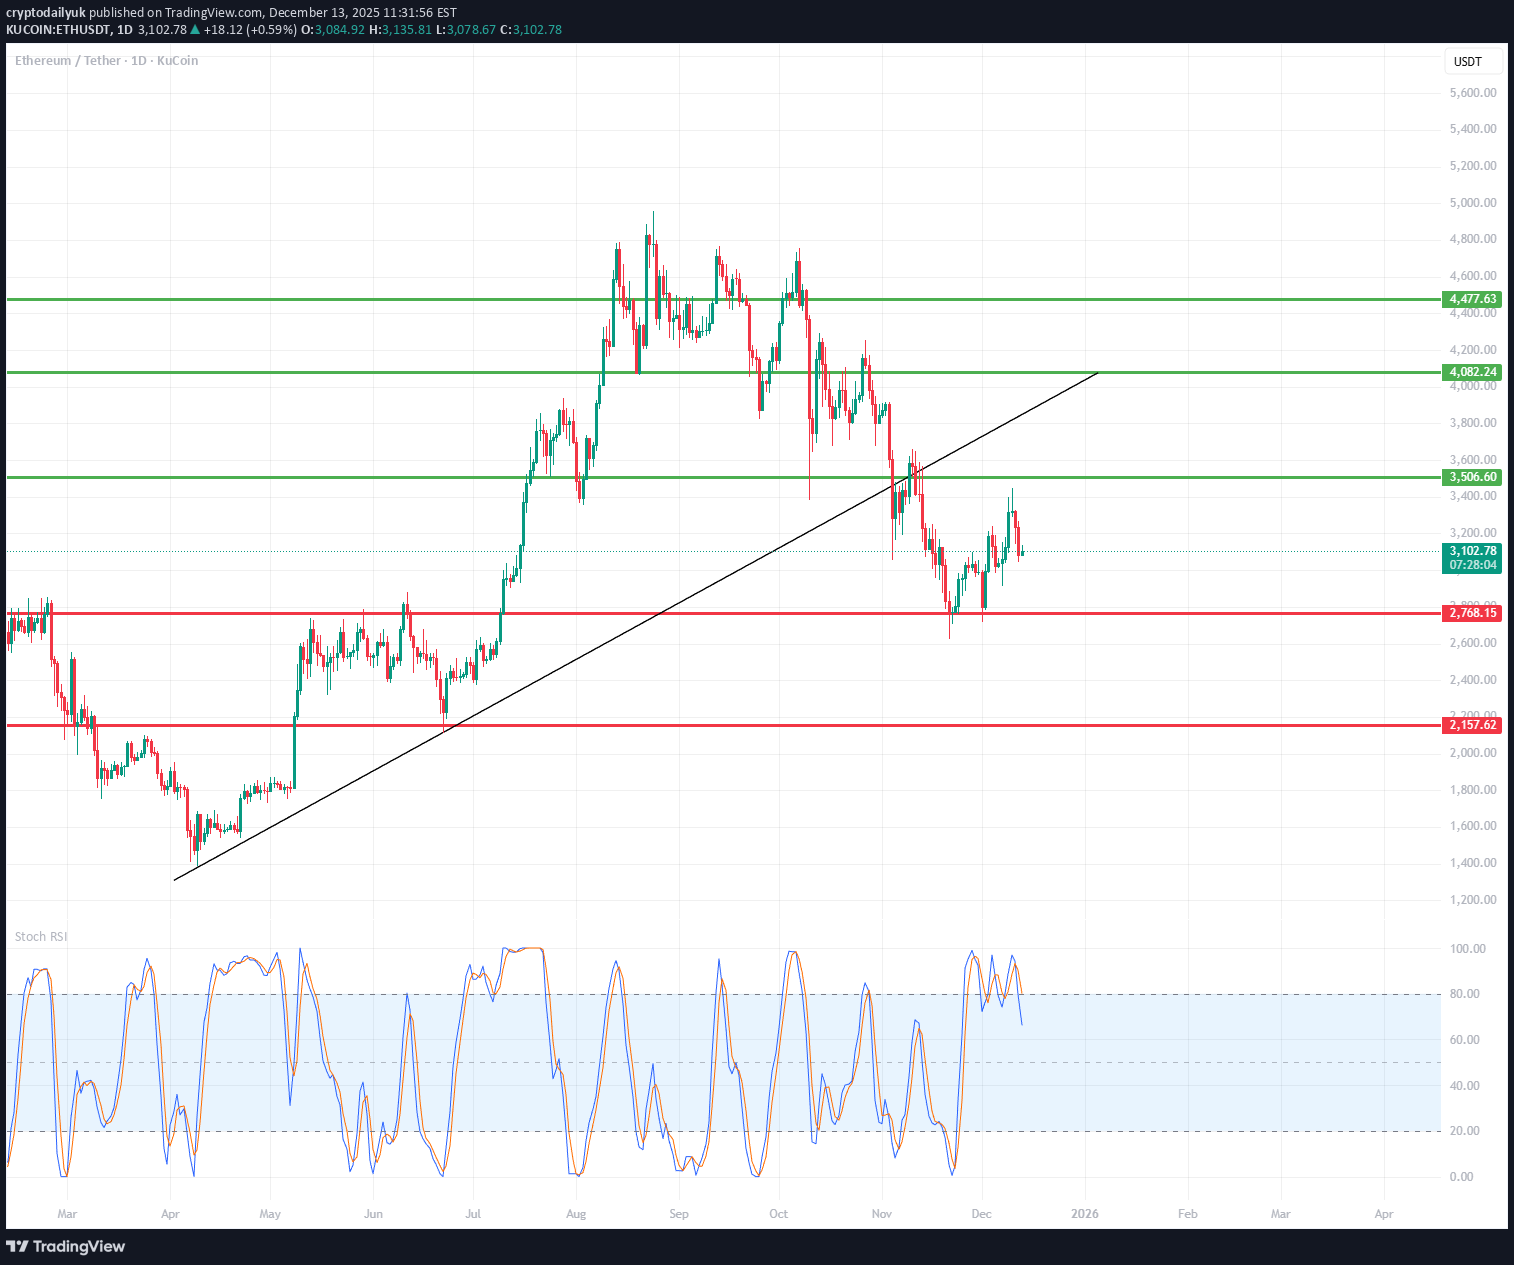
. 🔍 Market Structure (Price Action) 1️⃣ Trend Long-term: The uptrend has been broken (a downward breakout from the black trend line). Medium-term: A sequence of lower highs and lower lows → a downtrend. The current rebound is a correction in the downtrend, not a confirmed reversal. 📐 Key Levels (very well marked) 🔴 Support 2768 USDT – key support (current local bottom). 2157 USDT – final support from the previous structure (if 2768 breaks → a very real pullback). 🟢 Resistance 3506 USDT – current nearest resistance (retest after a downward breakout). 4101 USDT – strong supply zone + former support. 4477 USDT – main structural resistance (region of previous highs). 👉 Price is now exactly in the decision zone between 2768 and 3506. 📉 Trendline Breaked and rejected (retest ended with a decline). This is a classic signal of a downtrend continuation. Until the price returns above 3506 and sustains, there is no uptrend. 📊 Stochastic RSI The oscillator frequently reaches the 80–100 zone. Currently: Moving out of overbought → signal of weakening upward momentum. No bullish divergence → no confirmation of a trend change. 🧠 Scenarios 🐻 Baseline scenario (more likely) Rejection of 3506 Return to around 3000 → 2768 Breakthrough of 2768 = open path to ~2150 🐂 Alternative (conditional) scenario Daily close above 3506 Retest of 3506 as support Only then is a move towards 4100 possible 🎯 Final conclusions This is not a market for longs without confirmation. The current rebound looks like a pullback in a downtrend. Safeest: Short at resistance (3506 / 4101) Long only after a breakout and holding of 3506