Technical analysis by cryptodailyuk about Symbol BTC on 12/5/2025

cryptodailyuk
تحلیل نمودار 4 ساعته بیت کوین (BTC/USDT): آیا ریزش ادامه دارد؟ (سطوح کلیدی حمایت و مقاومت)
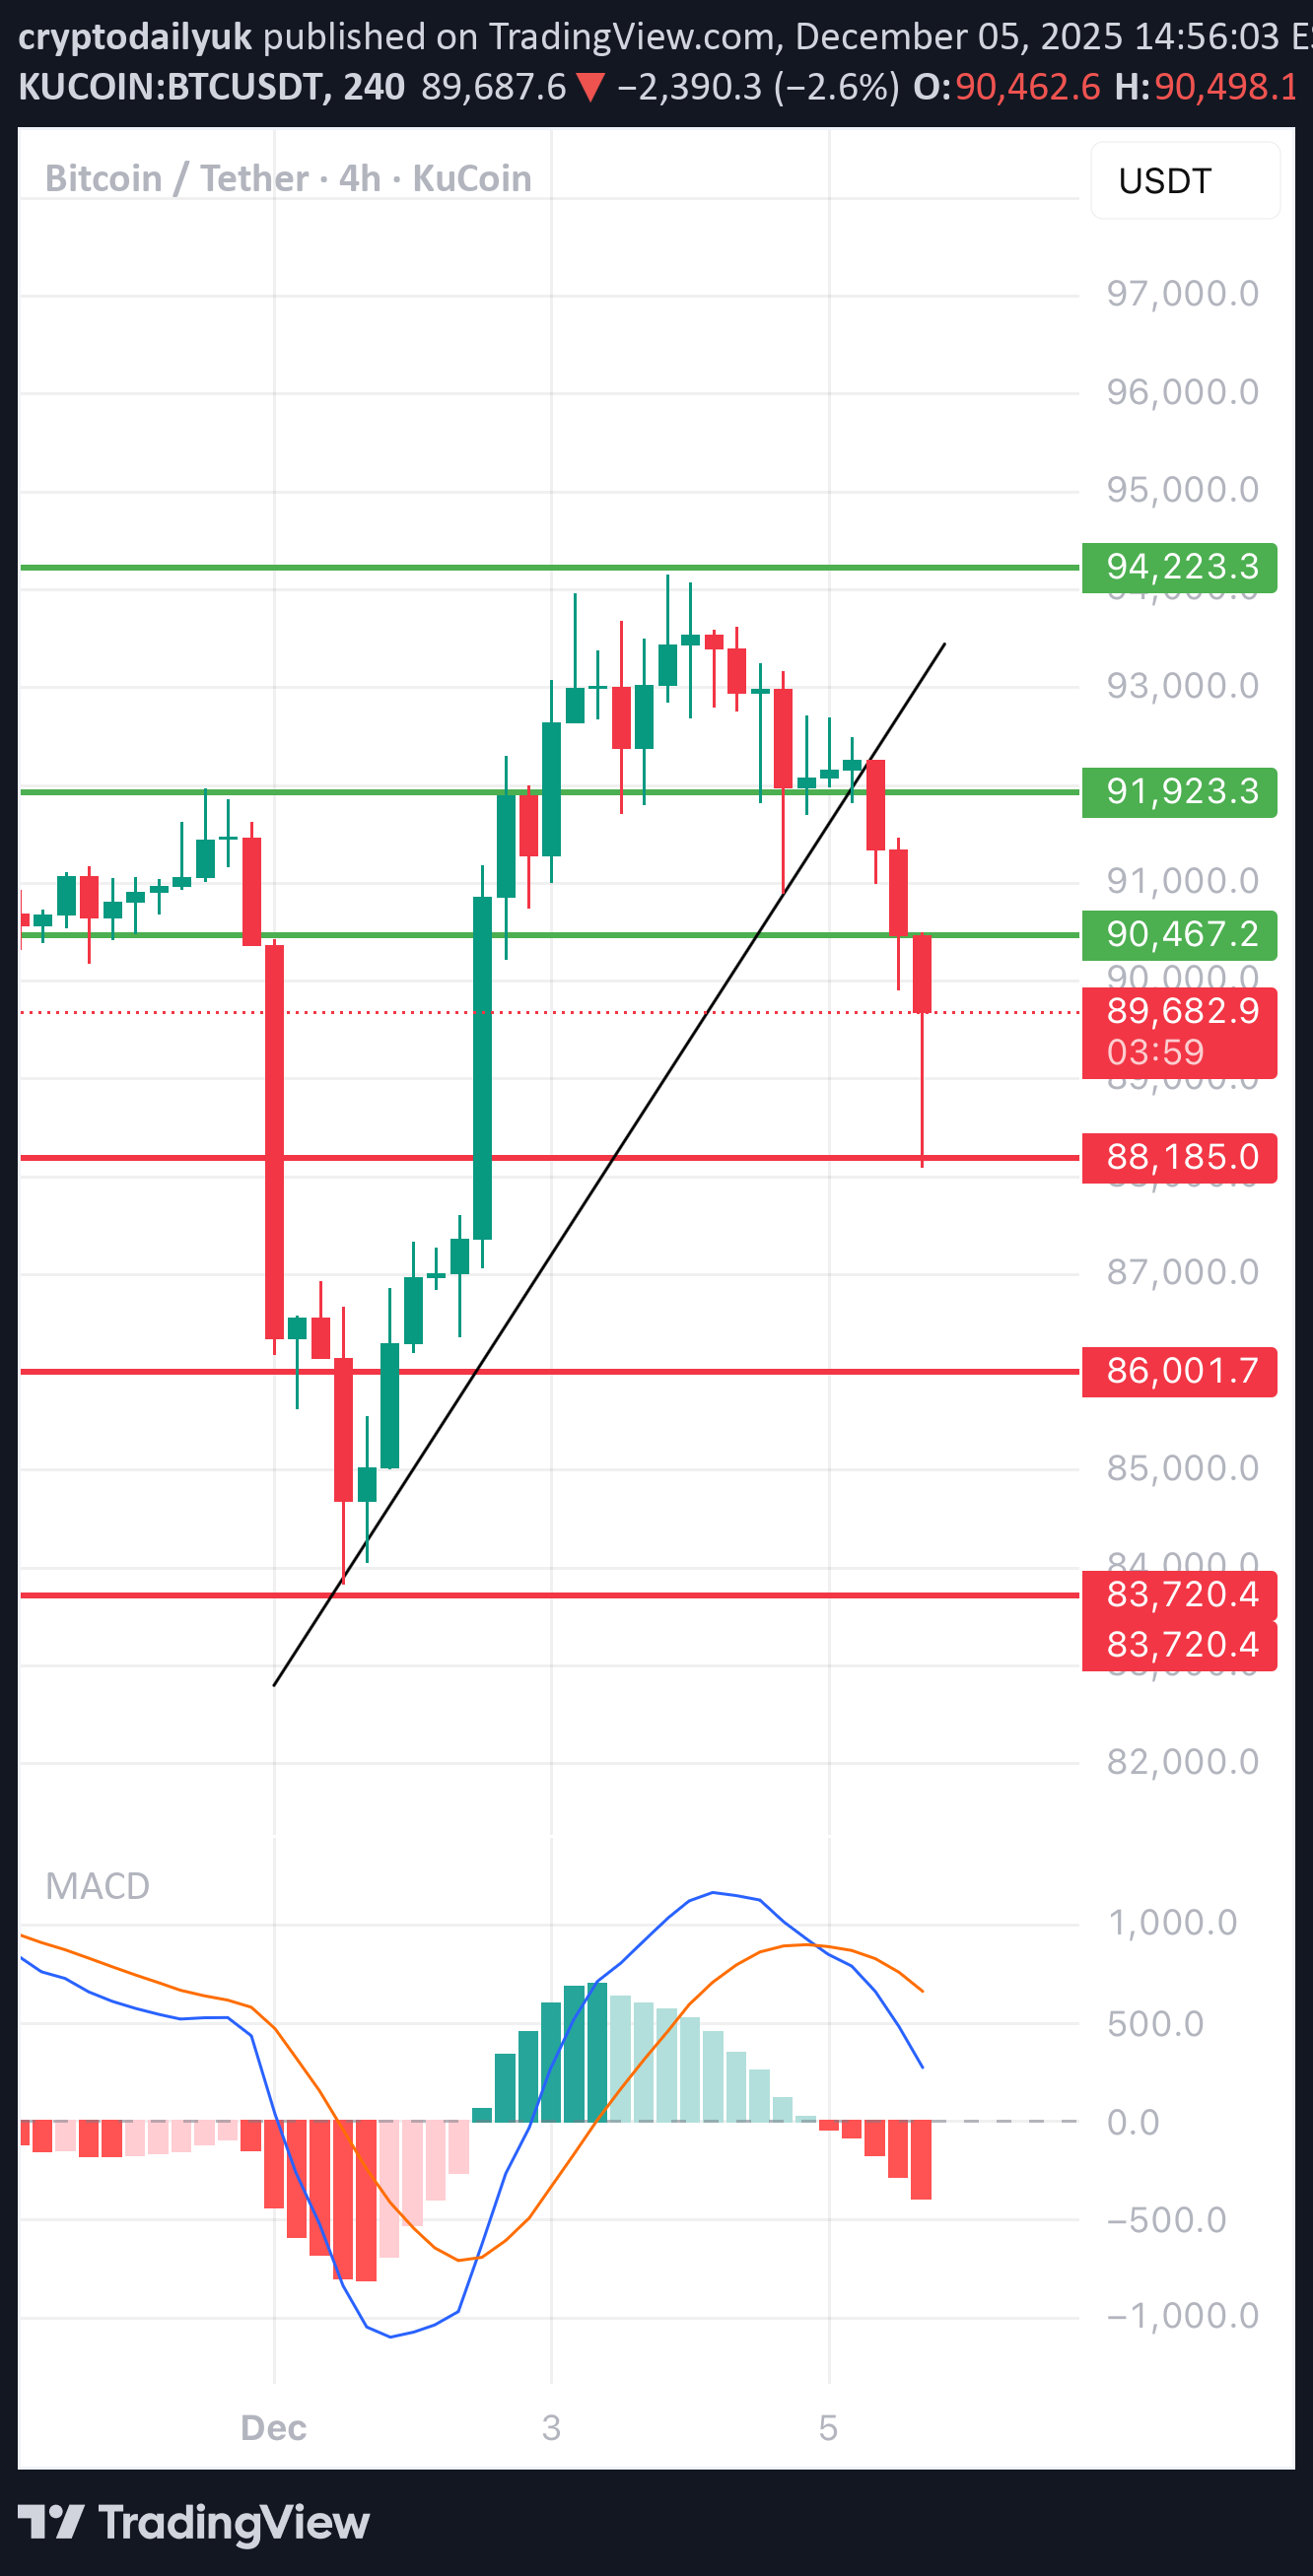
📉 1. Market structure – short-term 4H trend In the chart I see: • Breaking the upward trend line (black diagonal) – a classic signal of weakening momentum. • After the breakout, there was a quite strong downward impulse, which confirms that the intraday trend has turned bearish. • The price is currently testing around USDT 89,500-90,000, where a reaction is emerging, but not strong yet. 👉 Conclusion: 4H is now in a bearish correction and the market looks ready to test further lower supports. ⸻ 🧭 2. Support and resistance levels (from your chart) Upcoming supports: 1. 89,500–89,000 – the current level at which the market is trying to defend itself. 2. 88 185 – clear red line, first logical support lower. 3. 86,001 – next demand level, big candle from the past. 4. 83,720 – deeper support to which the market returns when there is great fear. The nearest resistances (which need to be recovered to return to growth): 1. 90,467 – first key resistance; now it will work as a "flip". 2. 91 923 – stronger resistance; This is where the declines began. 3. 94,223 - only breaking this level shows that the bulls are back. 👉 The market is currently sitting BELOW the key resistance of 90,467, so downward pressure is active. ⸻ 📉 3. Analysis of candles and price behavior • The last 4-6 candles are large red bodies, which shows the clear dominance of supply. • After the breakout of the trendline, there is no strong pullback - this means that the bears do not allow for a rebound. • The lower shadow on the last candle indicates buyer reaction, but no confirmation yet. 👉 If 89,500 is broken, a move to 88,185 is very likely. ⸻ 📉 4. MACD – negative signal MACD shows: • Bearish cross – the blue line crossed the orange line from above. • The histogram turns into red bars - the downward momentum is increasing. • MACD is below zero → confirmed downward trend in the 4-H interval. 👉 MACD confirms what we see on the chart: momentum is falling and a rebound is unlikely without consolidation.