Technical analysis by cryptodailyuk about Symbol BNB on 12/11/2025

cryptodailyuk
TECHNICAL ANALYSIS BNB/USDT
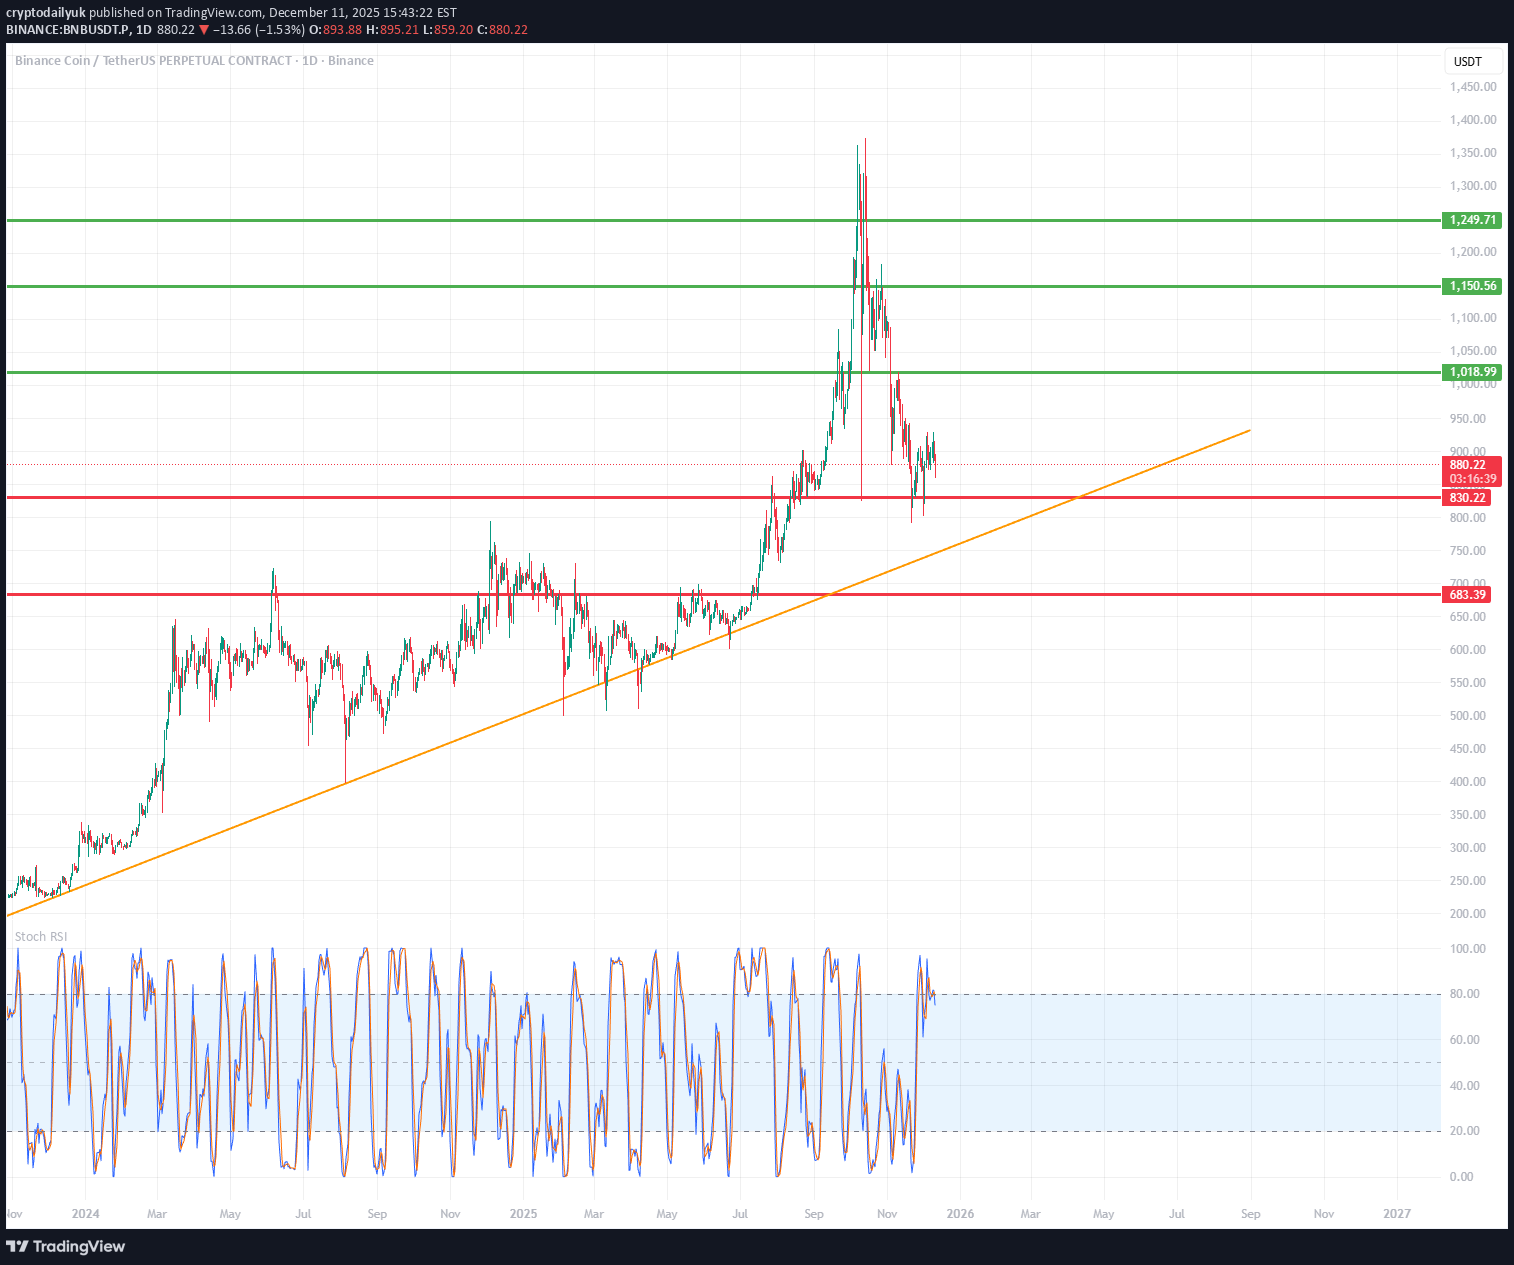
1️⃣ Market Structure and Trend The chart shows a long-term uptrend, confirmed by a very clean ascending trendline (orange), which has been acting as dynamic support for over a year. After a strong breakout to ~1380, the price began a correction but still hasn't broken the higher low structure → the uptrend is intact. 2️⃣ Key Levels (exactly from your chart) 🟢 Resistance Levels (green): ~1018 USDT ~1150 USDT ~1249 USDT These are potential targets for a renewed uptrend. 🔴 Support Levels (red): ~879 USDT – the closest important support ~838 USDT – a key defensive level ~683 USDT – deep support / last HTF trendline The price is currently trading directly above the first support level. 3️⃣ Trendline (orange) Your trendline is: strong, multi-point drawn on the D1 timeframe currently around 850–880 USDT ➡️ If the price falls, the trendline perfectly aligns with the 838–879 zone, strengthening this zone as a "must defend." 4️⃣ Oscillators – Stoch RSI (bottom) Currently: The oscillator is in a high zone (above 80) → indicating local overbought However, there is no clear downward crossover yet. Meaning: 👉 Upward momentum is still active, but we are closer to a local high than a low. 5️⃣ Scenarios 🟢 Upside scenario (more likely as long as the trendline holds) Condition: Maintaining the 879/838 levels and the trendline. Targets: 1018 USDT – first resistance 1150 USDT – important medium-term resistance 1249 USDT – main HTF target The longer the price consolidates above the orange trendline, the greater the chance of a renewed attack on 1150–1249. 🔴 Downside scenario (less likely, but crucial) Condition: Downside breakout of 838 USDT and closing of the D1 candle below the trendline. Then: the market could enter a deeper correction phase the target would be the 683 USDT level – this is also the main support level, where reactions were previously strong This is a "capitulation" scenario, but it doesn't seem to be dominant given the current price action. 6️⃣ What can we see on the chart "here and now"? ✔️ The price has rebounded from the local low ✔️ It is still between support at 879 and resistance at 1018 ✔️ The uptrend is intact ✔️ A potential HTF higher low has formed ✔️ The Stoch RSI shows momentum, but caution is warranted ➡️ The market is consolidating within the uptrend, with a high chance of a breakout upwards – provided support is maintained.