
amir9
@t_amir9

What symbols does the trader recommend buying?
Purchase History
پیام های تریدر
Filter
amir9
پیشبینی شگفتانگیز: آیا بیت کوین به ۴۷ هزار دلار بازمیگردد؟ (تکرار الگوهای تاریخی)

Bitcoin has always moved in repetitive cycles: a strong bull run, followed by a correction phase, and then starting a new rally from the lows. If we look at its price history, we can clearly see that these cycles repeat every few years with very similar patterns. Right now, Bitcoin is in a position that looks very similar to the past cycles. When we align these patterns, it suggests that another correction could be ahead. 🔹 In my opinion, based on these cycles, Bitcoin could see a deeper pullback over the next year and even drop to around $47,000. Of course, this is just a personal view based on past market behavior and not a guarantee — but history shows Bitcoin has repeated this path many times.
amir9
پیشبینی فوری اتریوم: آیا سقوط ادامه دارد یا منتظر شکست 4750 باشیم؟

Ethereum’s descending channel on the 4H timeframe is still valid, and the current momentum shows signs of potential bearish continuation. However, if the channel is broken to the upside and price stabilizes above 4750, the scenario will turn bullish, and we should start looking for long opportunities.
amir9
TON

The recent market structure shows the formation of a Quasimodo (QM) pattern. After breaking the descending trendline, price created a lower high followed by a slightly higher high, which is a typical signature of the QM setup. This pattern often signals a potential shift in market direction as liquidity is taken above previous highs before a new impulse move develops.
amir9
BTC 1H

On the one-hour chart, the market has been consolidating in a sideways range for some time, forming a clear box structure between support and resistance. Recently, price failed to break above the range and quickly rejected from the upper boundary, showing weakness from buyers. Now, the market is testing the lower boundary of the box. If the structure confirms a breakout to the downside, we could see a shift in momentum towards a bearish trend, with potential continuation after a possible retest of the broken support. This pattern represents a classic range-to-breakdown scenario, where prolonged consolidation often leads to a strong move once one side is taken out. What do you think: will the market respect the range again or are we about to see a confirmed bearish breakout?
amir9
BTC Bearish QM pattern

On the daily timeframe, Bitcoin is showing signs of forming a potential Quasimodo (QM) bearish pattern. Price has recently created a Lower Low (LL) after failing to sustain the bullish structure. The key supply zone lies around 119k – 122k, where we may see a liquidity grab and bearish rejection. As long as the market reacts to this resistance area with weakness, the first target for the downside is 108,300 USDT. A clear break below 108k could open the path towards deeper levels around 100k – 95k. For now, buyers are pushing price higher, but confirmation of a bearish reversal will only come after rejection from the blue zone. 📌 What do you think? Will BTC respect the QM setup and turn bearish from 119–122k, or will bulls push through the resistance?
amir9
DOT Daily
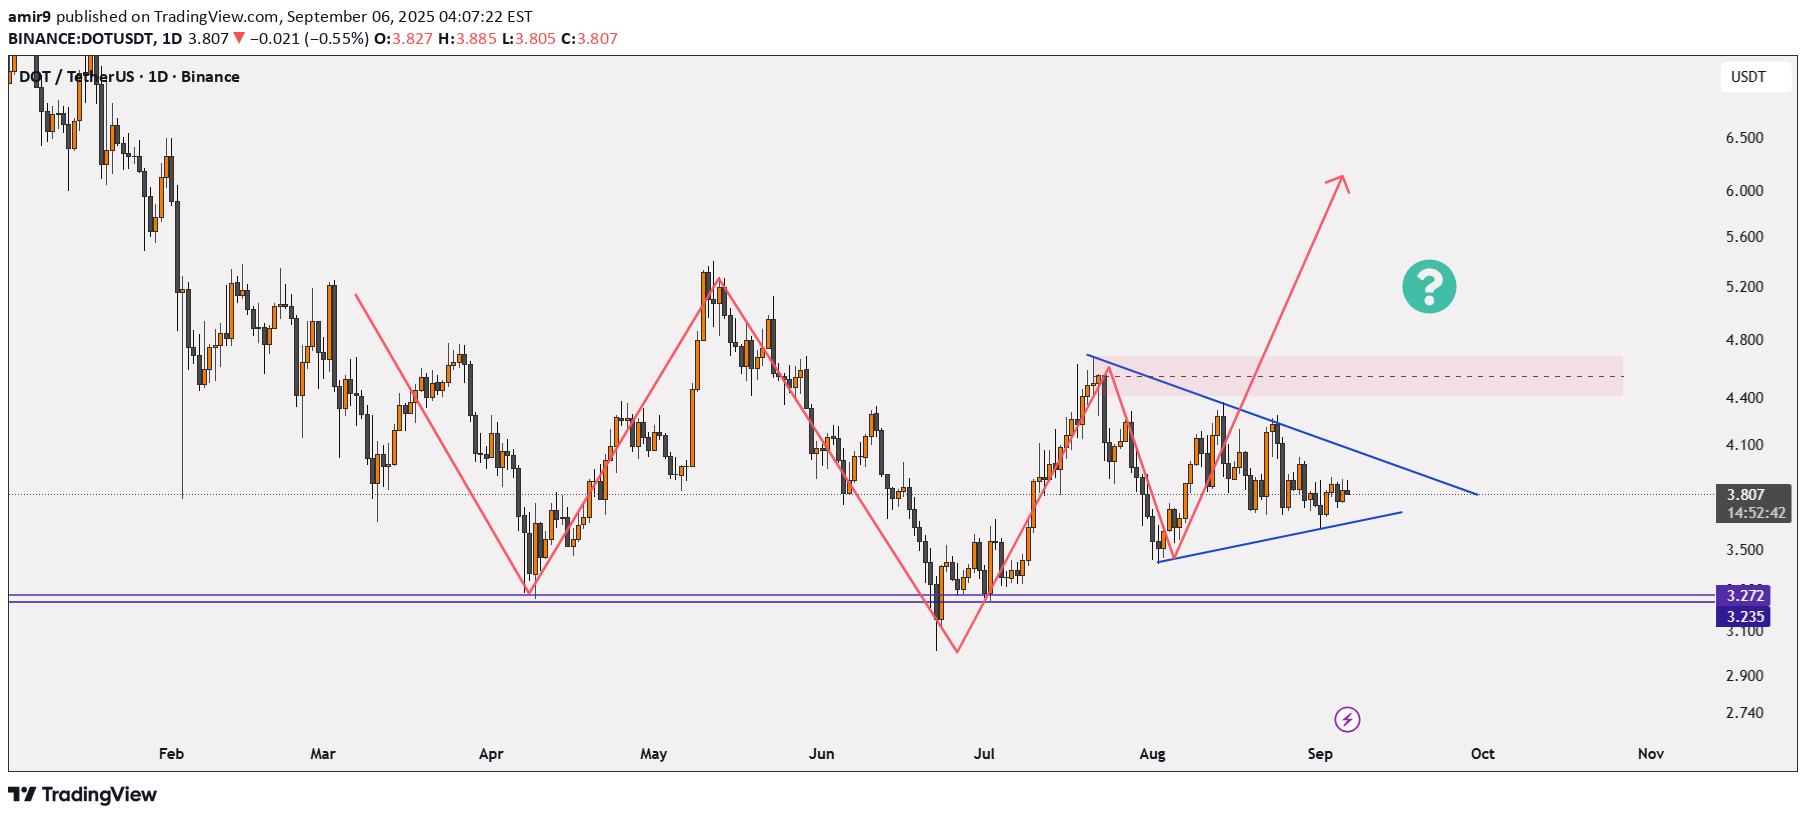
After a strong downtrend, the price has stabilized around the 3.23 – 3.27 support zone, showing several bullish reactions from this area. Recently, the price action has formed a Symmetrical Triangle structure, meaning volatility is tightening and energy is building up for a breakout. The key resistance lies in the 4.40 – 4.65 zone (pink box), which could be the first target if the triangle breaks to the upside. A breakout above the descending trendline (upper side of the triangle) with rising volume may signal the start of a strong bullish move. On the other hand, if the triangle support and the 3.23 level are lost, the price may continue lower toward 3.00 and possibly 2.75. The current Symmetrical Triangle can act as either a continuation or a reversal pattern, depending on the breakout direction. Given the recent bullish reactions at support and the market’s defense of the 3.2 zone, the probability of an upward breakout seems slightly higher. ❓ Do you think this triangle pattern could be a signal for a new bullish rally in DOT?
amir9
BNB weekly
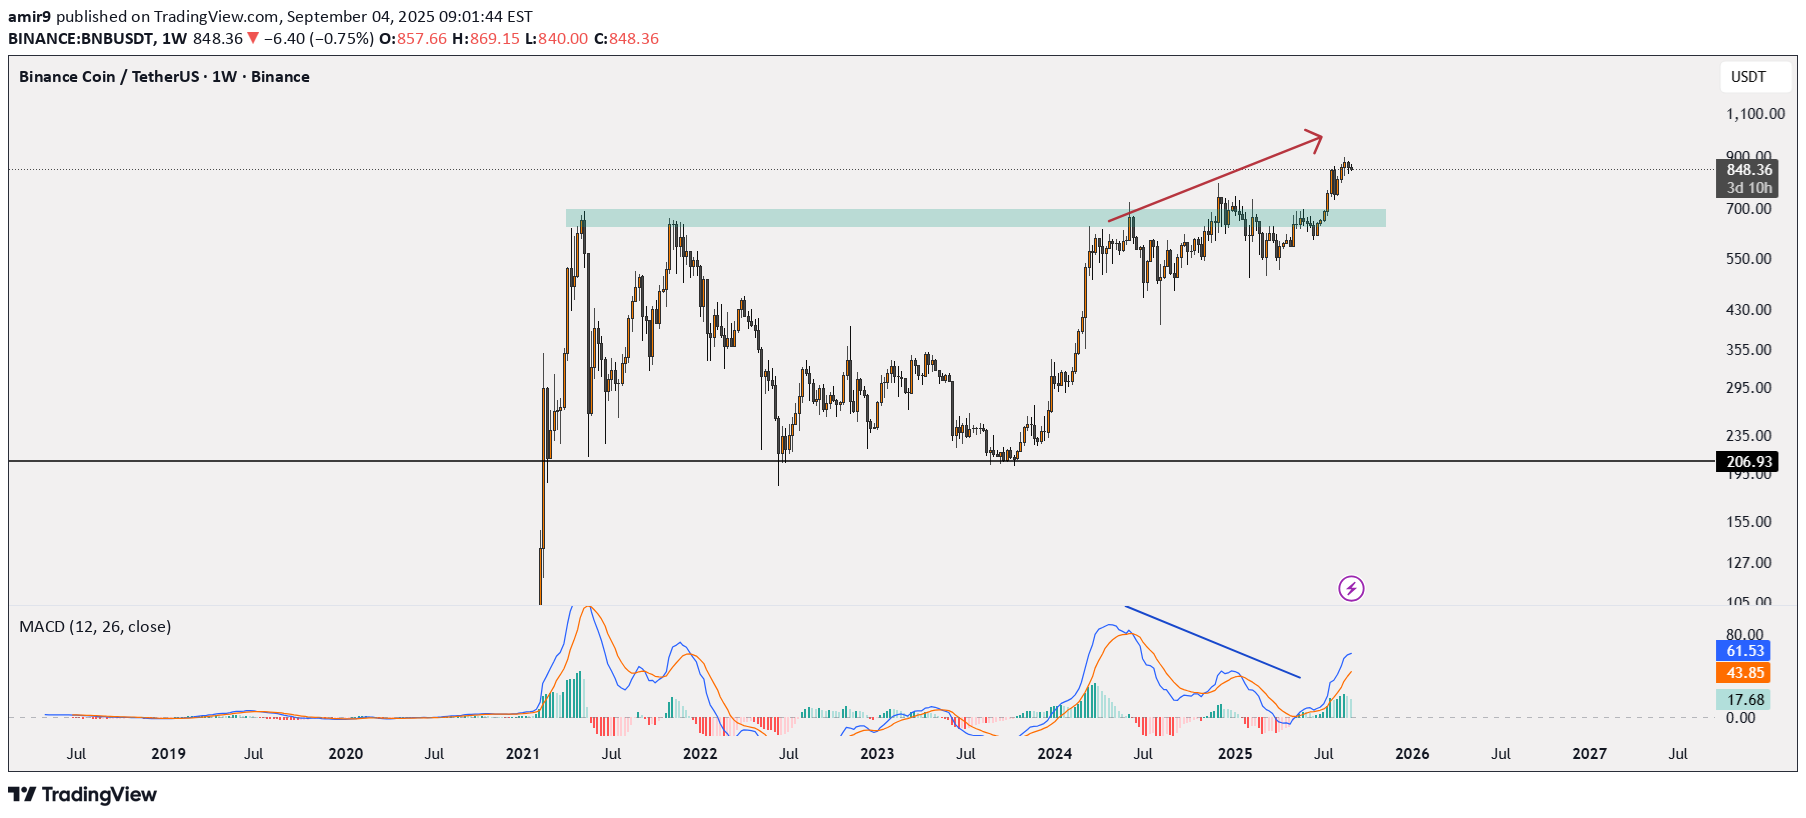
BNB is in an uptrend on the weekly timeframe and has broken above the key $700 resistance. However, a bearish divergence on the MACD signals a potential correction. Key support: $700 – Next resistance: $1,100. Overall trend remains bullish, but a pullback may occur before further upside.
amir9
AVAX 4H
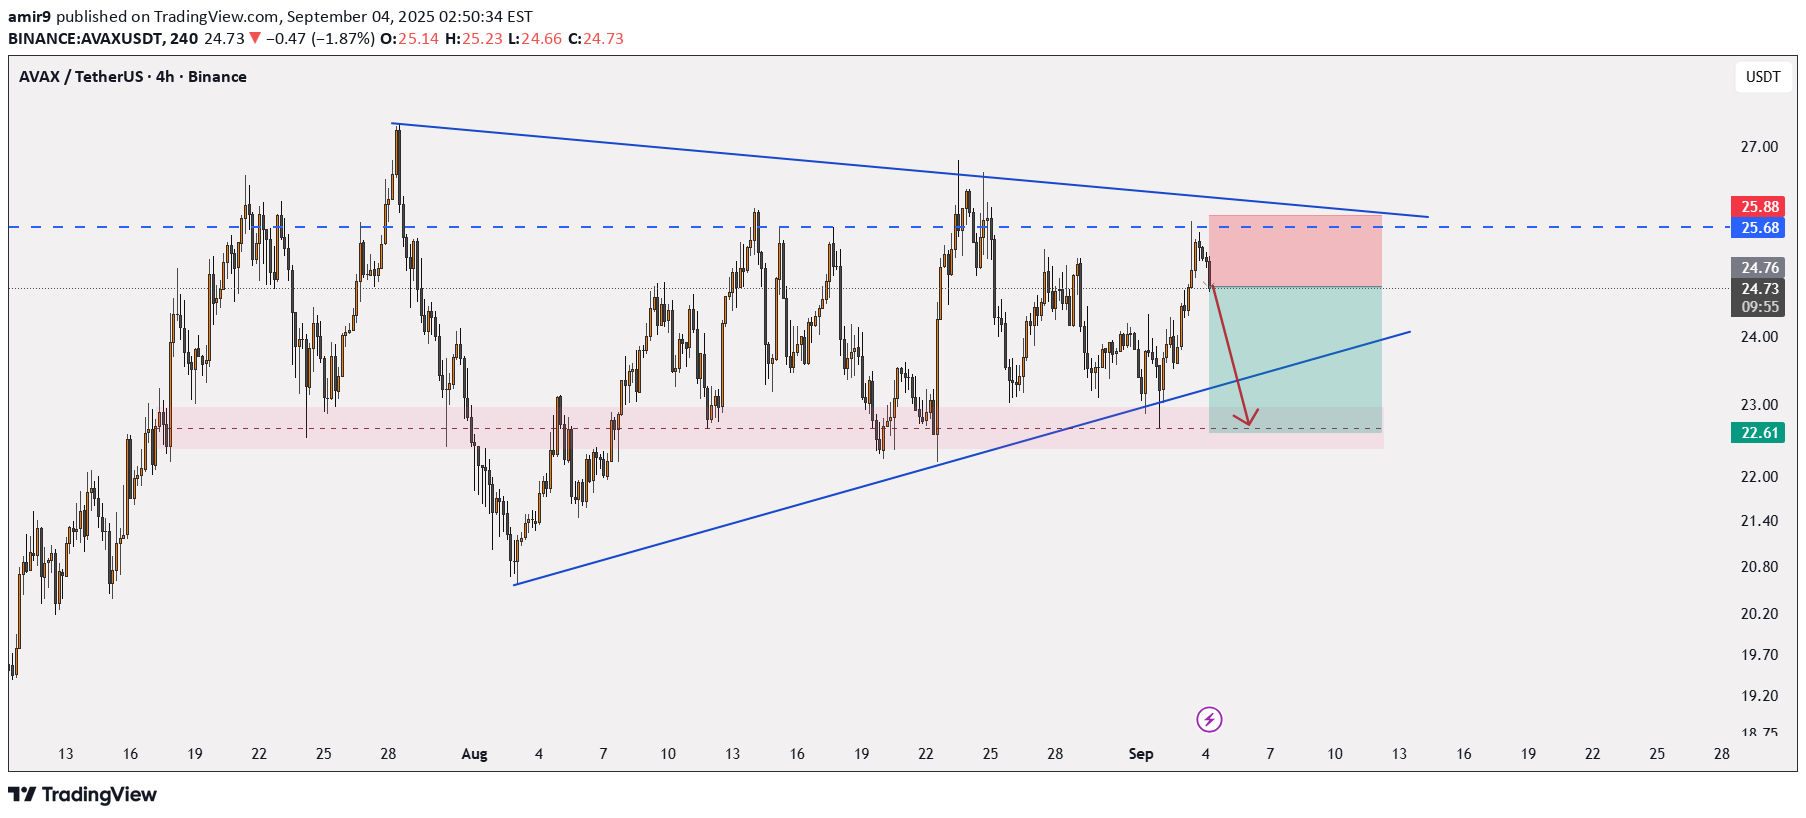
AVAX is currently trading within a symmetrical triangle pattern, reflecting market indecision as lower highs and higher lows continue to form. This consolidation indicates that the market is preparing for a strong directional move. Recently, price faced rejection near the upper boundary of the triangle, showing signs of seller pressure, while the rising trendline below is still acting as support. This setup suggests that the next breakout will likely define the trend. ✅ In a bullish scenario, a breakout above resistance would confirm buyer strength and could trigger a continuation of the upward move. ❌ On the bearish side, if price breaks below the ascending support, sellers may take control and drive the market back toward the bottom of the triangle, opening room for further downside. Overall, AVAX is in a critical decision zone, and traders should be prepared for both scenarios—long entries on a confirmed breakout to the upside, or short opportunities if the lower trendline fails.
amir9
XRP 4H Pattern
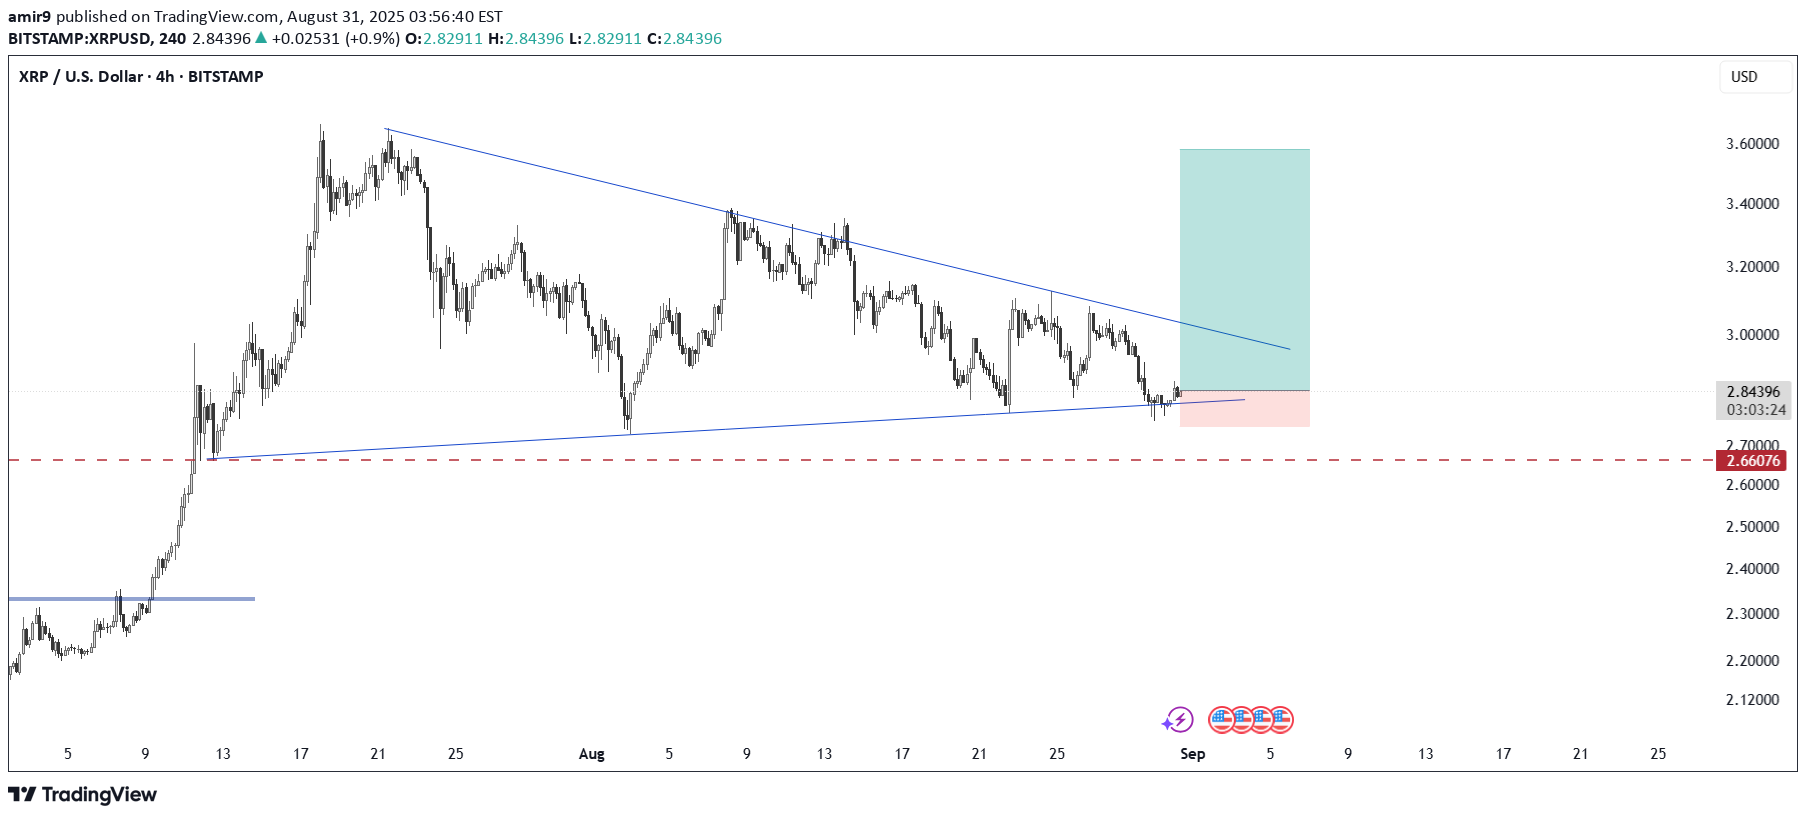
XRP is currently consolidating within a symmetrical triangle pattern, with price action forming lower highs and higher lows. This indicates a period of compression where volatility is decreasing, and a potential breakout could be approaching. At the moment, the price is testing the lower boundary of the triangle, showing signs of support. As long as XRP holds above the $2.66 support level (highlighted by the dashed red line), the bullish scenario remains valid. Pattern: Symmetrical Triangle (continuation/neutral pattern) Entry Zone: Current support trendline near $2.18–$2.20 Stop Loss: Below $2.66 support zone Target Zone: $3.40 – $3.60 (upper projection of the triangle) 📌 A confirmed breakout above the descending trendline could trigger strong bullish momentum, while a breakdown below $2.66 would invalidate this setup and open the door for deeper correction.
amir9
Solana Daily
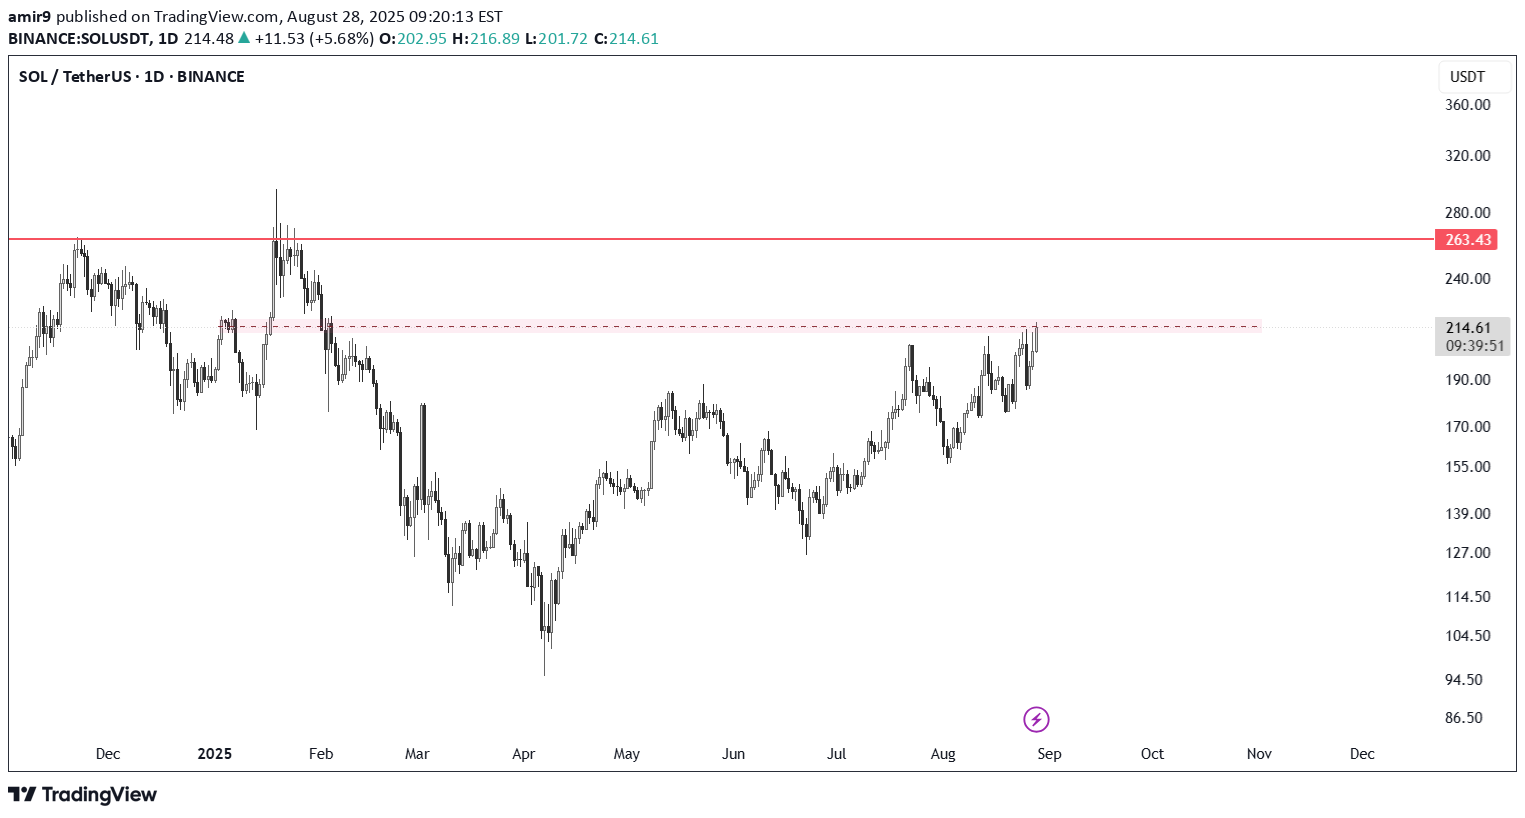
Price is currently trading around $214, right below a strong resistance zone near $230–$235. In the past, this level acted as supply, pushing the price down. The chart shows a short setup with a stop loss above resistance and a target around $130, which is the next strong support area. In simple terms: If the price fails to break above $230, it could drop towards $130. If it breaks and closes strongly above $230, the bearish setup becomes invalid, and the next resistance is around $263. This setup is based on the idea that price is retesting an important resistance after a big rally.
Disclaimer
Any content and materials included in Sahmeto's website and official communication channels are a compilation of personal opinions and analyses and are not binding. They do not constitute any recommendation for buying, selling, entering or exiting the stock market and cryptocurrency market. Also, all news and analyses included in the website and channels are merely republished information from official and unofficial domestic and foreign sources, and it is obvious that users of the said content are responsible for following up and ensuring the authenticity and accuracy of the materials. Therefore, while disclaiming responsibility, it is declared that the responsibility for any decision-making, action, and potential profit and loss in the capital market and cryptocurrency market lies with the trader.