Technical analysis by amir9 about Symbol DOT on 9/6/2025

amir9
DOT Daily
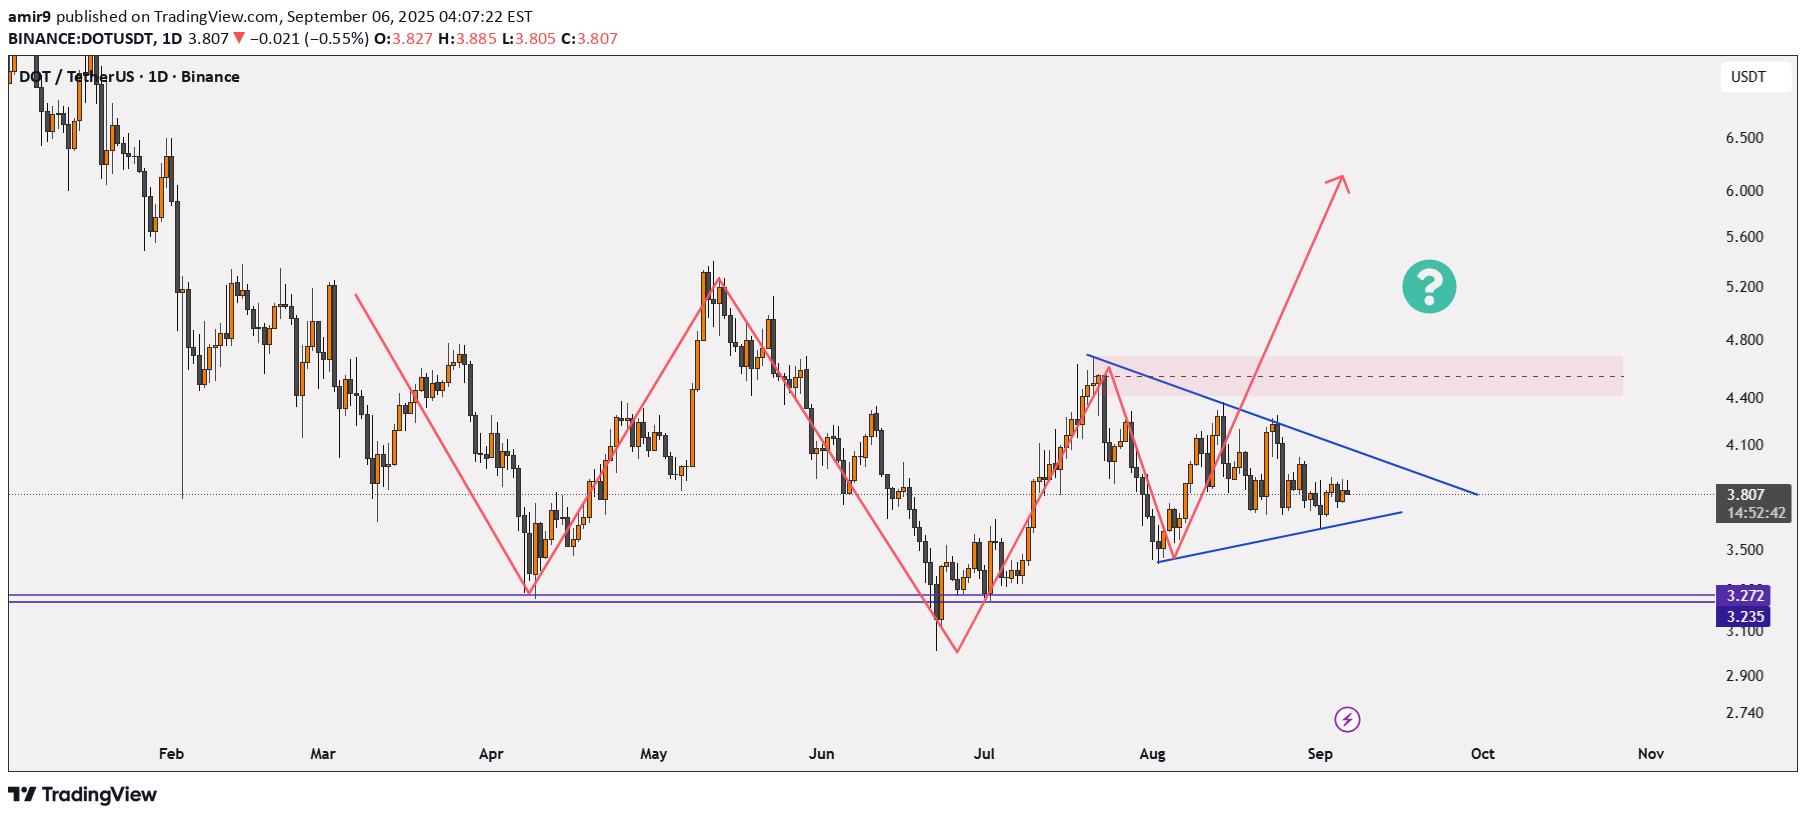
After a strong downtrend, the price has stabilized around the 3.23 – 3.27 support zone, showing several bullish reactions from this area. Recently, the price action has formed a Symmetrical Triangle structure, meaning volatility is tightening and energy is building up for a breakout. The key resistance lies in the 4.40 – 4.65 zone (pink box), which could be the first target if the triangle breaks to the upside. A breakout above the descending trendline (upper side of the triangle) with rising volume may signal the start of a strong bullish move. On the other hand, if the triangle support and the 3.23 level are lost, the price may continue lower toward 3.00 and possibly 2.75. The current Symmetrical Triangle can act as either a continuation or a reversal pattern, depending on the breakout direction. Given the recent bullish reactions at support and the market’s defense of the 3.2 zone, the probability of an upward breakout seems slightly higher. ❓ Do you think this triangle pattern could be a signal for a new bullish rally in DOT?