
WaveFibs
@t_WaveFibs

What symbols does the trader recommend buying?
Purchase History
پیام های تریدر
Filter
WaveFibs
پیشبینی دقیق قیمت اتریوم (ETH/USDT) تا سال ۲۰۲۵: نقشه راه موج الیوت و فیبوناچی
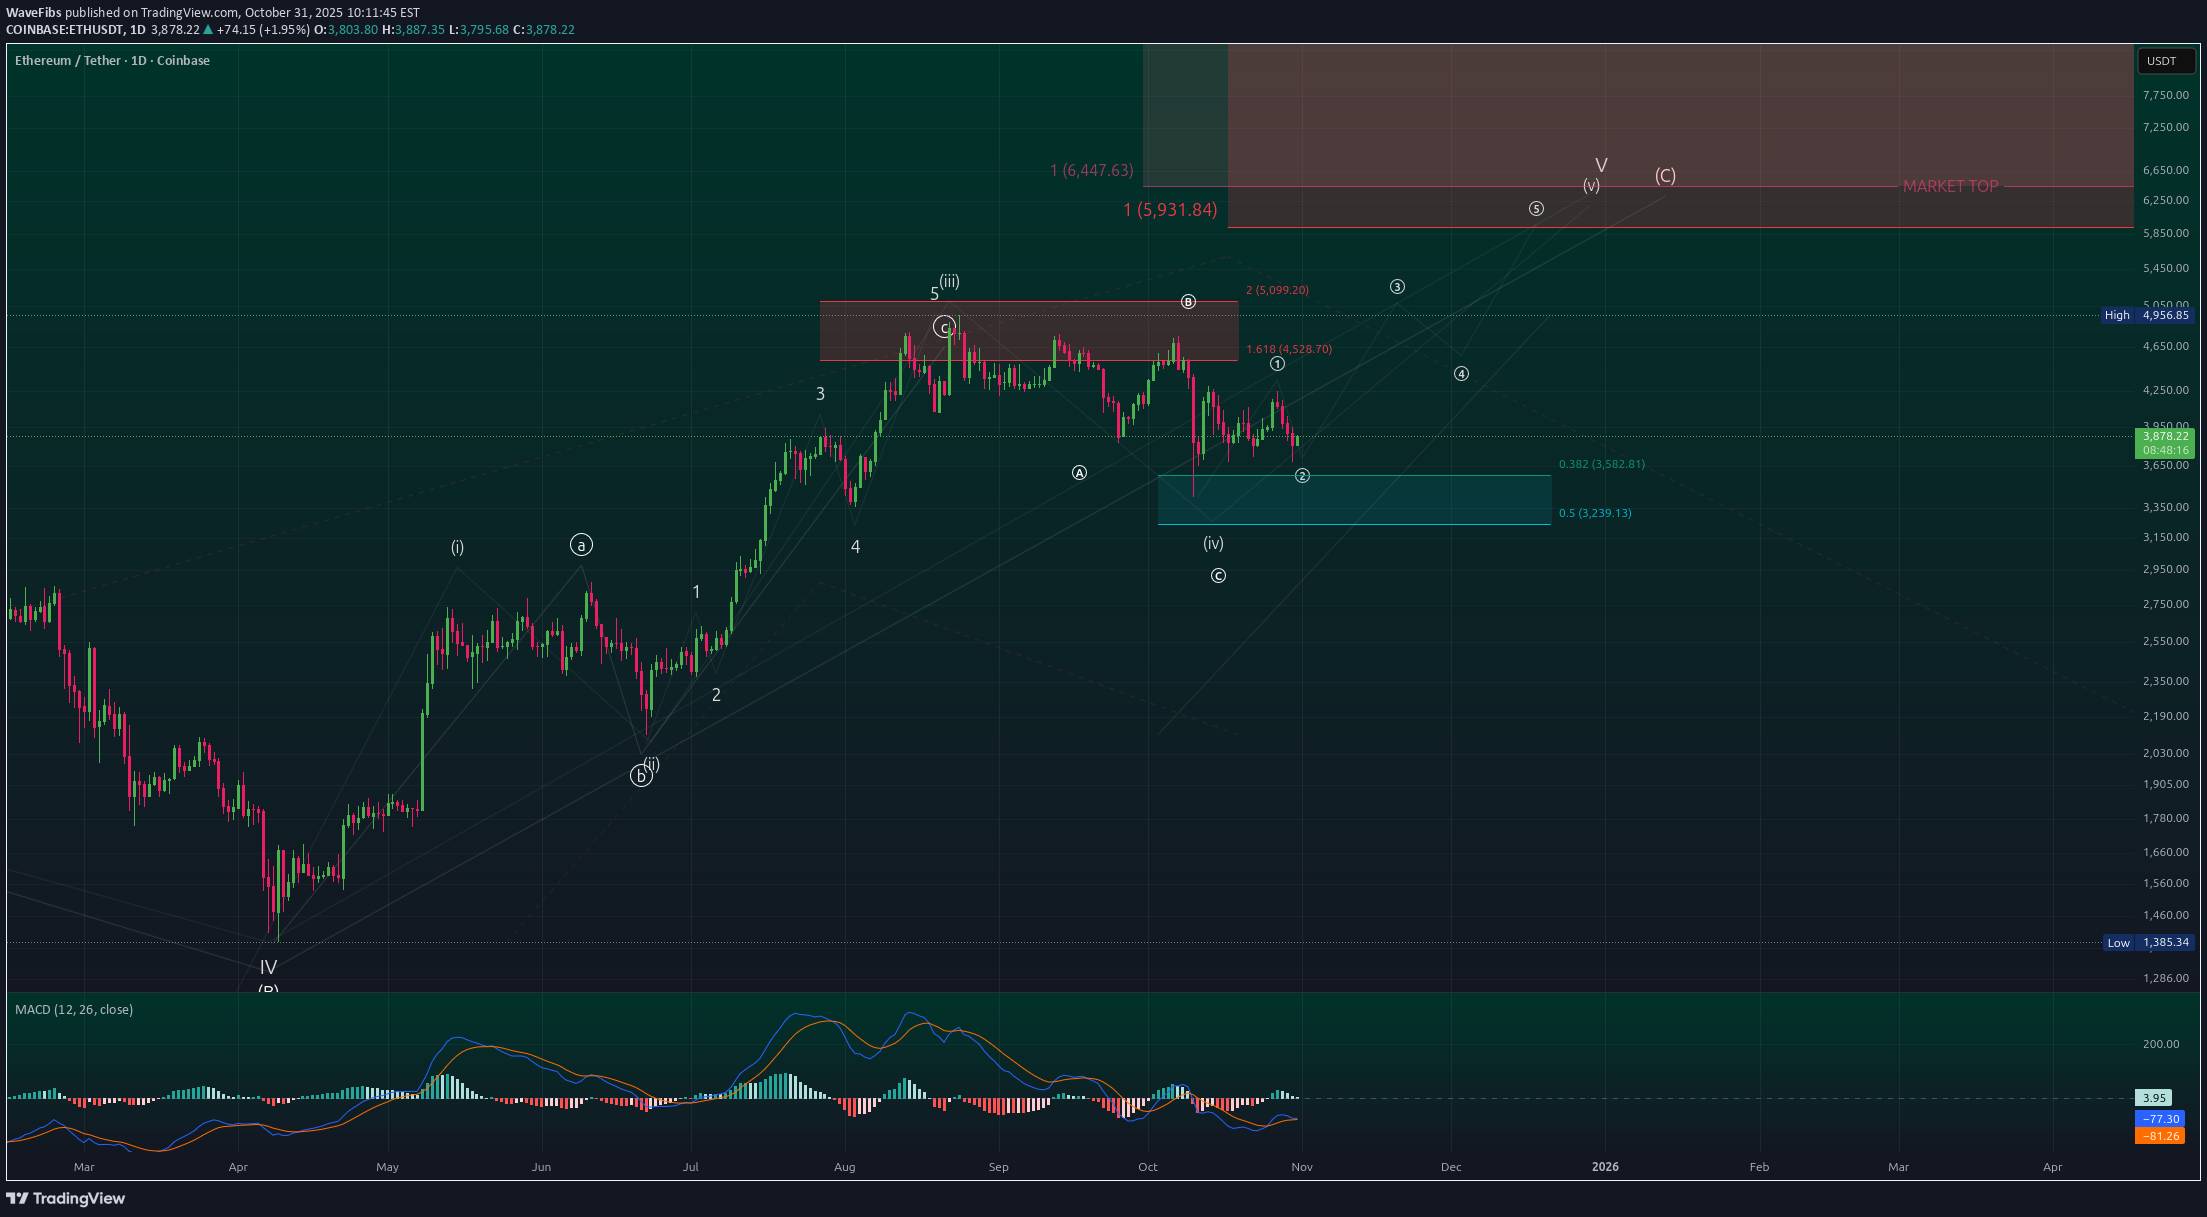
ETH/USDT — Comprehensive EW & Fib Roadmap **Structure:** From the **Jun ’22 bear-market low → Mar ’24** forms **A/3**; **Apr ’25** prints **B/4**. Since April we’re advancing in **daily Wave C**, now focusing on **(iv)–(v)** completion toward terminal levels. This continues my earlier public idea/thread on ETH’s multi-degree terminal advance. --- 1) Multi-timeframe context * **Primary count:** Weekly corrective **A–B–C** from ATH with the current leg = **Wave C**. Within it, daily is progressing to finish **Wave (v) of C** (terminal risk once complete). Core EW rules/guidelines (no W2 > 100% of W1; W3 not the shortest; W4 typically avoids W1 territory; alternation) frame the count and invalidations. ( [en.wikipedia.org] [2]) * **Fibonacci basis:** Using standard retracement/extension clusters (0.382/0.5 retraces; 1.618/2.0 extensions) for targets and pullback zones. --- 2) 2025 zoom-in (from the Apr ’25 **B/4** low) * We have a completed **(i)–(iii)** push into the **Aug ’25 high ≈ $4,956** (marked **Wave 3** on the chart). * **Wave (iv)** most likely **bottomed 10 Oct ’25 ≈ $3,429**, landing in the blue retrace box (**0.382 ≈ $3,575**; **0.5 ≈ $3,233**). * From that low, price carved a fresh **1–2** to the upside → launching pad for **③ of (v)** toward terminal targets (bearish reversal risk once (v) completes). *(All levels and labels are taken from the provided chart screenshots.)* --- 3) Confluence zones & path to completion * **Resistance pivots from prior swings:** **1.618 ≈ $4,528.7** then **2.0 ≈ $5,099**. * **Terminal target cluster for (v) of C:** * **$5,900** (first box edge), * **$6,447** (upper confluence), * **$8,731** (stretch/throw-over if momentum overshoots). These align with typical EW/Fib projections for a terminal wave; diagonals often end with throw-overs and sharp reversals thereafter. --- 4) Risk management & invalidation * **Structure invalidation of the immediate 1–2→3:** sustained break **below $3,200–$3,180** (beneath 0.5 box & October spike-low context) = defer (v) and expect a deeper/complex (iv). * **Momentum tell:** A push into the $5.9k–$6.45k band with fading momentum/divergence would fit terminal behavior; diagonals frequently reverse hard after completion. --- 5) Alternate (lower-probability) * If price closes **below $3,429** and holds, treat the current advance as incomplete corrective work; wait for a **new 1–2** before re-engaging on the long side. (Rule-based posture per EW hard rules/guidelines.) --- ## Trade Idea (non-advice; execution-ready) **Bias:** Long the **1–2** base for a run into the terminal cluster, then de-risk into strength. **Entry (Option A — pullback ladder):** * **$3,575 → $3,233** (0.382–0.5 “blue box”). Scale in 3–4 tranches. **Entry (Option B — confirmation add):** * Add on decisive **daily close > $4,529** (1.618 pivot) targeting the $5.1k box next. **Stop / Invalidation:** * Hard stop **$3,180** (beneath the 0.5 box & Oct spike low). Re-assess if hit. **Targets / Scale-out plan:** * **T1:** **$5,100** (2.0 ext / prior resistance). * **T2:** **$5,900** (terminal box edge). * **T3:** **$6,447** (upper confluence). * **Stretch:** **$8,731** only if momentum remains strong (take partials aggressively; diagonals can “throw-over” then snap back). ( [TradingView] [1]) **Position sizing & management:** * Risk **≤1–2%** of equity per idea; trail under higher lows once price converts **$4,529** to support; aggressively reduce above **$5.9k** if momentum divergences appear. ( [Elliott Wave International] [4]) --- Reference / Continuation This analysis continues my prior ETH terminal-advance roadmap on TradingView; review for the higher-timeframe diagonal context and publishing notes. ( [TradingView] [1]) --- Disclosure Educational analysis only; **not financial advice**. Risk per trade **≤ 1–2%**.
WaveFibs
نقشه راه بیت کوین: اهداف قیمتی، خطوط بحرانی کانال و سناریوهای احتمالی صعود و نزول

Bitcoin — comprehensive update: late-trend ladder, potential 4→5, and channel targets Thesis BTC is advancing inside a rising Elliott channel from the 2022 low. Late in an impulse, wave-5 often terminates near the channel’s upper line (sometimes with a brief throw-over), while momentum divergences frequently appear as higher highs print with weakening oscillators. That combination frames the next weeks: respect channel boundaries for upside targets and require price confirmation for any reversal. Structure map (what the channel says) Channeling guideline: after wave-4 is identified, draw a trendline 2→4 and run a parallel through 3 to project the likely wave-5 termination zone; many 5s end at, or just beyond, this upper boundary. Throw-over risk: a brief penetration of the upper line by wave-5 can precede a major reversal; treat it as terminal unless acceptance above the channel holds on retest. Levels (prices on the map) Upside decision ladder — current impulse extensions 1.618 → $126,738 (typical wave-3 target; first decision/scale zone) 1.786 → $128,767 (often tags in strong legs) 2.000 → $131,398 (common wave-5 equality/overthrow checkpoint) Acceptance through the full ladder shifts focus to the next confluence. (Use standard Fib extension practice from the last clear base.) Stretch / confluence above 0.618 higher-degree cluster → ~$139,205 (popular profit-taking/reassessment area in crypto trends). Dynamic channel guidance Rising median of the 2022-anchored channel ≈ $150k now; linear projection implies ~$156k–$160k if contacted ~4 weeks later, depending on slope. Median/upper lines often act as magnets/termination rails late in trends. Momentum/diff checklist (confirmation logic) Bearish divergence = price higher high with RSI/MACD lower high → a warning of trend fatigue; treat as context and wait for price triggers (e.g., break of the last higher low). Throwback behavior after upward breakouts is common; a retest that holds often resumes the uptrend. Do not assume failure unless support breaks. Scenarios & exact triggers (including the “possible 4 → another 5” path) A) Wave-3 at 1.618, then a real wave-4, then final wave-5 (classic) Path: Pause/roll at $126,738–$131,398 → corrective wave-4 (shallow to moderate) → renewed push for wave-5 toward $139,205 and potentially the channel upper/median. Triggers: Wave-4 confirmation = loss of the last HL on execution TF (1h/4h) without breaking larger uptrend structure. Wave-5 confirmation = reclaim of broken level + momentum re-acceleration. B) No meaningful 4 yet → direct press to 2.0 and stretch Path: Clean acceptance above $131,398 (2.0) with no fresh divergence → $139,205; if momentum persists, risk of throw-over into the channel’s upper line; then monitor throwback retest. Triggers: Daily/3D closes through $131,398 with strengthening MACD/RSI, then alert at $139,205 for profit-taking and reversal risk management. C) Divergence rejection at the ladder → truncated/short 5 Path: Price prints marginal HH into $126,738–$131,398 while RSI/MACD make LH → rejection → 5-down on 15m/1h → measured pullback toward 23.6–38.2% of the advance; larger reassessment thereafter. Triggers: Bearish divergence plus break of the last HL and failure on retest (confirmation over anticipation). Risk management (mechanical, level-driven) Into $126,738 / $128,767 / $131,398: scale partials or hedge; if fading, hard stops above the spike-high to avoid terminal 5 squeezes. On acceptance → $139,205: trail under prior HLs; expect a throwback and treat it as continuation unless structure fails. On confirmed reversal: first targets = 23.6–38.2% retrace of the leg; deeper moves require fresh evidence. One-screen summary (for the Idea caption) Decision ladder: $126,738 → $128,767 → $131,398. Stretch box: $139,205; beyond that, channel median/upper (~$150k now; $156–160k if tagged weeks later). Bull path: acceptance above the ladder with rising momentum → box/rail; manage throwback. Bear path: divergence + HL break at the ladder → 23.6–38.2% reset. Channeling and throw-over/throwback guidelines support these outcomes
WaveFibs
تحلیل کامل شکست قیمتی ریپل (XRP): نقشه راه 2 روزه برای سودآوری

XRP — Breakout Playbook (Weekly Context + 2-Day Execution, With Divergences & Wave Map) 1) Market position (where price sits now) Price is compressing beneath a descending trendline and just under a horizontal range ceiling after a strong upside impulse. The prior pullback held inside the mapped support box (approx. 2.85–2.64 on the chart), keeping the higher-timeframe up-leg viable. 2) Momentum state & divergences Now (2-Day): Regular bullish divergence printed into the box: price made an equal/lower low while the MACD histogram made a higher low. This signals seller fatigue into support and raises the odds that a valid break can sustain if participation appears. Anticipated (near resistance): Regular bearish divergence risk is elevated into 4.46–4.60 and again near 5.05. Expect momentum to lag if the move matures; divergence there often precedes a reaction. On the throwback: a successful retest frequently forms hidden bullish divergence (price makes a higher low while momentum makes a lower low). That pattern supports the “acceleration” phase. 3) Wave roadmap (now → next) Primary count on the breakout path The current advance is mapped as micro A–B–C, with C ≈ A (1:1) clustering in the 4.46–4.60 band; a higher-hierarchy objective resides around 5.05. After the first clean break, the standard path is: Wave 1 up through the ceiling → Wave 2 throwback to retest the broken trendline/ceiling → Wave 3 extension targeting 4.46–4.60, with potential continuation toward 5.05 if momentum holds. What qualifies the Wave-2 retest Pullback respects the former cap (trendline/ceiling acts as support). The reaction back up shows volume expansion and improving momentum. The Wave-2 low stays above the Wave-1 origin (structure intact). 4) Breakout qualification (must see both) Close through the cap and range high on the 2-Day. Participation: volume clearly above recent average on the break. → After that, a weekly close that holds above the level promotes the move from tactical to structural. 5) Path after confirmation (scenarios) Base scenario — continuation with throwback Break → throwback to the breakout line (common) → hold → acceleration. Wave-3 behavior: broad bars, rising participation, momentum improving. Targets by confluence on the chart: 4.46–4.60 (equality/congestion band) = first reaction zone. ~5.05 = higher decision area; expect a larger battle there. Alternate bullish — deeper retest first If the breakout wicks and fails to stick on the first attempt, a deeper retest into the upper half of the support box can still resolve higher, provided weekly structure remains intact and momentum rebuilds. Bearish/failed break Pop above resistance without volume, followed by a close back inside the range = false breakout risk; immediate de-risk and await a fresh setup. A new closing low below ~2.64 (box floor) breaks the structure of the current weekly idea. 6) Risk, invalidation, and management Tactical invalidation (post-break): a 2-Day close back under the reclaimed level on rising volume. Structural invalidation: weekly close back inside the prior range after confirmation, or loss of the most recent weekly higher low. Stop logic: trail beneath successive 2-Day swing lows during the advance; after weekly confirmation, management can widen to weekly swings to respect higher-TF trend. Profit handling: expect churn and potential bearish divergence at 4.46–4.60; partials are reasonable there. If momentum/volume remain constructive, leave a runner toward ~5.05. 7) Execution checklist (pin next to the chart) 2-Day close above the descending cap and the horizontal ceiling ✅ Volume expansion on the breakout bar(s) ✅ Weekly close holds above the break ✅ Throwback: test of former cap; holds as support ✅ Wave-3 tells after the retest: broader candles, improving momentum, higher participation ✅ Zones to manage: 4.46–4.60 (reaction/divergence risk), then ~5.05 (bigger decision). Failure tells: quick close back in range, retest breaks down, or fresh weekly lower low → stand down.
WaveFibs
VIRTUAL/USDT — Elliott Wave + Fibonacci Roadmap (1D)

# Virtuals Protocol / USDT (MEXC) — Daily ## Bullish divergence at Wave ⑤ of C into the 0.5–0.786 pocket → building a 1–2 base for upside (targets 6.33 / 9.79 / 19.80) **Timeframe:** 1D | **Exchange:** MEXC ### Summary * Daily **A–B–C** correction looks **complete/near-complete**: sub-wave **C** subdivides into **5 down** with price making a **lower low** while momentum makes a **higher low** → **bullish divergence** between **③ and ⑤** at the bottom. * Price is testing the **retracement box**: **0.5 ≈ 1.0311**, **0.618 ≈ 0.8299**, **0.786 ≈ 0.6093**. * Base case: this area finalizes **Wave 2** → next is **impulsive Wave 3** up if lows hold. * **Macro extensions from the chart:** **1.000 = 6.3306**, **1.236 = 9.7859**, **1.618 = 19.8044**. * **Cycle invalidation:** take out the labeled **Low 0.4110** → 1–2 thesis off. ### Why I’m bullish here 1. **Structure:** Clear **5-down into C** with the **⑤ tag at the low** inside your yellow box → textbook terminal action for a corrective wave. 2. **Momentum:** MACD/oscillator prints **higher low** while price makes a marginal **lower low** from sub-wave **③ → ⑤** → **bullish divergence** right at support. 3. **Location:** Reversal attempt begins **inside the 0.5–0.786 retrace band** (≈ **1.0311 → 0.6093**), the classic **Wave-2** completion zone. ### Trade Plan (scenarios) **A) Aggressive long (DCA in the pocket)** * **Zone:** Accumulate across **0.618–0.786 (0.8299–0.6093)** if retested/swept. * **Risk:** Hard **invalidation below 0.4110** (structural low on the chart). * **Management:** First relief target back into **0.5–0.382** (**1.0311 → 1.2811**) to pay yourself, then let runners ride. **B) Conservative confirmation** * Wait for a **clean 5-up from the low and a shallow 3-down** that holds **above 0.618 (0.8299)**. If it prints, that’s your **1–2** trigger for **Wave 3**. ### Targets * Step-ups: **1.000 = 6.3306** → **1.236 = 9.7859** → **1.618 = 19.8044** (macro objectives once a daily uptrend is confirmed). * Near-term reaction levels on the way: **0.382 = 1.2811**, **0.5 = 1.0311**. ### Invalidation & risk * **Lose 0.4110** with acceptance → **cycle invalid**; stand aside and reassess. * **Risk per trade ≤ 1–2%**. Place the stop first, size second. If volatility widens, reduce size — don’t expand risk. --- **Disclosure** Educational analysis only; **not financial advice**. Crypto is highly volatile. **Risk per trade ≤1–2%**.
WaveFibs
ETH/USD – Multi-Degree Terminal Advance: Daily ⑤ of C
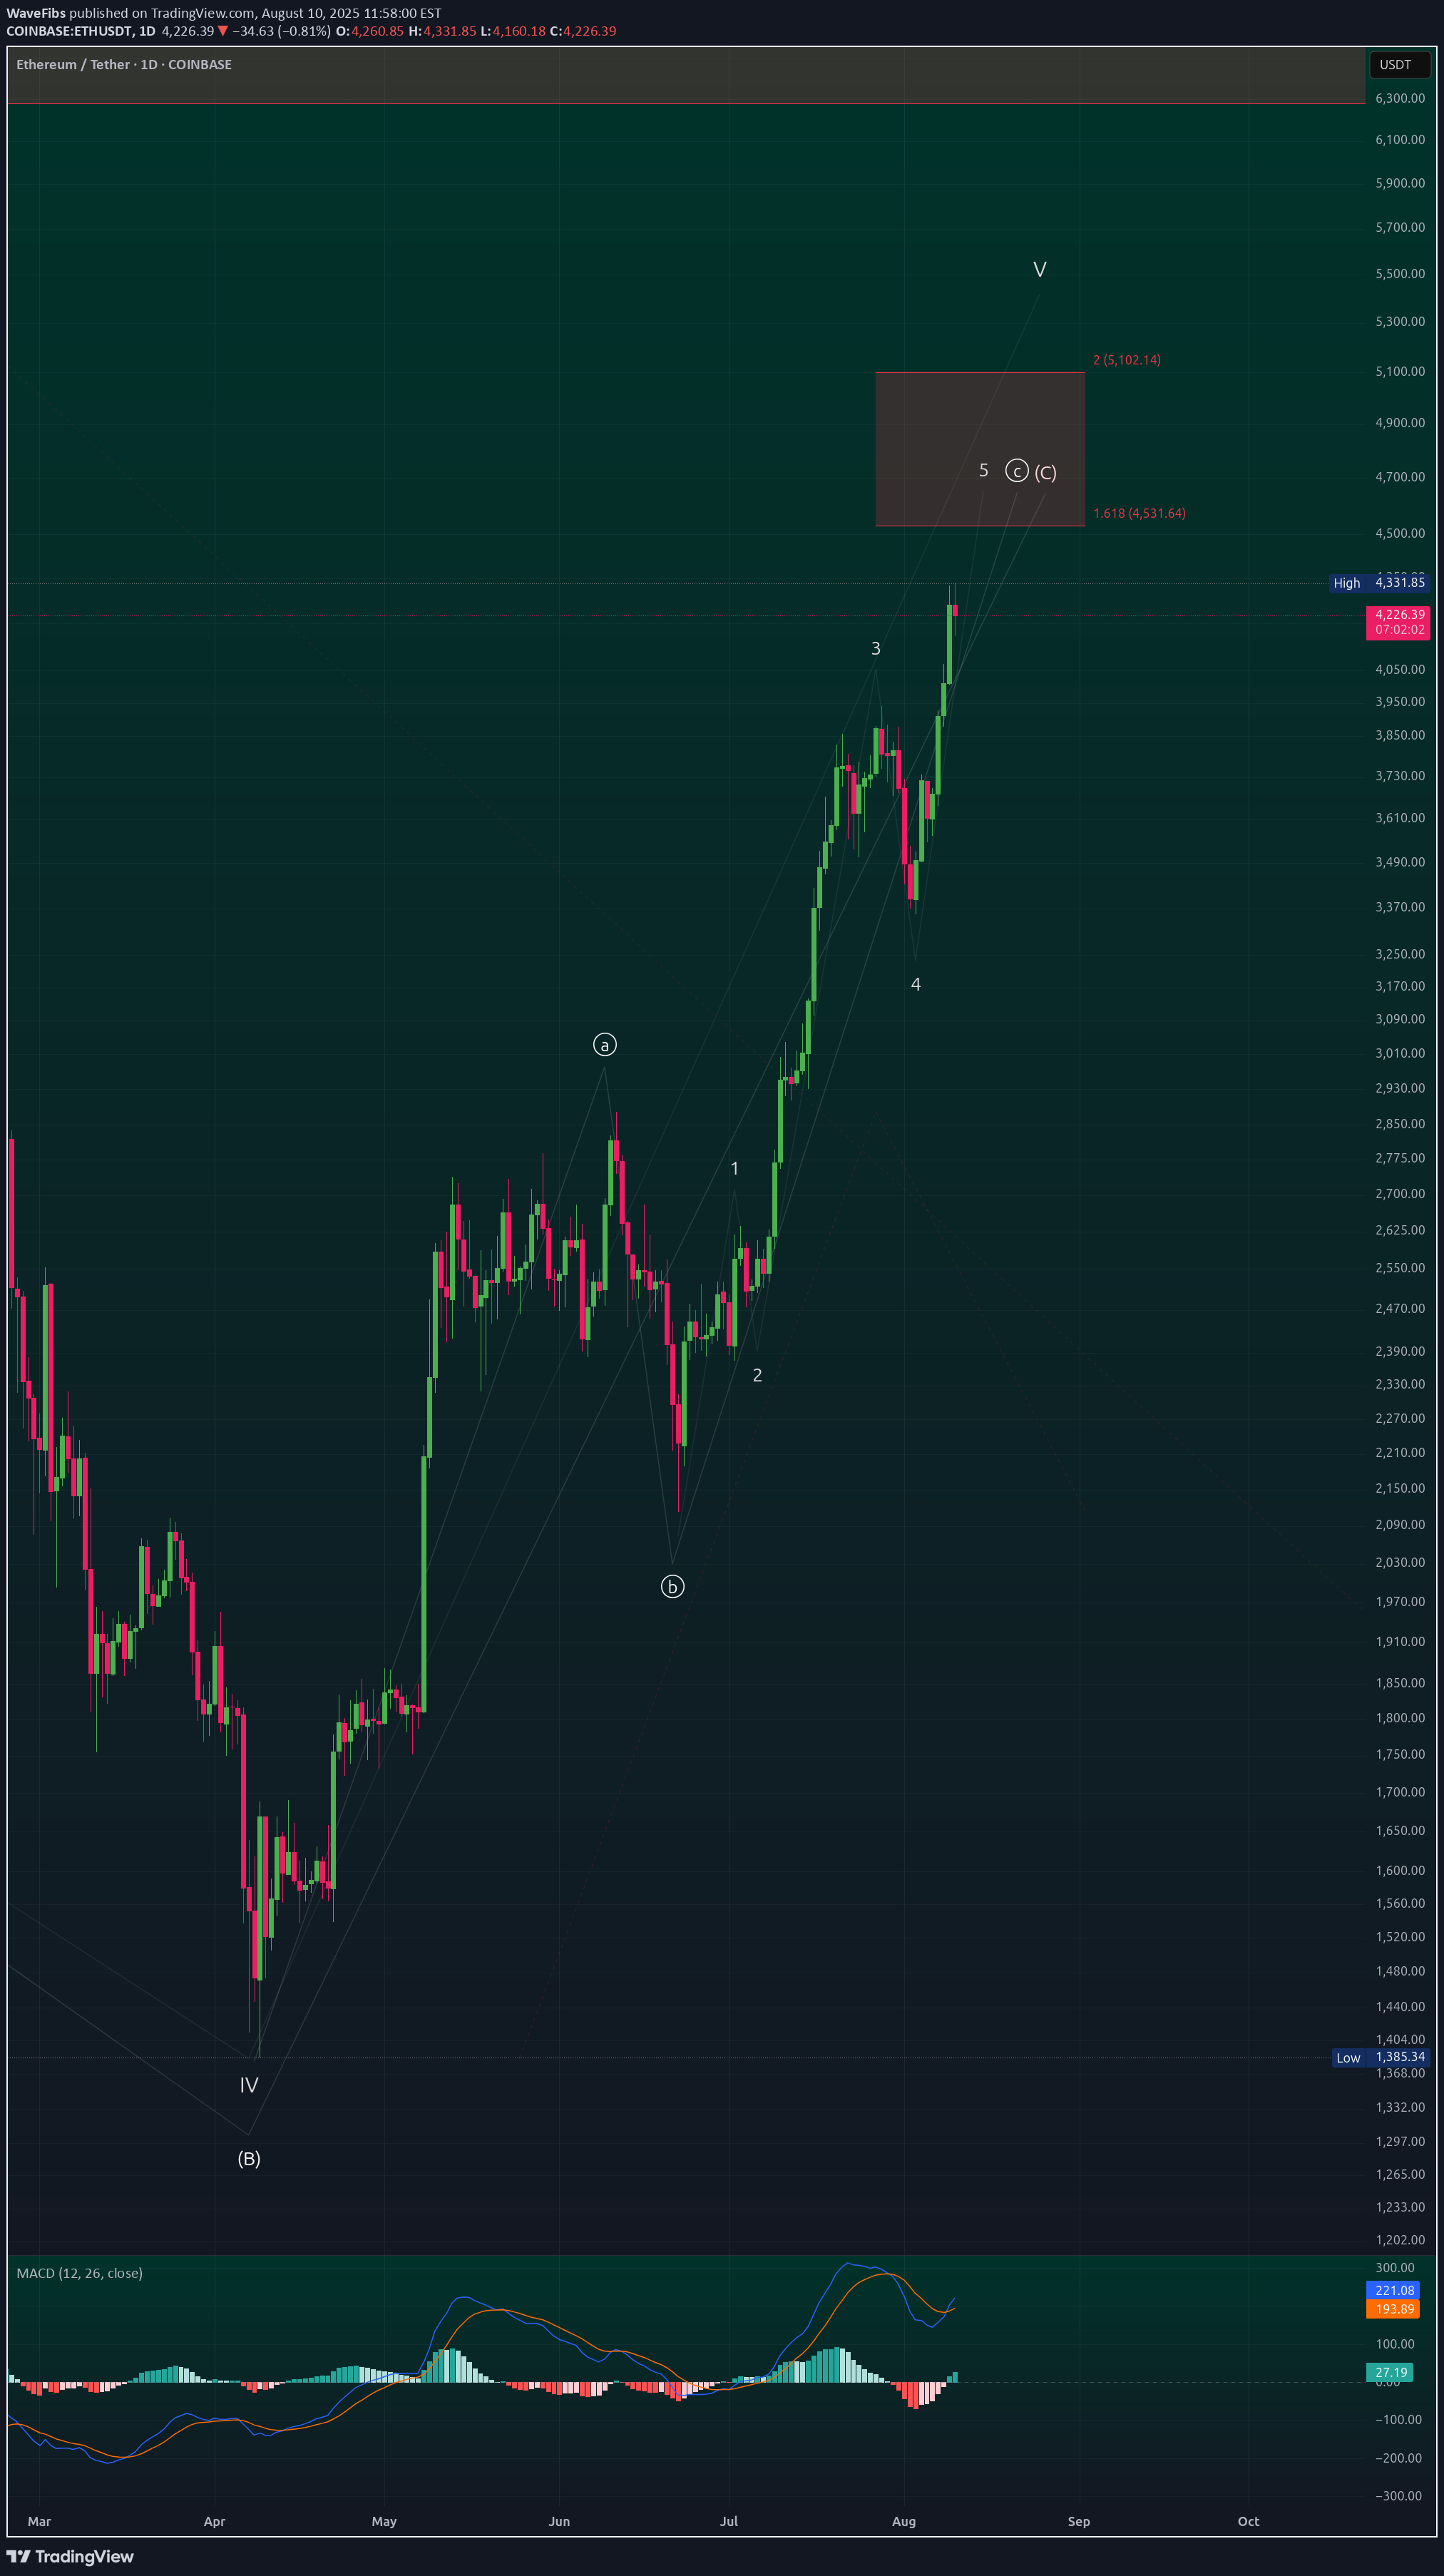
ETH/USDT – Multi-Degree Terminal Advance: Daily Wave ⑤ of C Inside Weekly Wave C (Ending Diagonal) 1️⃣ Higher-Timeframe Context (Weekly) ETH has been unfolding a large corrective A-B-C structure from the all-time high. The current rally is Wave C of that correction. Structural note: On the weekly, Wave 4 overlaps Wave 1 → violates standard impulse rules → the entire Wave C is taking the form of an Ending Diagonal. Why this matters: Ending diagonals appear in terminal positions (Wave 5 of an impulse or Wave C of a correction). They often end with a throw-over above the upper trendline, followed by sharp and deep reversals. 2️⃣ Intermediate-Timeframe Context (Daily) On the daily, we are in: Wave ⑤ of daily Wave C. That daily Wave C is also the final leg of weekly Wave C. Implication: Two degrees (daily & weekly) are scheduled to terminate together → high-probability major turning point. 3️⃣ Structure & Internal Wave Count From the IV(B) low in April, ETH has advanced in five overlapping sub-waves: Wave 1 – steady breakout leg. Wave 2 – shallow pullback. Wave 3 – strongest rally to date. Wave 4 – pullback overlapping Wave 1 territory → confirms diagonal. Wave 5 – ongoing final push into target zone. Internals of each wave show a-b-c formations, consistent with diagonal rules. 4️⃣ Fibonacci Target Confluence Anchor: IV(B) low → Wave 3 high → Wave 4 low 1.618 extension: $4,531 → first resistance. 2.000 extension: $5,102 → primary target. Upper wedge projection / throw-over: $5,500–$5,650. These levels also align with weekly fib projections for Wave C → creating a multi-timeframe resistance cluster. 5️⃣ Momentum & Divergence MACD (Daily): Histogram making lower highs while price makes higher highs → early bearish divergence. RSI (Daily & Weekly): Approaching overbought with flattening momentum → consistent with terminal phases. Volume: Gradual contraction during the advance; watch for final spike on throw-over. 6️⃣ Scenarios A) Terminal Top Scenario (Base Case) Price completes Wave ⑤ of C inside the $4,531–$5,102 box. Possible throw-over into $5,500–$5,650 on ETF hype. Followed by swift rejection back inside wedge → break of Wave-4 low confirms top. Targets after confirmation: First: Wedge base / 0.382 retrace (~$3,800). Next: 0.5 retrace (~$3,500). Extended: Origin of diagonal (~$2,900). B) ETF Extension Scenario Price consolidates above $5,100 and pushes toward $5,500–$5,650. Still part of Wave ⑤, just a stretched terminal before reversal. Same confirmation rules: break of Wave-4 low validates reversal. 7️⃣ Invalidation & Risk Levels Bearish invalidation: Break of Wave-4 low = high-probability top. Bullish invalidation: Sustained breakout + consolidation above $5,650 would require re-evaluating the diagonal scenario. 8️⃣ Trade Plan (Non-Advice) Aggressive fade: Short into $4,531–$5,102, add near $5,500–$5,650 if reached, stop above wedge throw-over. Conservative: Wait for daily close back inside wedge and break of Wave-4 low, then short pullbacks. Positioning note: Size down in diagonals — volatility spikes at turns. 9️⃣ Key Chart Annotations for Publishing Wedge trendlines from Wave-II(B) low to Wave-IV(B) low. Label 1–2–3–4–5 (with a-b-c internals) on daily. Highlight $4,531, $5,102, and $5,500–$5,650 zones. Mark Wave-4 low and wedge base with "Top Confirmed Below Here". Add MACD/RSI divergence notes in top-right. 📌 Summary ETH is in the final stages of a multi-degree ending diagonal: Daily Wave ⑤ of C inside Weekly Wave C. Both degrees likely terminate in $4,531–$5,102, with throw-over potential to $5,500–$5,650. Once confirmed, expect a fast, deep retrace — this is a terminal pattern with macro top potential.
WaveFibs
Bitcoin – “topping-zone” update, grounded in the play-book
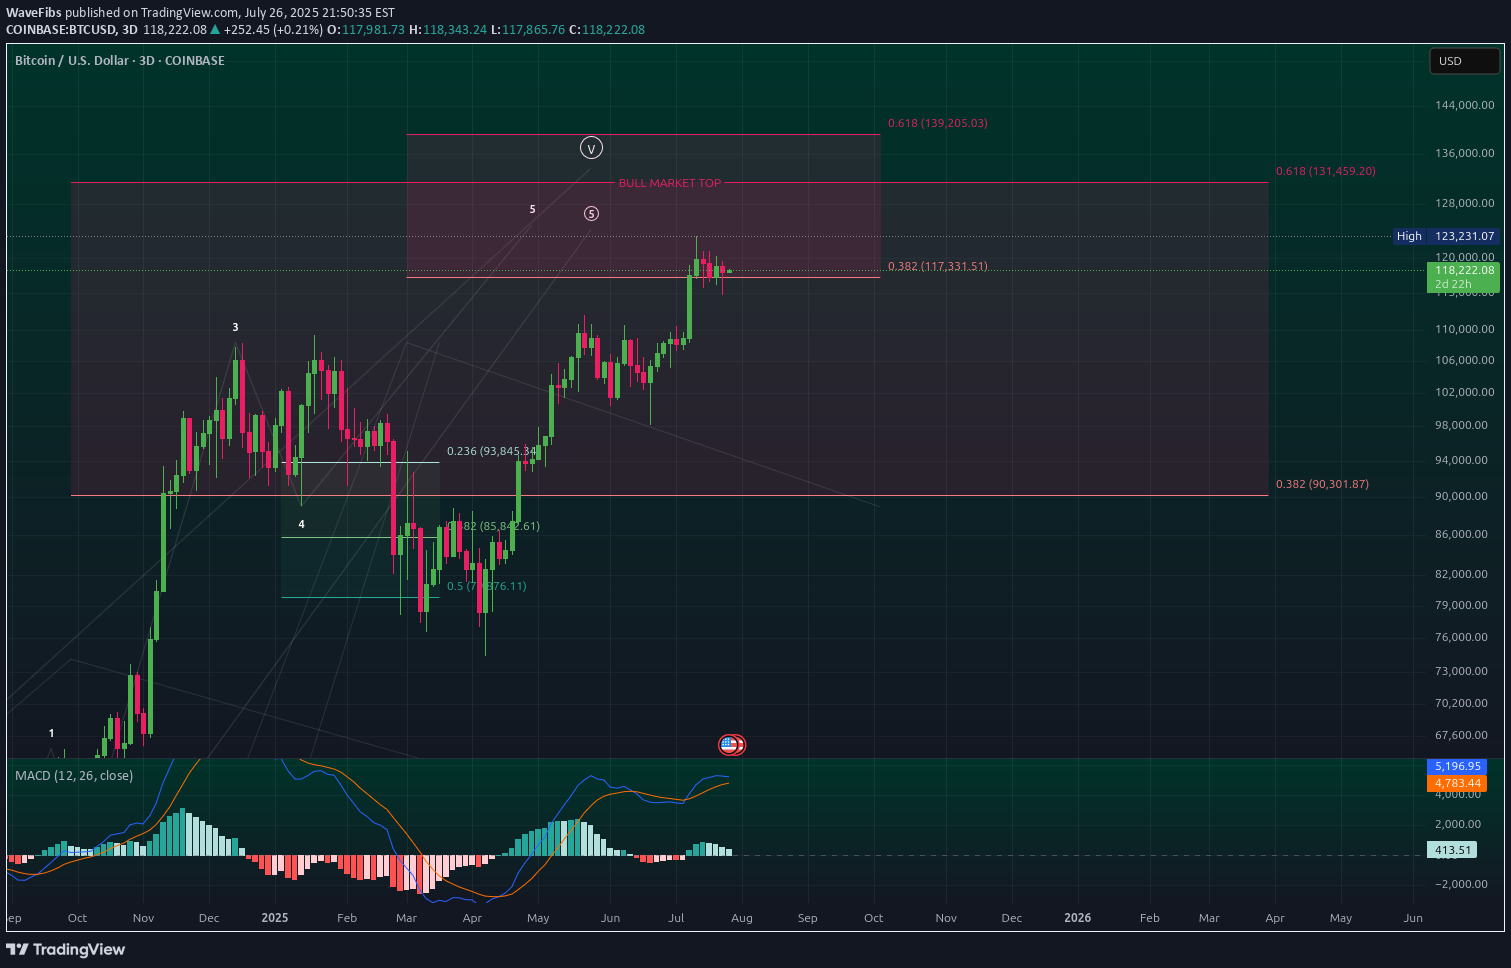
1️⃣ Big-picture wave count We are deep inside cycle wave ⑤; sub-wave ③ delivered the textbook power surge, and price has now produced the final “pin” beyond the wedge roof – a move that often marks the last heartbeat of a fifth wave before the engine cools . The spike paused almost exactly at a 1-for-1 projection of wave ①, which is one of the three classic objectives for a non-extended wave ⑤ (0.618 ×, 1.0 × or 1.618 × wave ①) . Translation: price has reached the textbook exhaustion zone that the slide deck flags as “start thinking about profit-taking”. 2️⃣ What the internals are whispering The manuals remind us that momentum should start to lag into a wave ⑤ – that’s exactly when bearish divergence appears and warns that the impulse is running out of stamina . We now have that divergence across the three-day pane, lining up perfectly with the theory. In the past, that signal has kick-started either: a shallow wave-four-type pullback (23.6 – 38.2 % of the entire leg) if the up-trend is still healthy, or a full ABC retrace back to the 38 – 50 % pocket when the whole five-wave sequence is complete. 3️⃣ Fibonacci map – unchanged edges, new mid-points LayerWhy it matters (per slides) 117 k – 118 k0.382 extension cluster and sub-wave ③ peak – first ceiling. 123 k wick1.0 × wave ① – often the maximum for a regular wave ⑤ . 126 k – 131 k1.618 overlay of the sub-waves – only reached if wave ⑤ “blows off”. 109 k23.6 % retrace of the whole advance – first landing pad for a normal pullback . 103 k – 99 k38–50 % retrace – where a completed impulse usually rests before the next macro move. 4️⃣ Likely path from here (probabilities courtesy of the slide guidance) Scenario OddsWhat you’d expect?How the slides back it up? Truncated top – the wick was the high~60 %Price rolls over swiftly; three-leg drop towards 109 k unfolds within weeks.Divergence in a ⑤ is a tired market; truncated fifths are common when wave ③ was extended . Mini blow-off to 126–131 k~30 %Market reclaims the wedge roof quickly, squeezes short sellers, then stalls at 1.618 cluster.Slides label 1.618 × wave ① as the “stretch target” for an extending ⑤ . Magazine-cover 139 k print<10 %Needs vertical follow-through and no weekly divergence – neither is present.Only seen when sentiment is euphoric and momentum refuses to fade (not the case now). 5️⃣ How to turn this into trades (slide-rule style) Trail profits, don’t chase: the slide on “profit-taking in wave ⑤” recommends feeding the position back to the market once equality or 0.618 targets print, rather than waiting for a collapse . Watch the 23.6–38.2 % retrace band: that zone is the historic sweet spot for a healthy reset after a parabolic run; if price bounces there with improving momentum, the up-trend can restart . If— and only if—price vaults the wedge roof again, leave a runner for 126–131 k, but tighten stops using the 78.6 % trailing method highlighted in the slides. In plain English Bitcoin has done everything a late fifth wave is supposed to do: overshoot a channel, tag a textbook fib target, and lose its breath while momentum lags. That doesn’t guarantee an immediate plunge, but history – and the curriculum we’ve been working through – say a meaningful pullback is now the path of least resistance. Prepare for a cooling phase toward the low-100 k region; if we sprint instead, treat it as a bonus round, not the baseline.
WaveFibs
FET/USDT – Weekly Elliott Wave: Preparing for Bullish Continuati

📊 Wave Count & Channel-Based Elliott Wave Technical Analysis 🔵 Wave 4 Structure (Completed) Wave 4 developed as a classic ABC corrective structure to the downside. 🔹 Wave A: Initial decline with impulsive characteristics. 🔹 Wave B: Partial retracement with overlapping, corrective traits. 🔹 Wave C: A clean final leg completing at the 1.236 Fibonacci extension of Wave A, which is a common target for a C-wave. 📍 Wave 4 and Wave C terminate exactly at: 1.236 Fib extension, or approximately 0.306 from Wave C's origin — as defined in Elliott Wave theory . This matches the expanding channel structure described in the slides: “Wave 4 can be a flat or zigzag... target range between 23.6% and 50%, but extensions (e.g., 1.236) are valid for C-wave finalization.” 🟡 Current Setup: Anticipating a Wave 5 Move We now shift from the completed corrective Wave 4 to a new advance phase, expected to unfold as another ABC corrective structure to the upside (per the yellow count): 🔶 Wave A (Expected Now) The beginning of Wave A is currently developing. Based on structure, Wave A can unfold as either a 5-wave impulse or a 3-wave zigzag: "The only micro structure for direct upside continuation I could think of here is that this here was an Awave... this was a Bwave and this is a Cwave... but there is just no five-wave move up right on the smaller time frame" (Video transcription) Since there’s no confirmed 5-wave count yet, the current move is assumed to be part of Wave A, possibly still forming sub-waves. 🔸 Invalidation and Confirmation Levels The key upside level to break: $0.9912 A move above this level invalidates the C-wave down scenario and confirms bullish continuation. From the project video: “Getting above that level would invalidate the idea that a C-wave to the downside has started...” Once broken, the target for the current bullish Wave A or full 3rd wave remains unchanged at: $1.17, previously defined as the next target for bullish continuation 🔺 Channel Structure & Confluence The contracting diagonal from the start of the chart aligns wave 5 and wave C tops — both terminated at the same horizontal resistance level. Wave 4's expanding correction supports this shift in volatility before Wave 5 begins, as outlined in the slides: “Wave 4 can be an expanding triangle or flat... diagonal patterns often create increased volatility before reversal” ✅ Conclusion Wave 4 has completed via an ABC down, ending at the 1.236 Fib extension of the internal Wave C. We are now in a potential ABC to the upside, with Wave A currently in formation. Awaiting confirmation of 5-wave completion in Wave A. Break above 0.9912 triggers continuation to $1.17 target. All trendline structures, wave counts, and Fib levels are in strict alignment with the educational material and screenshots.
WaveFibs
OM/USDT Weekly Detailed Elliott & Technical Analysis

📈 OM/USDT Technical Analysis 1️⃣ Price Trend 📊 ✅ OM/USDT has been in a strong uptrend, reaching new highs. ✅ The price is currently near a key resistance zone, marked by Fibonacci levels (see the provided chart). ✅ Elliott Wave count suggests the final leg of an impulse wave (Wave 5), indicating a possible local top soon. 2️⃣ Volume Analysis 📊📉 📌 Trading volume has seen periodic spikes, indicating strong interest from traders. 📌 Increased volume on green candles suggests that buyers are still in control. 📌 A sudden drop in volume while the price is rising may indicate buyer exhaustion. 3️⃣ MACD Analysis 📉📈 🔵 MACD is above the signal line, which is a bullish signal. 🔴 A continued divergence between MACD and price could be a warning sign for a potential correction. ⚠️ If MACD starts flattening or turning downward, a reversal could be imminent. 4️⃣ RSI Analysis 📊 📊 RSI is within the normal range, meaning there is no immediate overbought or oversold condition. 🚀 A move above 70 RSI would indicate an overbought market, increasing the risk of a pullback. 🔻 A drop below 50 RSI would signal weakening momentum. 📌 Conclusion & Trade Plan 🐂 Bullish Scenario (Breakout) ✅ If OM/USDT breaks above key Fibonacci resistance levels, it could continue toward 8.20 USDT or even 10.02 USDT. 🐻 Bearish Scenario (Pullback) ⚠️ If price fails to break resistance and MACD starts declining, we could see a retracement toward 6.77 USDT or even 6.33 USDT. Key Levels to Watch 🔍 🔹 Support: 6.77 USDT, 6.33 USDT 🔹 Resistance: 8.20 USDT, 10.02 USDT 🌀 Elliott Wave Analysis for OM/USDT 🔍 Wave Structure Overview 📌 The current Elliott Wave count suggests that OM/USDT is in the final impulse wave (Wave 5). 📌 This means that the price is nearing a potential peak before entering a corrective ABC pattern. 📌 The market has seen a strong upward trend, aligning with Fibonacci extensions. 🌀 Key Observations 📊 Wave 1-2-3-4-5 Structure ✅ The price action has followed a classic 5-wave Elliott structure, with Wave 3 being the strongest. ✅ Wave 4 was a retracement, creating a higher low before Wave 5. 🎯 Wave 5 Target Levels (Fibonacci Extensions) 🔹 6.77 USDT - This is the 1.0 extension level, which has already been tested. 🔹 8.20 USDT - The 1.236 Fibonacci extension, a potential target if bullish momentum continues. 🔹 10.02 USDT - The 0.618 extension, marking an extreme target if the wave extends further. 🛑 Potential Correction (ABC Structure Incoming?) ⚠️ If Wave 5 completes, we should expect a corrective ABC wave to form. ⚠️ The key support levels for this correction are 6.33 USDT (0.382 retracement) and 5.80 USDT. 🎯 Trading Strategy 📈 Bullish Scenario 🚀 ✅ If price breaks 8.20 USDT, it can extend to 10.02 USDT. ✅ Momentum traders should look for volume confirmation before entering. 📉 Bearish Scenario ⚠️ ⚠️ If rejection happens around current resistance, a pullback to 6.77 USDT - 6.33 USDT is likely. ⚠️ If MACD starts weakening, it could signal the beginning of an ABC correction. 🔥 Final Takeaway 🔥 ✅ OM/USDT is in a strong Elliott Wave 5 uptrend with a potential target of 8.20 - 10.02 USDT. ✅ If momentum weakens, an ABC correction could follow, pulling price back toward 6.33 USDT. ✅ Traders should monitor MACD, RSI, and volume behavior to anticipate the next move. 📉 Short Opportunity Coming Soon! 🚨 🔴 OM/USDT is nearing the final stages of Wave 5, which signals a high probability of a short opportunity in the coming days. 🔴 Key indicators like MACD, RSI, and Volume suggest that bullish momentum may be weakening. 🔴 If the price fails to break above 8.20 USDT and MACD starts turning downward, a sharp correction (ABC pattern) could follow.
WaveFibs
TAO/USDT Weekly Elliott Wave & Fibonacci Analysis

📌 TAO/USDT Elliott Wave & Fibonacci Analysis: A Deep Dive 🚀 🔹 Market Structure Overview The TAO/USDT chart exhibits two potential Elliott Wave scenarios: A completed Wave 2 correction leading into an impulsive Wave 3. An ongoing ABC corrective pattern before a bullish move. Using Fibonacci retracements, extensions, volume trends, and momentum indicators (MACD, RSI), we can refine both scenarios. 🔹 Scenario 1: Impulsive Wave 3 Towards $1,532.5+ Wave 3 Expansion & Fibonacci Levels The price has retested 0.786 Fib support ($226.3), a historically strong level for a wave reversal. Wave 3's minimum projected target is $1,532.5 (1.236 Fibonacci extension). If momentum builds, the 1.618 extension ($2,729.5) could be reached, aligning with strong historical price expansions. Market Behavior & Momentum MACD Analysis: A bullish crossover in the MACD histogram would confirm momentum shifting toward an impulsive move. RSI Trends: RSI stabilizing above 50 would indicate growing buyer strength, supporting the bullish outlook. Volume Dynamics: Increasing volume at key support levels suggests institutional accumulation. 📌 Confirmation Zone for Wave 3: A sustained breakout above $740 (recent high) would confirm the beginning of Wave 3. 🔻 Scenario 2: ABC Correction Before Reversal Potential for a Deeper C-Wave Drop Instead of an immediate breakout, the market may still be completing an ABC correction. Wave C targets: 100% Fibonacci Extension: $160.6 1.236 Fibonacci Extension: $111.9 Potential Max Extension: $89.5 (1.382 Fib) Indicators Supporting a Further Decline MACD remains bearish, suggesting downside continuation before a reversal. RSI is not yet at oversold levels, meaning further weakness is possible. Volume profile shows a lack of aggressive buying, indicating sellers still have control. 📌 Key Reversal Zone for the Next Bullish Cycle: If the price drops to the $160.6-$111.9 range, a strong bounce could follow, leading into the next impulsive wave. 📌 Conclusion If $226.3 holds, it strengthens the case for an impulsive Wave 3 move towards $1,532.5+. If support fails, a final correction to $160.6 or even $111.9 is expected before a strong upside reversal. Volume and momentum indicators will be crucial in confirming the next major move. This analysis provides a structured view of potential Elliott Wave formations and Fibonacci-based price levels, giving clear insights into TAO/USDT’s possible market direction.
WaveFibs
XRP/USD Analysis – Bullish Elliott Wave 5 Expansion

🚀 XRP/USD – Bullish Elliott Wave 5 Expansion 🚀 📈 Weekly Chart Analysis | Elliott Wave + Fibonacci + MACD + RSI XRP is currently in a Wave 4 corrective phase, setting up for a Wave 5 expansion. If XRP maintains key support levels and breaks above resistance, we could see a strong bullish move toward $10.45 and beyond. 📊 Elliott Wave & Fibonacci Analysis XRP's Elliott Wave structure suggests that Wave 5 is yet to unfold. Based on Fibonacci extensions, the next bullish price targets are: ✅ Fib 0.382 (~$4.60 USD) – Initial target, a breakout here confirms strong bullish momentum. ✅ Fib 0.618 (~$8.75 USD) – Mid-term bullish target, aligning with previous resistance zones. ✅ Fib 1.236 (~$10.45 USD) – Key breakout level for an extended Wave 5 rally. ✅ Fib 1.618 (~$14.99 USD) – Ultimate Wave 5 expansion if bullish momentum continues. ✅ Fib 1.618 Extended (~$31.56 USD) – Parabolic target if XRP enters a strong breakout cycle. 🔹 Key Support Levels 🟢 $2.03 USD (Fib 0.236) – Support 🟢 $1.47 USD (Fib 0.382) – Deeper retracement support. 🟢 $1.14USD (Fib 0.5) – Must hold for the bullish structure to remain valid. 🔹 Key Resistance Levels 🚀 $3.99 USD – Crucial breakout zone. 🚀 $5.05 USD – First major Wave 5 target. 🚀 $8.75 USD – Strong resistance and Fib 0.618 level. 🚀 $10.45 USD – Breakout confirmation of Wave 5 expansion. 📉 MACD & RSI Confirmation 📊 MACD Analysis: ✅ Bullish Crossover – MACD lines show a strong momentum shift. ✅ Increasing Histogram – Indicates rising bullish pressure. ⚡ RSI Strengthening: ✅ Currently ~77 RSI – Entering strong bullish territory. ✅ Above 60 RSI – Momentum shift confirmed, but a short-term pullback is possible before further gains. 📊 Volume Analysis & Market Structure 📌 Current Volume: 🔹 Volume is increasing, confirming strong buyer interest. 🔹 A spike in buy volume above $3.99 USD will confirm a breakout toward $5.05 USD. 🚦 Market Structure Confirmation: ✅ Higher lows forming – Bullish structure intact. ✅ Breakout above $3.99 USD + volume spike = Strong Wave 5 rally potential. ✅ Bullish Trade Plan 🔹 Entry Trigger: Breakout above $3.99 USD with volume confirmation. 🎯 Take Profit 1: $5.05 USD (Fib 0.382) 🚀 Take Profit 2: $8.75 USD (Fib 0.618) 🌕 Take Profit 3: $14.99 USD (Fib 1.618) 🛑 Stop-Loss: Below $1.14USD (Fib 0.5) 💡 Conclusion & Market Sentiment 🔹 XRP is approaching a key resistance zone at $3.99 USD. 🔹 A break and close above this level with strong volume will signal the start of Wave 5, potentially targeting $8.75 USD and beyond. 📢 Market sentiment remains strongly bullish. ✅ If XRP holds above $1.14 USD, the bullish wave structure remains intact. ✅ MACD & RSI confirm strong momentum, but volume confirmation is needed. ✅ Watch for a volume breakout above $3.99 USD before entering a trade. 📢 What’s your XRP price target? Comment below! 🔥 📈 Like & Follow for More Crypto Analysis! 🚀
Disclaimer
Any content and materials included in Sahmeto's website and official communication channels are a compilation of personal opinions and analyses and are not binding. They do not constitute any recommendation for buying, selling, entering or exiting the stock market and cryptocurrency market. Also, all news and analyses included in the website and channels are merely republished information from official and unofficial domestic and foreign sources, and it is obvious that users of the said content are responsible for following up and ensuring the authenticity and accuracy of the materials. Therefore, while disclaiming responsibility, it is declared that the responsibility for any decision-making, action, and potential profit and loss in the capital market and cryptocurrency market lies with the trader.