Technical analysis by WaveFibs about Symbol BTC on 7/27/2025

WaveFibs
Bitcoin – “topping-zone” update, grounded in the play-book
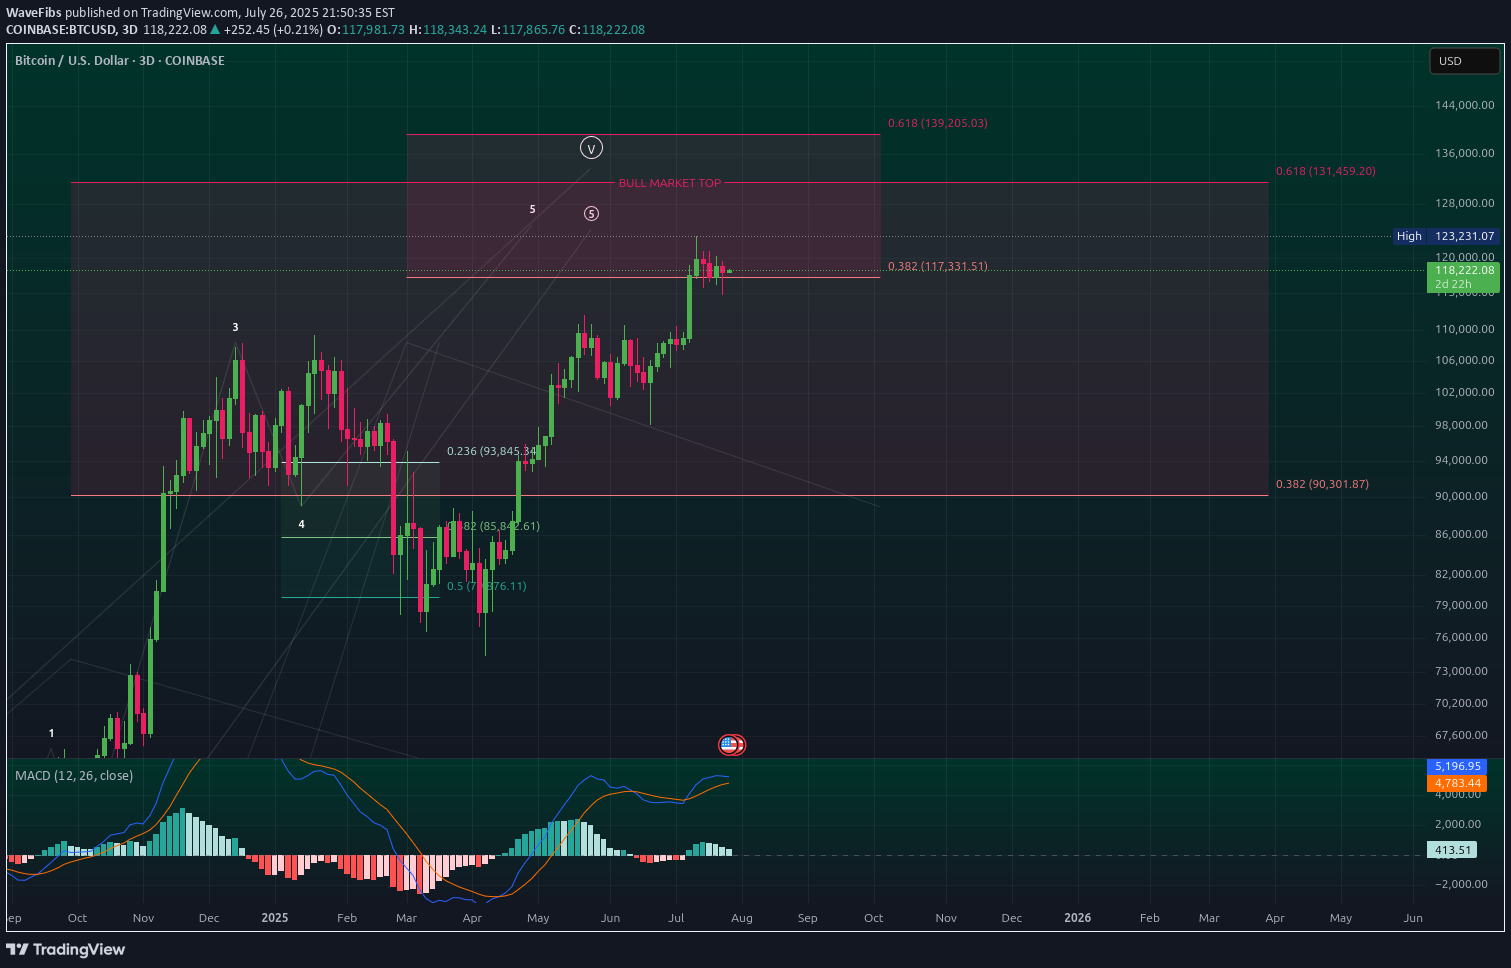
1️⃣ Big-picture wave count We are deep inside cycle wave ⑤; sub-wave ③ delivered the textbook power surge, and price has now produced the final “pin” beyond the wedge roof – a move that often marks the last heartbeat of a fifth wave before the engine cools . The spike paused almost exactly at a 1-for-1 projection of wave ①, which is one of the three classic objectives for a non-extended wave ⑤ (0.618 ×, 1.0 × or 1.618 × wave ①) . Translation: price has reached the textbook exhaustion zone that the slide deck flags as “start thinking about profit-taking”. 2️⃣ What the internals are whispering The manuals remind us that momentum should start to lag into a wave ⑤ – that’s exactly when bearish divergence appears and warns that the impulse is running out of stamina . We now have that divergence across the three-day pane, lining up perfectly with the theory. In the past, that signal has kick-started either: a shallow wave-four-type pullback (23.6 – 38.2 % of the entire leg) if the up-trend is still healthy, or a full ABC retrace back to the 38 – 50 % pocket when the whole five-wave sequence is complete. 3️⃣ Fibonacci map – unchanged edges, new mid-points LayerWhy it matters (per slides) 117 k – 118 k0.382 extension cluster and sub-wave ③ peak – first ceiling. 123 k wick1.0 × wave ① – often the maximum for a regular wave ⑤ . 126 k – 131 k1.618 overlay of the sub-waves – only reached if wave ⑤ “blows off”. 109 k23.6 % retrace of the whole advance – first landing pad for a normal pullback . 103 k – 99 k38–50 % retrace – where a completed impulse usually rests before the next macro move. 4️⃣ Likely path from here (probabilities courtesy of the slide guidance) Scenario OddsWhat you’d expect?How the slides back it up? Truncated top – the wick was the high~60 %Price rolls over swiftly; three-leg drop towards 109 k unfolds within weeks.Divergence in a ⑤ is a tired market; truncated fifths are common when wave ③ was extended . Mini blow-off to 126–131 k~30 %Market reclaims the wedge roof quickly, squeezes short sellers, then stalls at 1.618 cluster.Slides label 1.618 × wave ① as the “stretch target” for an extending ⑤ . Magazine-cover 139 k print<10 %Needs vertical follow-through and no weekly divergence – neither is present.Only seen when sentiment is euphoric and momentum refuses to fade (not the case now). 5️⃣ How to turn this into trades (slide-rule style) Trail profits, don’t chase: the slide on “profit-taking in wave ⑤” recommends feeding the position back to the market once equality or 0.618 targets print, rather than waiting for a collapse . Watch the 23.6–38.2 % retrace band: that zone is the historic sweet spot for a healthy reset after a parabolic run; if price bounces there with improving momentum, the up-trend can restart . If— and only if—price vaults the wedge roof again, leave a runner for 126–131 k, but tighten stops using the 78.6 % trailing method highlighted in the slides. In plain English Bitcoin has done everything a late fifth wave is supposed to do: overshoot a channel, tag a textbook fib target, and lose its breath while momentum lags. That doesn’t guarantee an immediate plunge, but history – and the curriculum we’ve been working through – say a meaningful pullback is now the path of least resistance. Prepare for a cooling phase toward the low-100 k region; if we sprint instead, treat it as a bonus round, not the baseline.