
TheTraderAndy
@t_TheTraderAndy

What symbols does the trader recommend buying?
Purchase History
پیام های تریدر
Filter
TheTraderAndy
Wyckoff Reaccumulation: PEPE
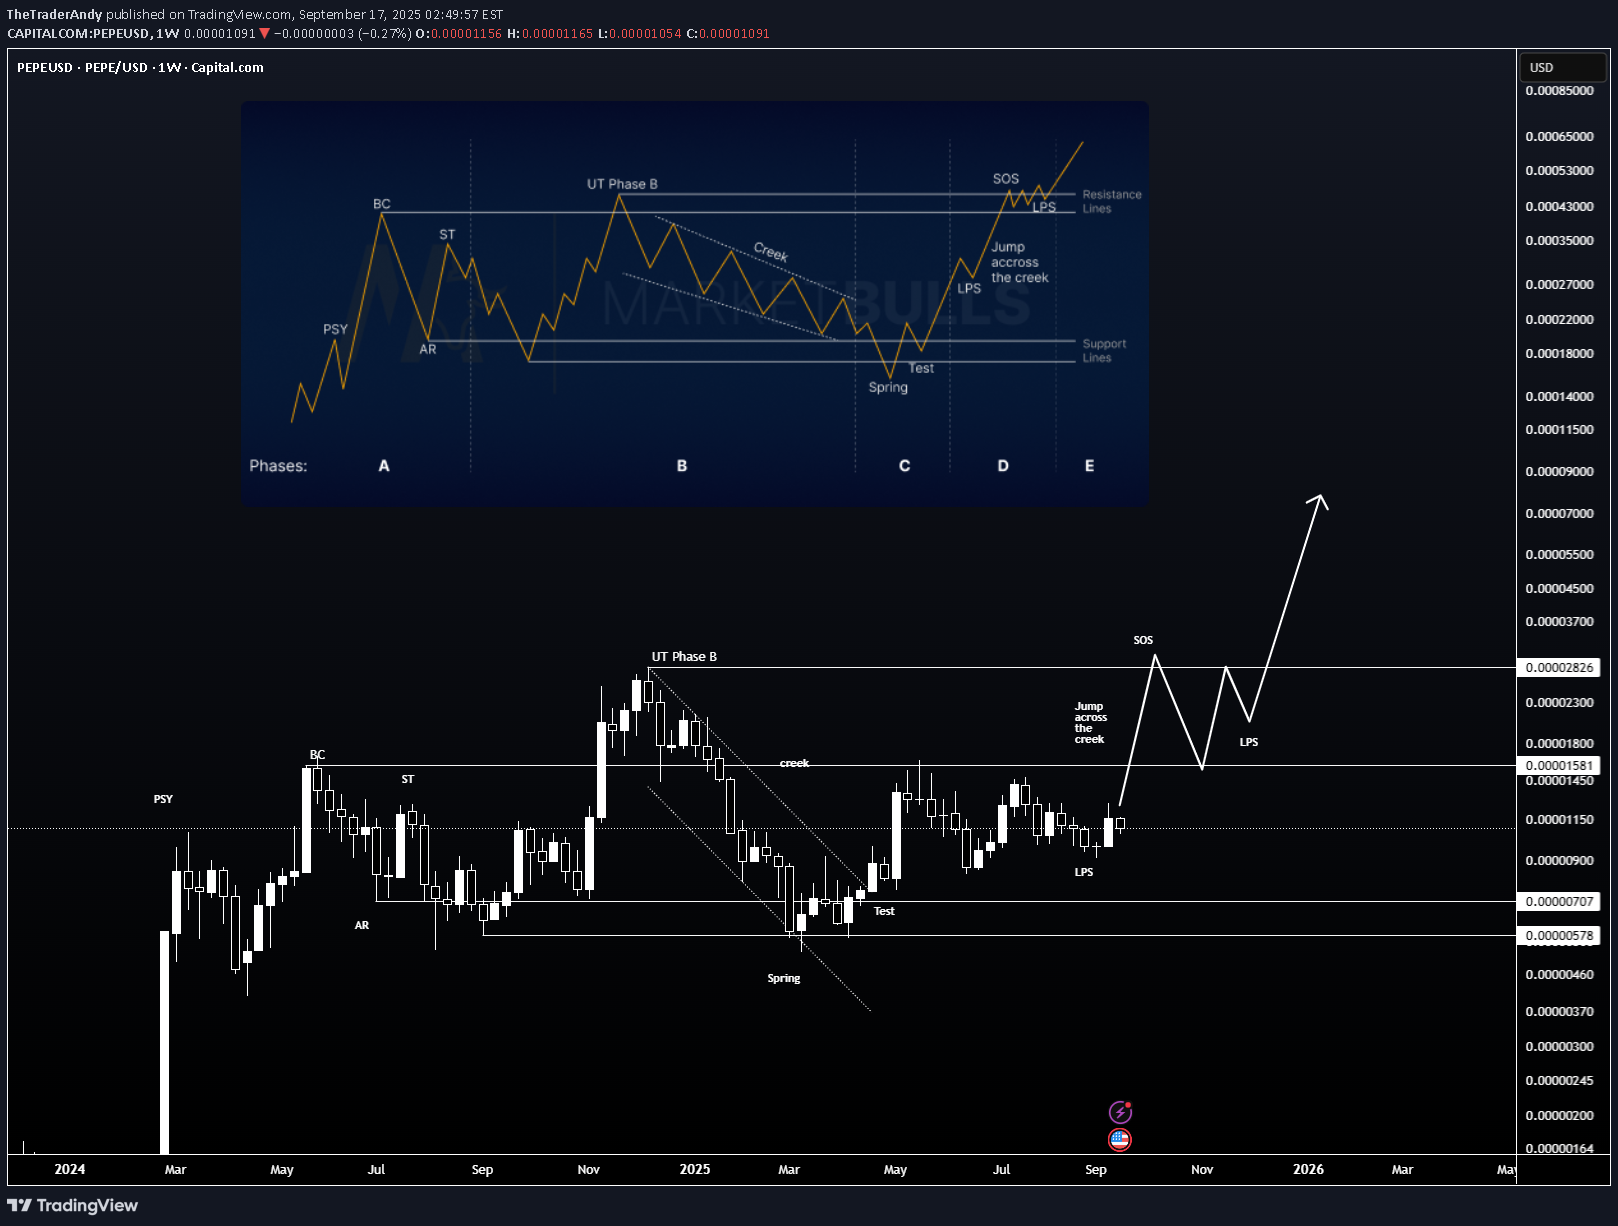
PEPE appears to be following a classic Wyckoff Accumulation structure on the weekly timeframe. After completing the Phase A–C cycle with a clear Spring & Test, the market is showing early signs of strength. Phase A: Preliminary Support (PSY), Buying Climax (BC), Automatic Reaction (AR), and Secondary Test (ST) established the range. Phase B: Extended consolidation with an UT (upthrust) before the final breakdown. Phase C: Spring & successful Test confirmed demand absorption at the lower boundary. Phase D: Current price action shows a Jump Across the Creek (JAC) followed by a Last Point of Support (LPS). A Sign of Strength (SOS) is expected with a move above $0.00001581. Phase E (Projection): Continuation higher with new LPS formations and a potential markup cycle toward $0.00002826 and above.
TheTraderAndy
Wyckoff Re-Accumulation Range
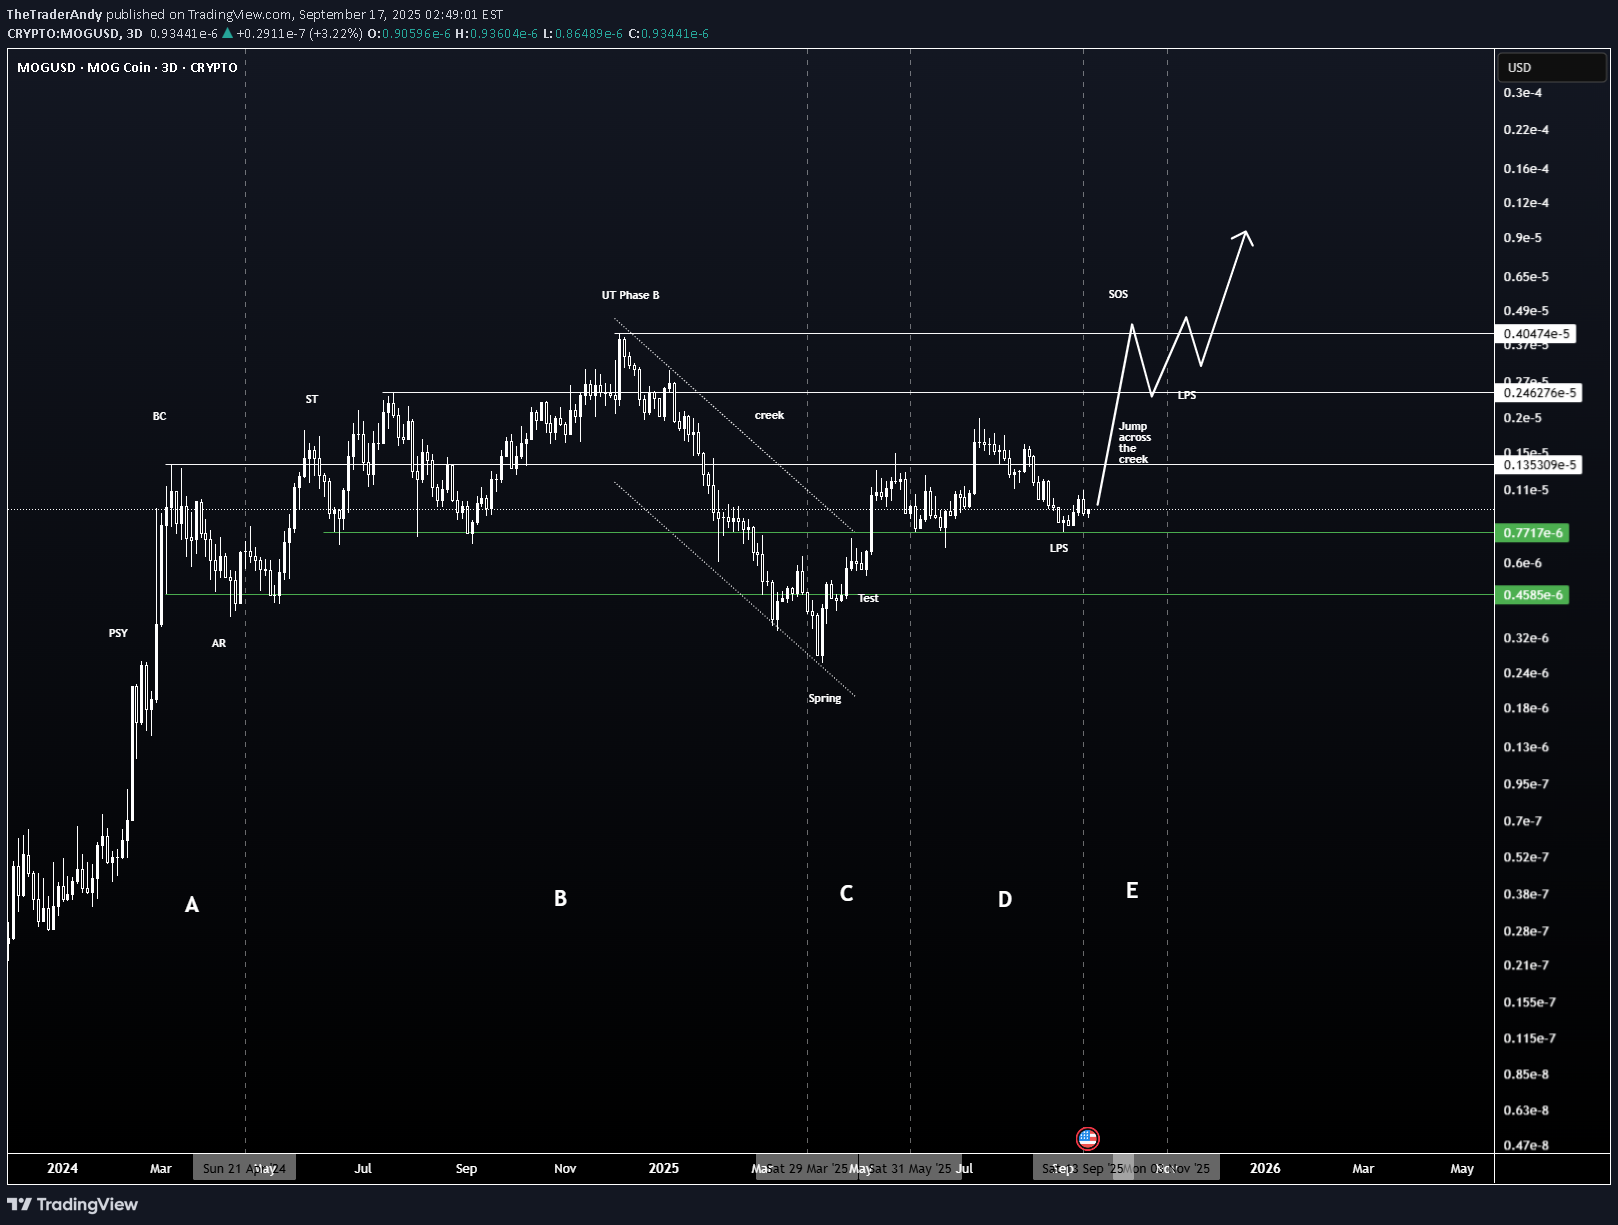
MOG Coin continues to respect the Wyckoff Accumulation model, showing strong structural alignment with the textbook schematic. Phase A: PSY, BC, AR, and ST defined the range after the initial uptrend exhaustion. Phase B: Distribution-like chop with a clear UT before the breakdown. Phase C: Spring & Test successfully swept deep liquidity into the $0.00000045 – $0.00000077 zone. Phase D: Current action shows a Jump Across the Creek (JAC) followed by an LPS, building the foundation for a Sign of Strength (SOS). Phase E (Projection): If SOS confirms above $0.0000244, markup towards $0.000040 – $0.000050 becomes the next likely phase target.
TheTraderAndy
They're lying! WIF will explode to 28.8$

✅ Golden Pocket Extension: $28.80 aligns with the 1.618–1.65 fib extension (golden pocket zone) from the last major impulse. ✅ Measured Move: Breakout from the prior downward consolidation projects to ~$28.80 when using the height of the range added to the breakout point. ✅ Confluence = High Probability: Both fib extension and measured move target the same zone, increasing confidence. ✅ Momentum + Meme Rotation: If broader meme coin rotation continues, WIF has narrative + volatility fuel.
TheTraderAndy
ATH for ADA soon

Chart says it all, ADA looks prime to run, could reach as high as $6.80 1. Technological Upgrades and Hard ForksThe Plomin Hard Fork in Q1 2025 enhanced governance, while upcoming features like Leios for scalability, BTC DeFi interoperability, L2s, and partnerchains boost efficiency and adoption, positioning Cardano as a leader in secure, sustainable blockchain tech. 2. Spot ETF Speculation and Institutional InterestGrayscale's pending ADA ETF filing with Nasdaq, plus inclusion in their Large Cap ETF, could unlock massive demand. Analysts see this as a game-changer, similar to Bitcoin/ETH ETFs, potentially driving prices to $5+ by year-end. 3. Ecosystem Expansion and IntegrationsNew tools like the EMURGO global Cardano card for ADA payments, Blockchain.com DeFi wallet integration (37M users), and Tokeo Wallet's XRP bridge enhance real-world utility. DeFi TVL and on-chain activity (unique addresses +4.79%, active wallets +12%) are surging. 4. Whale Activity and On-Chain MomentumWhales are accumulating amid spikes in network volume and no downtimes/hacks. Features like privacy via Midnight Network and Charles Hoskinson's White House advisory role add credibility, fueling a "silent surge." 5. Technical Breakouts and Market CorrelationADA has formed bullish patterns like a golden cross, double-bottom, and breakout from descending channels, correlating with Bitcoin's rally. RSI at 76 signals strong momentum, with targets at $0.82–$1.18 short-term and up to $2.80+ long-term. 6. Airdrops and Community HypeUpcoming events like the Glacier airdrop and NIGHT airdrop are creating buzz, alongside Cardano's unmatched decentralization and energy efficiency, potentially sparking a 383% rally as in past cycles.
TheTraderAndy
ETH to $12,600
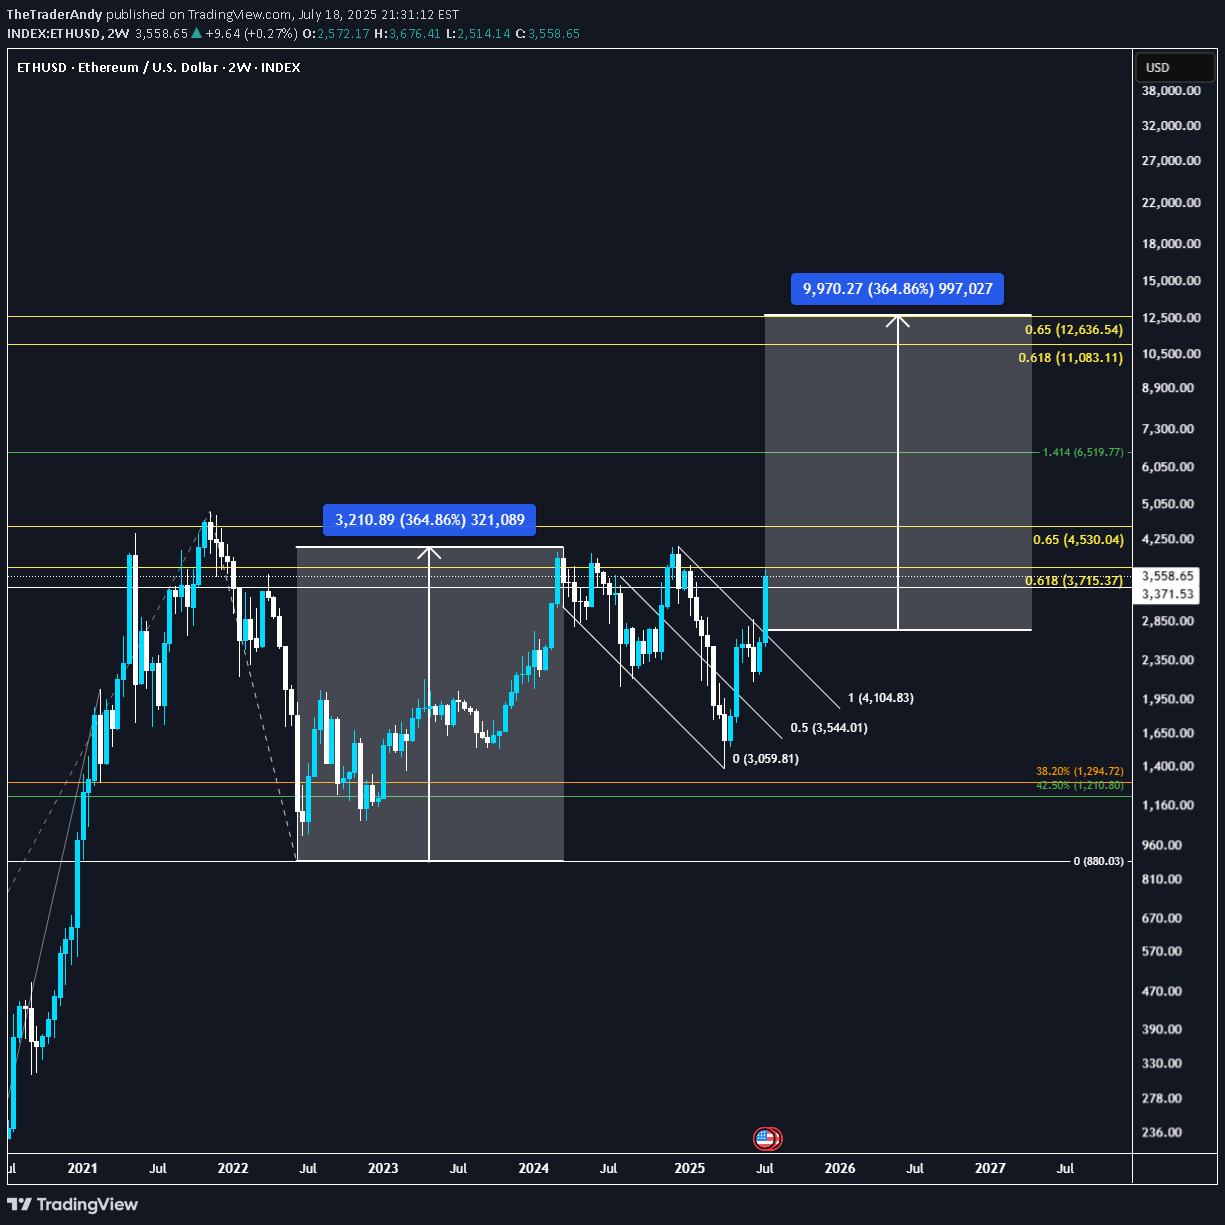
I think ETH, with all the current fundamental shifts happening in the past 6 months, is prime to run to the golden pocket, a perfect measured move and cup & handle pattern playing out. 1️⃣ Institutional floodgates opening Spot ETH ETFs have seen massive inflows—billions flowing in just weeks. BlackRock and other majors are prepping ETFs that may include staking, turning ETH into an institutional yield asset. This is serious structural demand, not retail hype. 2️⃣ Regulatory clarity coming in hot The GENIUS Act and stablecoin bills in the U.S. are pushing regulatory clarity into crypto markets fast. This reduces uncertainty and increases appetite for ETH from corporates and funds. 3️⃣ Technicals are clean and bullish ETH flipped $3,300 into support and is holding strong. Next major resistances at $3,800–$4,100, with ATH at $4,800 firmly back on the radar. Short-term structure is clear: higher highs, higher lows, solid volume backing it. 4️⃣ On-chain and supply dynamics Whales are aggressively accumulating—large wallet inflows confirm that. Staked ETH keeps hitting new highs (~30% of supply locked), tightening available float. This supply squeeze + ETF demand = bullish cocktail. 5️⃣ Ethereum’s ecosystem dominance is intact ETH still hosts the lion’s share of stablecoins and DeFi. Layer-2 scaling is progressing fast, upgrades like EIP-4844 and Pectra coming soon, reducing gas fees and improving UX—critical for future adoption.
TheTraderAndy
ARK: 100x in the making
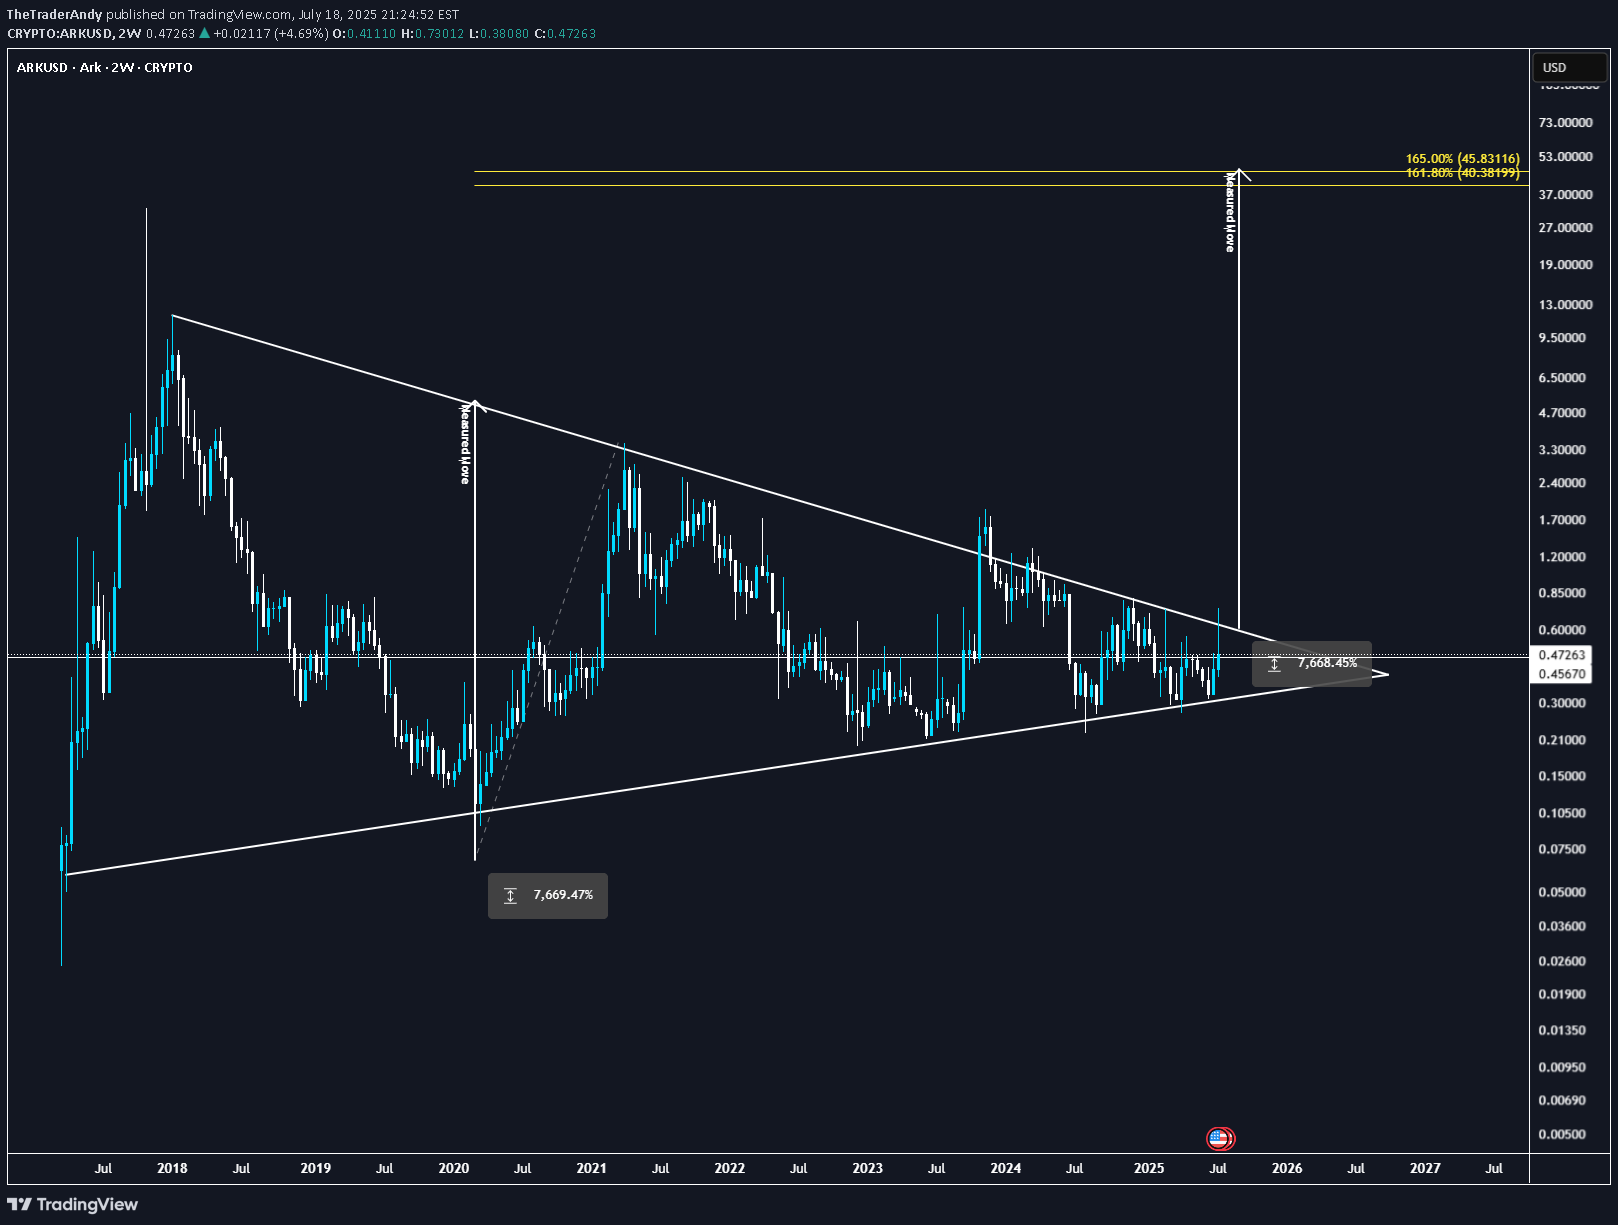
Multi year compression, this is simply one of the best set ups in crypto today. Heavy volume & sharp price moves ARK didn’t just move—it ripped ~75% in one swing, with daily volume pushing $6–7M. Weekly upside is outpacing the market, classic sign of real demand coming in. ARK’s more than a meme—it’s built on Delegated Proof of Stake (DPoS), with forging delegates, fast blocks, and governance on-chain. Utility’s there to support a legit move if adoption increases. Alt season is underway. ARK’s strength isn’t just tagging along—it’s showing independent bullish structure with real volume behind it. ARK’s showing proper strength—strong volume, clean technical structure, ecosystem fundamentals, and broad altcoin momentum.
TheTraderAndy
SHIB could explode soon.
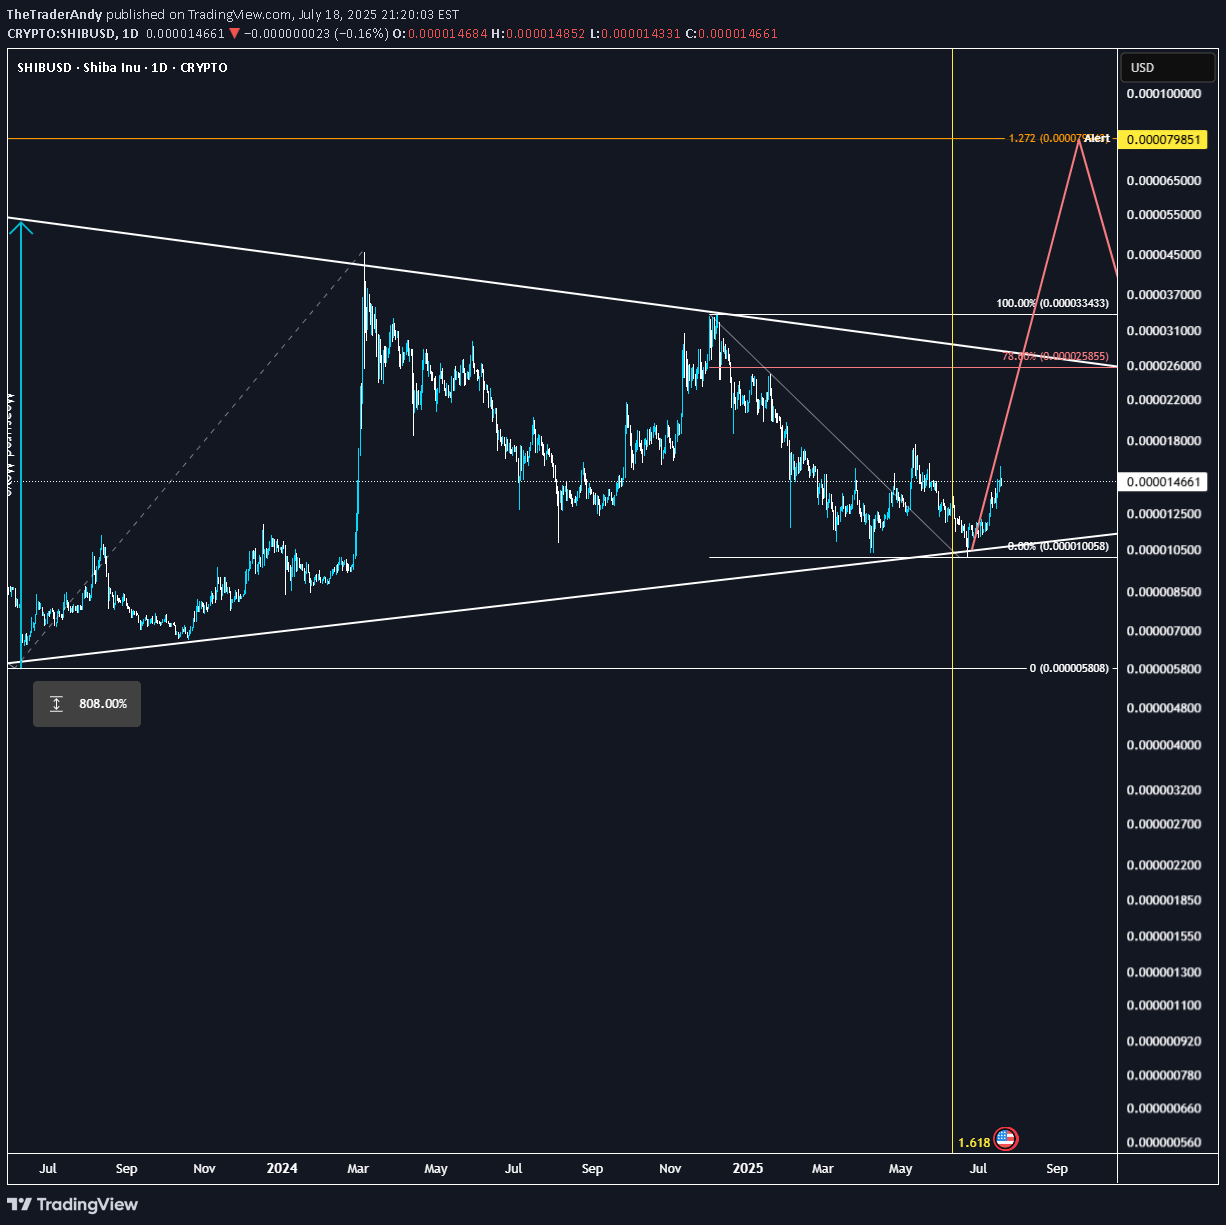
Multi year accumulation, crossing a significant fib-time pivot, similar set up to XRP.. could follow DOGE once it takes the lead as a catch up trade and rip.. Technical breakout: Above 200-day MA + golden cross formation Volume surge: Social + trading volume spiking, driving demand Ecosystem catalysts: Shibarium L2, metaverse progress, aggressive token burns cutting supply Macro tailwinds: ETH rally + broad altcoin strength I think it could be one of the leaders before capital rotates into the lower caps
TheTraderAndy
DOGE to $2 before EOY
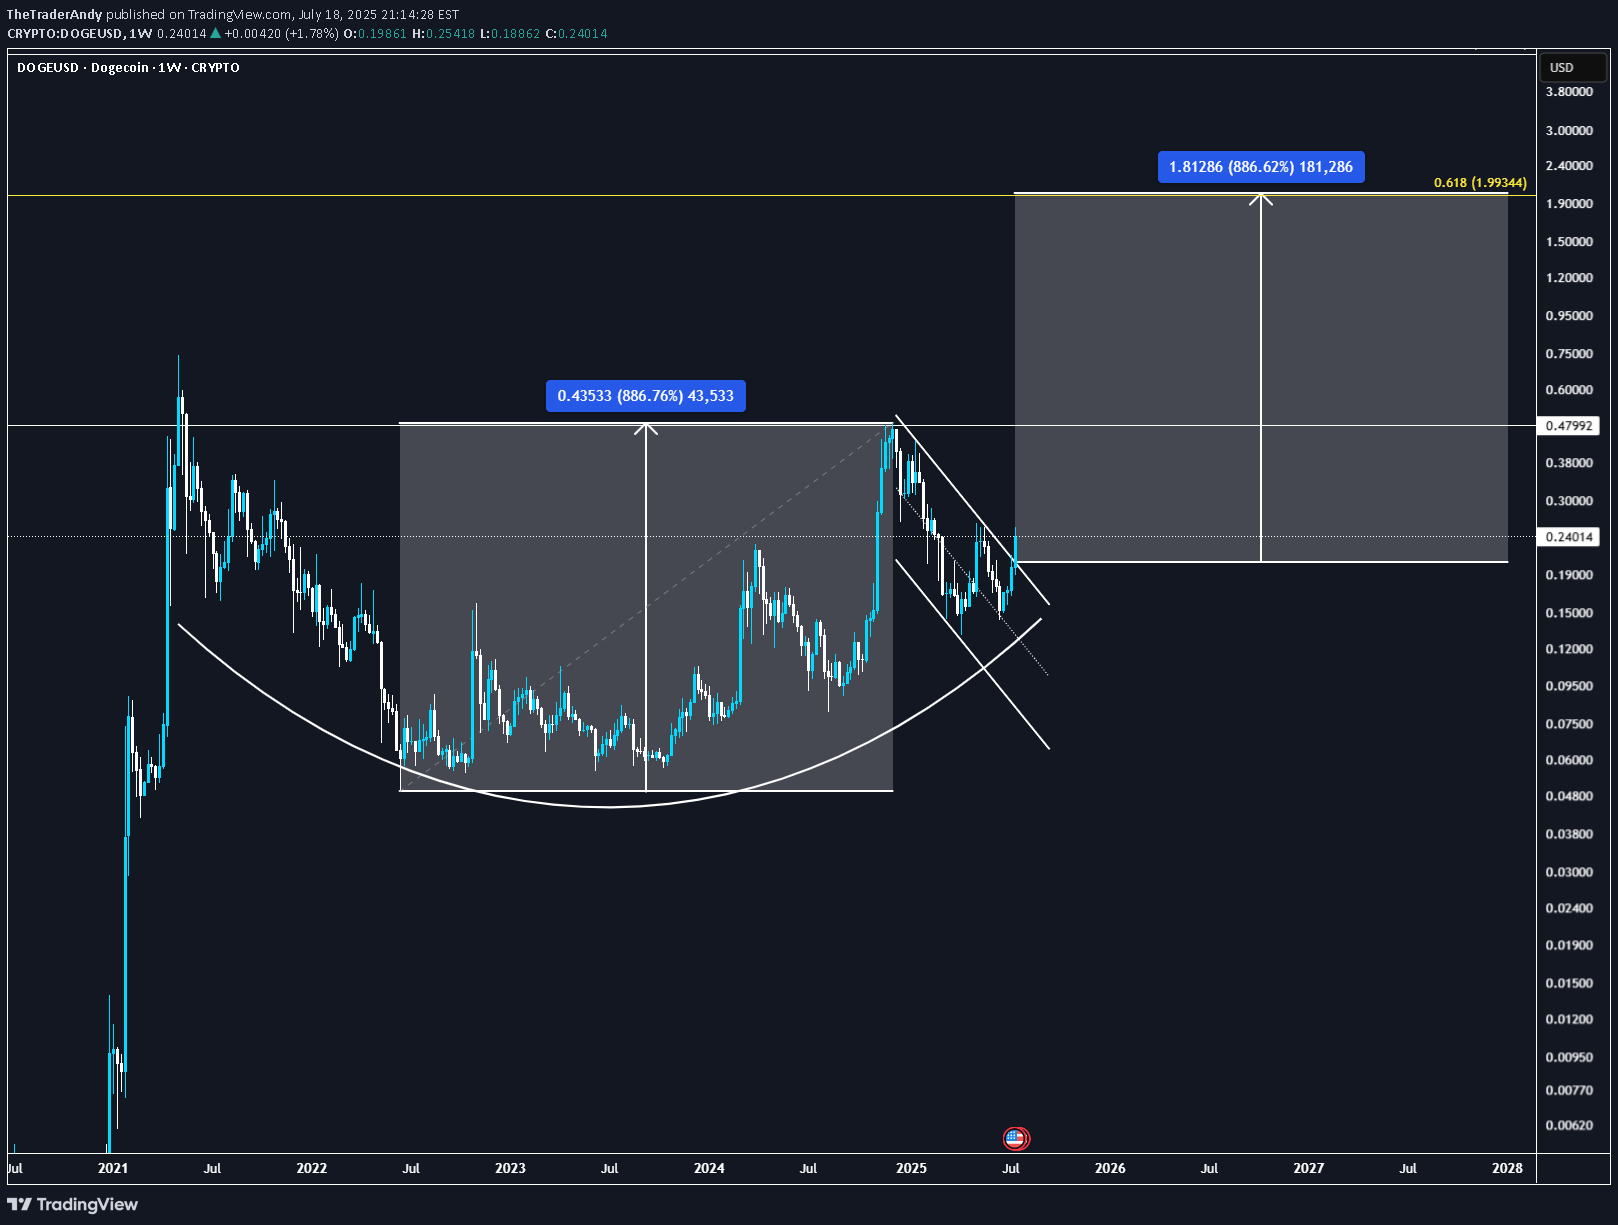
CUP & Handle type formation on DOGE, really believe this can run to $2 during alt season which has just started firing its engines ... BTC.D finally looks toppy. 📈 1. Technical breakout & chart patterns DOGE has recently broken out of a long-term descending channel, forming a classic double-bottom pattern—a strong reversal signal. It also cleared the key $0.20–$0.21 resistance zone, with on‑chain data pointing to rising futures/open interest and reduced sell pressure ⚖️ 2. Macro & regulatory tailwinds The passage of the Genius Act in the U.S. House brought “clear‑cut regulation” for crypto, boosting confidence and driving DOGE higher—rising ~8% on the news Broader crypto bull sentiment—fueled by possible Fed rate cuts and favorable legislation—has pushed altcoins like DOGE ahead this week 🧠 3. On‑chain & investor activity Charts show increasing futures & spot trading volumes, along with expanding whale activity and holders staying profitable—collectively suggesting strong demand and low sell pressure Network usage is also up: wallet interactions and momentum have accelerated as DOGE crosses these technical thresholds 💬 4. Community & utility factors Dogecoin maintains a vibrant community, boating meme-driven social capital, plus occasional celebrity mentions (e.g., Elon Musk), keeping public attention Its growing real-world usage in tipping, payments (e.g., Shopify, AMC, Tesla merch), and even institutional products—like the Grayscale Dogecoin Trust—adds fundamental backing
TheTraderAndy
SHIB to pop 400% very soon.

SHIB appears poised for a potential breakout, mirroring XRP's historical price action. After consolidating for approximately 1,000 days, SHIB has reached a key Fibonacci time extension (1.618), a significant technical milestone often associated with trend reversals. The chart structure shows similarities to XRP before its major rally to previous highs, suggesting a possible repeat scenario. On the daily timeframe, SHIB is forming an inverse head-and-shoulders pattern, a bullish reversal setup indicating potential upward momentum. As a "forgotten" meme coin, SHIB could see renewed interest, especially with positive ecosystem developments like Shibarium upgrades, token burns, and new token launches (TREAT and SHI), which may act as fundamental triggers. The diminishing exchange supply and broader market sentiment (e.g., a Bitcoin super-cycle) could further support a rally, similar to XRP’s unexpected surge on positive news.
TheTraderAndy
What's next for Bitcoin? Chop into end of March, then 165k

I believe we are in the last leg of the cycle here. I expect another sideways chop to form a bull flag pattern into end of march, then a 3 wave move up to tap 164-165k before entering a 12month + bear market. Fear is at an all time high, alt coin traders are completely obliterated (I have been through it too, a lot of my previous attempts to call bottoms on some coins were invalidated due to a weaking broader market), however, I believe many alts now have put in bottoming structures such as POPCAT, FARTCOIN, MOG etc.
Disclaimer
Any content and materials included in Sahmeto's website and official communication channels are a compilation of personal opinions and analyses and are not binding. They do not constitute any recommendation for buying, selling, entering or exiting the stock market and cryptocurrency market. Also, all news and analyses included in the website and channels are merely republished information from official and unofficial domestic and foreign sources, and it is obvious that users of the said content are responsible for following up and ensuring the authenticity and accuracy of the materials. Therefore, while disclaiming responsibility, it is declared that the responsibility for any decision-making, action, and potential profit and loss in the capital market and cryptocurrency market lies with the trader.