
MOG
موگ کوین
| تریدر | نوع سیگنال | حد سود/ضرر | زمان انتشار | مشاهده پیام |
|---|---|---|---|---|
نتیجه ای یافت نشد. | ||||
نمودار قیمت موگ کوین
سود ۳ ماهه :
سیگنالهای موگ کوین
فیلتر
مرتب سازی پیام براساس
نوع پیام
نوع تریدر
فیلتر زمان

mrarroyo2u
اولین ETF ارز دیجیتال MOG در آمریکا: ورود قانونی به دنیای میمکوینها!
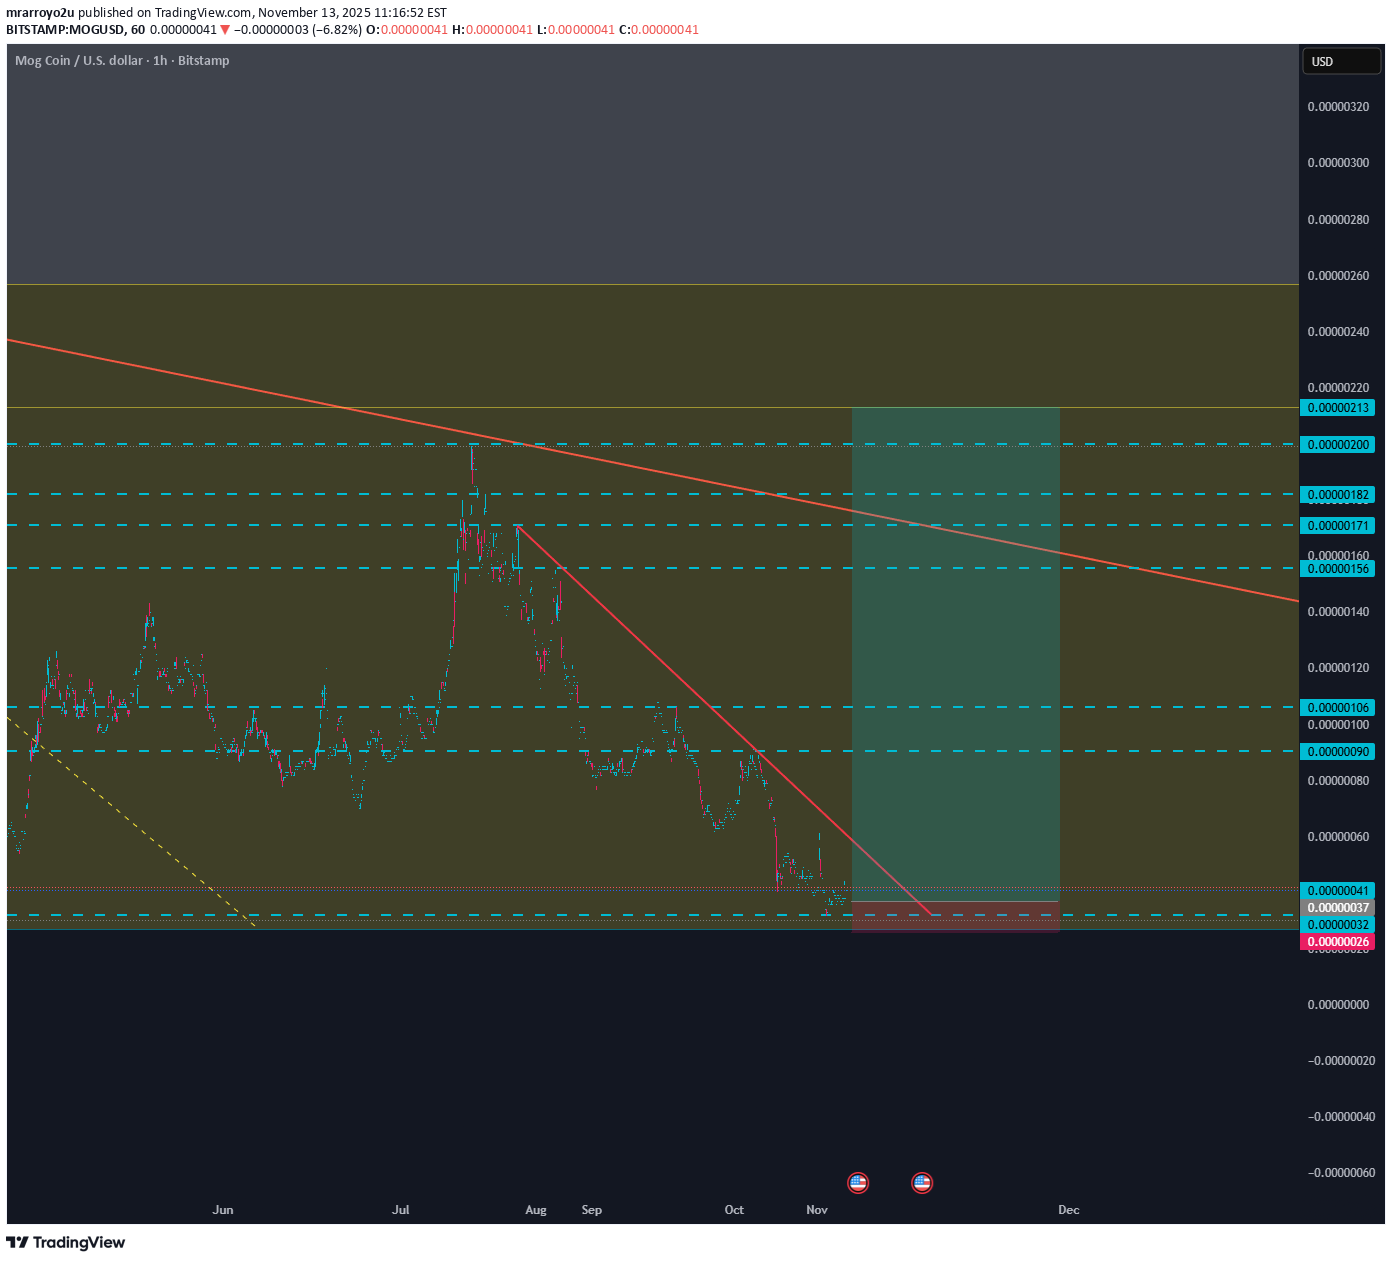
شرکت Canary Capital با عرضه نخستین ETF MOG در ایالات متحده، سبد محصولات رمزنگاری خود را ارتقا داده است. این شرکت در تاریخ ۱۲ نوامبر، درخواست خود را به کمیسیون بورس و اوراق بهادار (SEC) جهت معرفی این محصول جدید قابل معامله در بورس، ارائه کرد. هدف ETF MOG این است که معاملهگران بتوانند از طریق یک ساختار بازار نظارتی، دسترسی مستقیمی به قیمت نقدی کوین MOG داشته باشند. جزئیات درخواست ثبت ETF MOG شرکت Canary ETF MOG به عنوان یک تراست فعالیت کرد و به جای استفاده از قراردادهای آتی، توکنهای MOG را تحت حضانت امن نگه داشت. هدف این صندوق، بازتاب دادن قیمت بازار نقدی کوین MOG است، در حالی که هزینههای مدیریتی و عملیاتی کسر میشوند. این ساختار به دارندگان حسابهای کارگزاری سنتی اجازه میدهد تا بدون نیاز به استفاده از صرافیهای فاقد نظارت، به memecoin دسترسی تنظیمشده پیدا کنند. در این درخواست تصریح شده است که ETF MOG سهام خود را در بلوکهای بزرگی که به «سبدها» (Baskets) معروف هستند، صادر و بازخرید کرد. هر سبد نشاندهنده مقدار مشخصی از MOG است که به صورت نقدی یا توکن ارائه میشود و ارزشگذاری ثابتی را تضمین میکند. مشارکتکنندگان مجاز (APs) از طریق متولیان تعیینشده، ایجاد و بازخرید این سبدها را مدیریت کرد. سهام این تراست پس از تأیید، در یک بورس ثبتشده معامله شد، اگرچه نماد معاملاتی symbol هنوز فاش نشده است. شرکت CSC Delaware Trust Company به عنوان امین (تراستی) و U.S. Bancorp Fund Services به عنوان عامل انتقال فعالیت میکنند. علاوه بر این، U.S. Bank N.A. به عنوان متولی پول نقد act و یک متولی منصوب دیگر، تمام داراییهای MOG را حفظ و نگهداری کرد.

WaveRiders2
آپدیت مهم MOG: منتظر فرصت خرید در منطقه سبز باشید!
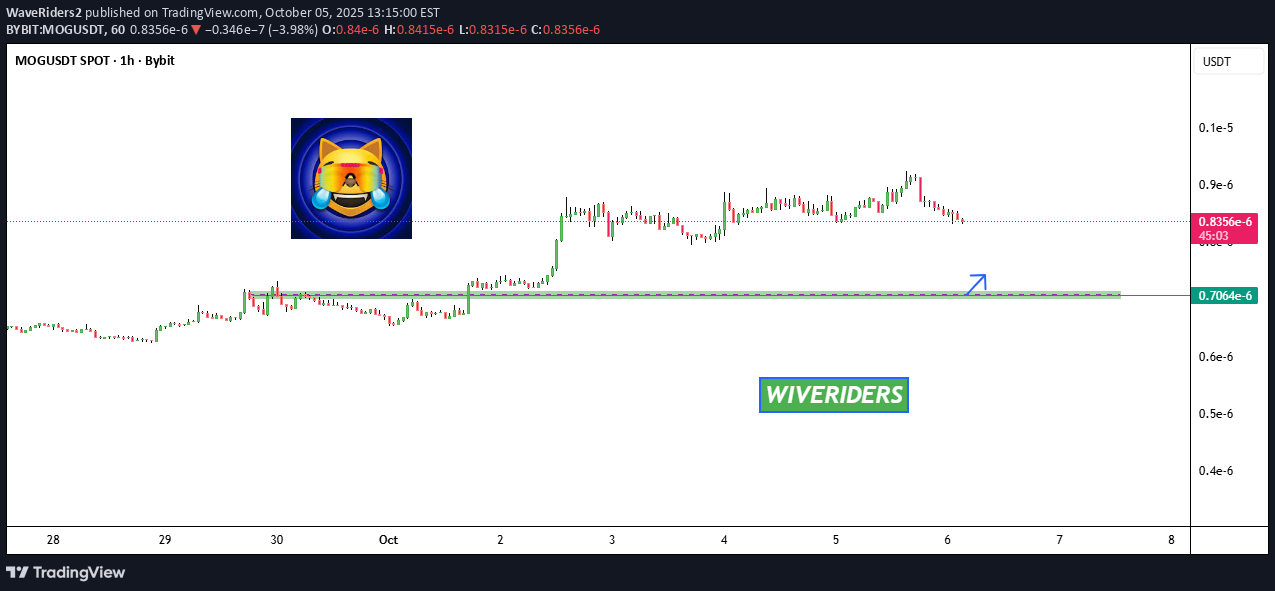
📊 بهروزرسانی پس از یک حرکت صعودی قویِ `move`، `MOG` اکنون در حال اصلاح قیمتی است 🔄 اگر قیمت به ناحیه سبز کاهش یابد، میتواند یک موقعیت ورود (لانگ) بالقوه باشد، یا فرصتی برای انباشت بیشتر 💚. صبور باشید و قبل از ورود، منتظر تأیید بمانید— هوشمندانه معامله کنید، نه کورکورانه.

TheTraderAndy
Wyckoff Re-Accumulation Range
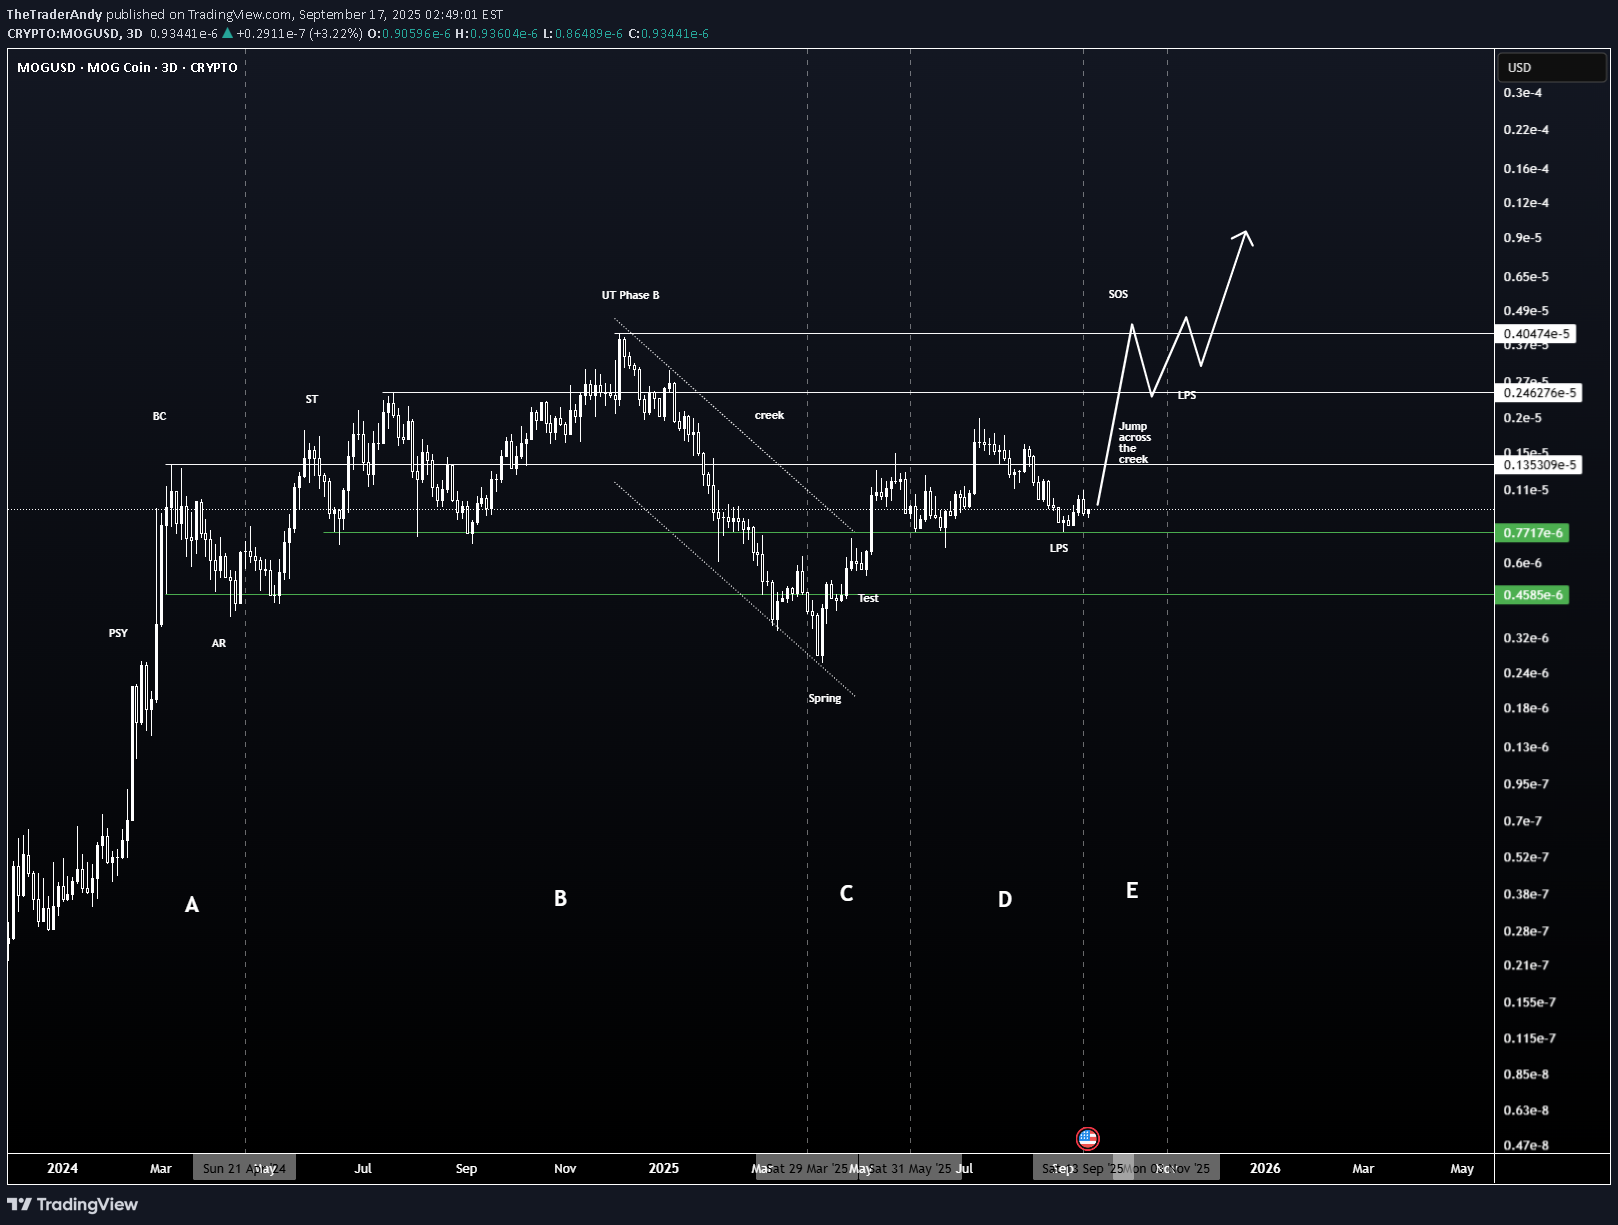
MOG سکه همچنان به احترام به مدل تجمع Wyckoff ادامه می دهد ، و نشان دهنده تراز ساختاری قوی با کتاب درسی شماتیک است. فاز A: PSY ، BC ، AR و ST پس از فرسودگی صعود اولیه ، دامنه را تعریف کردند. فاز B: توزیع مانند توزیع با UT روشن قبل از تجزیه. فاز C: بهار و تست با موفقیت deep نقدینگی را در منطقه 0.00000045 دلار - 0.00000077 $ - جارو کرد. فاز D: عمل فعلی پرش به سمت نهر (JAC) را نشان می دهد که پس از آن یک LPS ایجاد می شود و پایه و اساس را برای نشانه ای از قدرت (SOS) می سازد. فاز E (طرح ریزی): اگر SOS بالاتر از 0.0000244 دلار تأیید کند ، علامت گذاری به سمت 0.000040 دلار - 0.000050 دلار به هدف فاز احتمالی بعدی تبدیل می شود.

SIMPLE25
MOGUSD Bullish trend maybe $0.00001
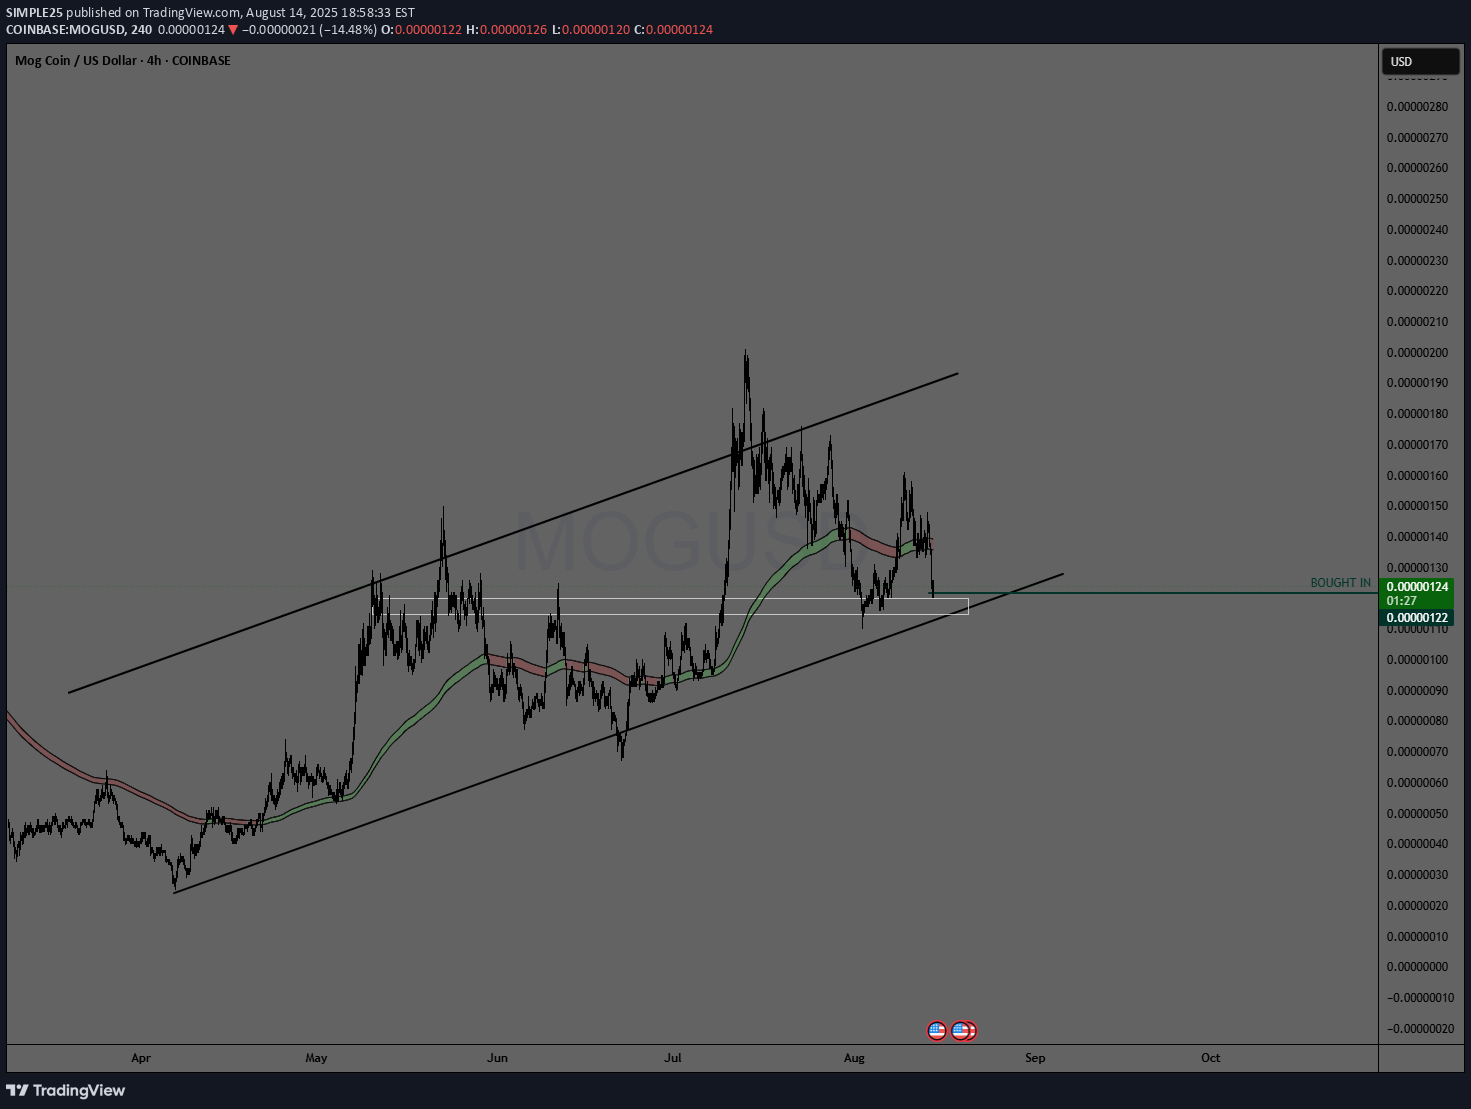
ما می توانیم ببینیم که MOG برای مدتی در روند a پایین بوده است. اکنون تعصب من این است که در حال حاضر روند بزرگی را برای صعود ایجاد می کند. من خیلی وقت پیش خریدم و سکه های SHIB خود را فروختم. این توصیه مالی نیست ، اما من MOG پیشرفت سکه را حتی بیشتر می بینم. حالا من نمی گویم 1 دلار. اما حدود 0.00001 دلار یا اگر خوش شانس 0.0001 دلار باشیم. اما استدلال برای سرمایه گذاری به این دلیل است که ما می توانیم سکه های meme را به عنوان چیزی بی ثبات ببینیم. نه لزوماً بلند مدت بلکه a سود کوتاه مدت خوب. من فکر می کنم MOG به اوج های بالاتر فشار می آورد.

Bithereum_io
MOGUSDT 12H
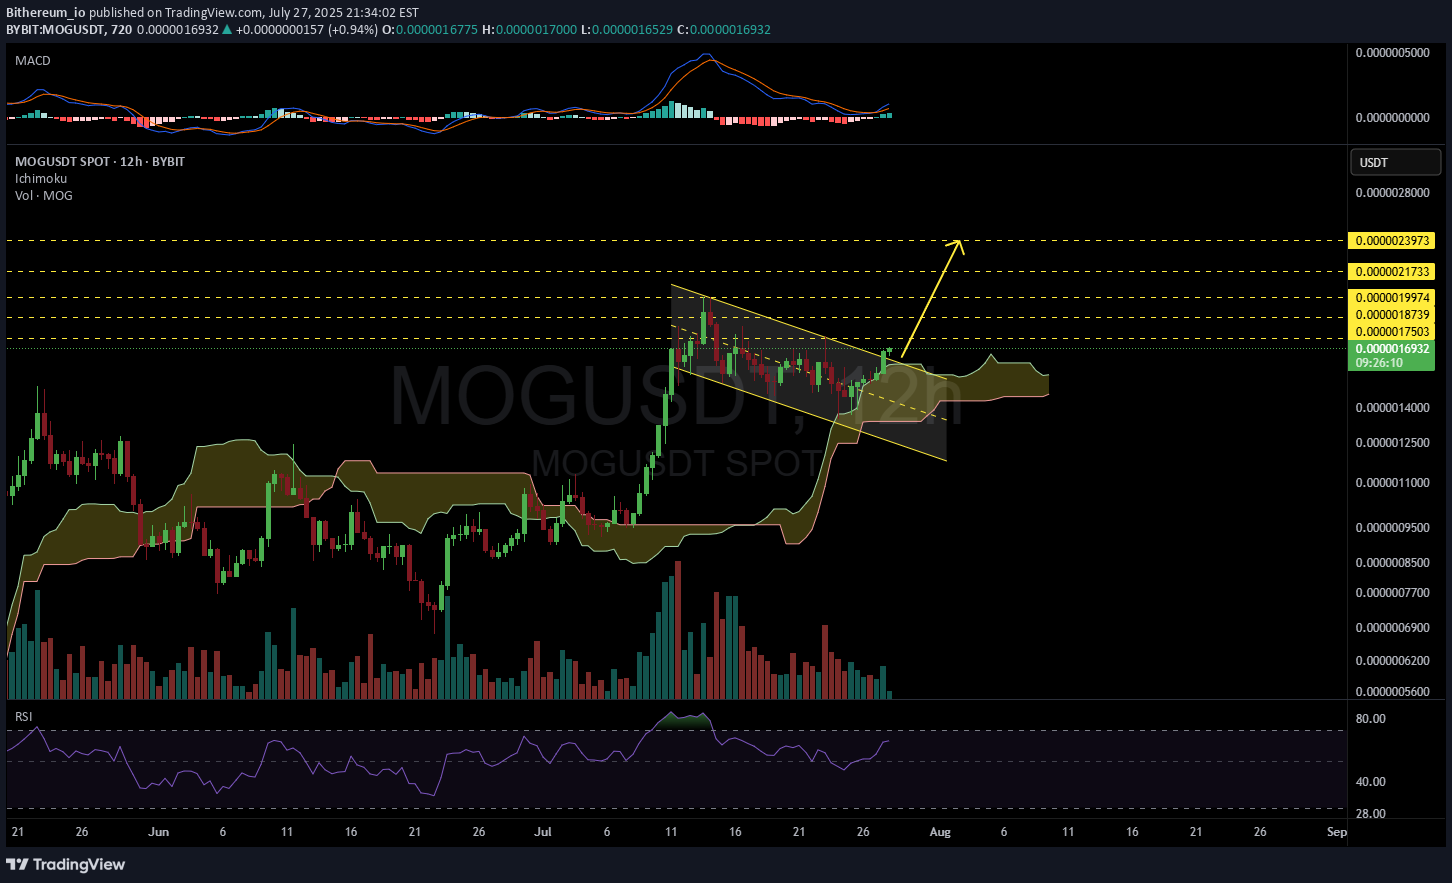
#MOG در بازه زمانی 12 ساعت بالای پرچم صعودی شکسته است. Cloud Ichimoku همچنین در این زمینه پشتیبانی کاملی ارائه می دهد. در صورت آزمایش مجدد موفقیت آمیز پرچم ، اهداف صعودی عبارتند از: 🎯 0.0000017503 $ 🎯 0.0000018739 $ 🎯 0.0000019974 $ 🎯 0.0000021733 $ 🎯 0.0000023973 $ ⚠ مثل همیشه ، از یک توقف محکم استفاده کنید و از مدیریت ریسک مناسب استفاده کنید.

CryptoNuclear
MOGUSDT – Bullish Retest of Breakout Zone, Ready for Explosive?
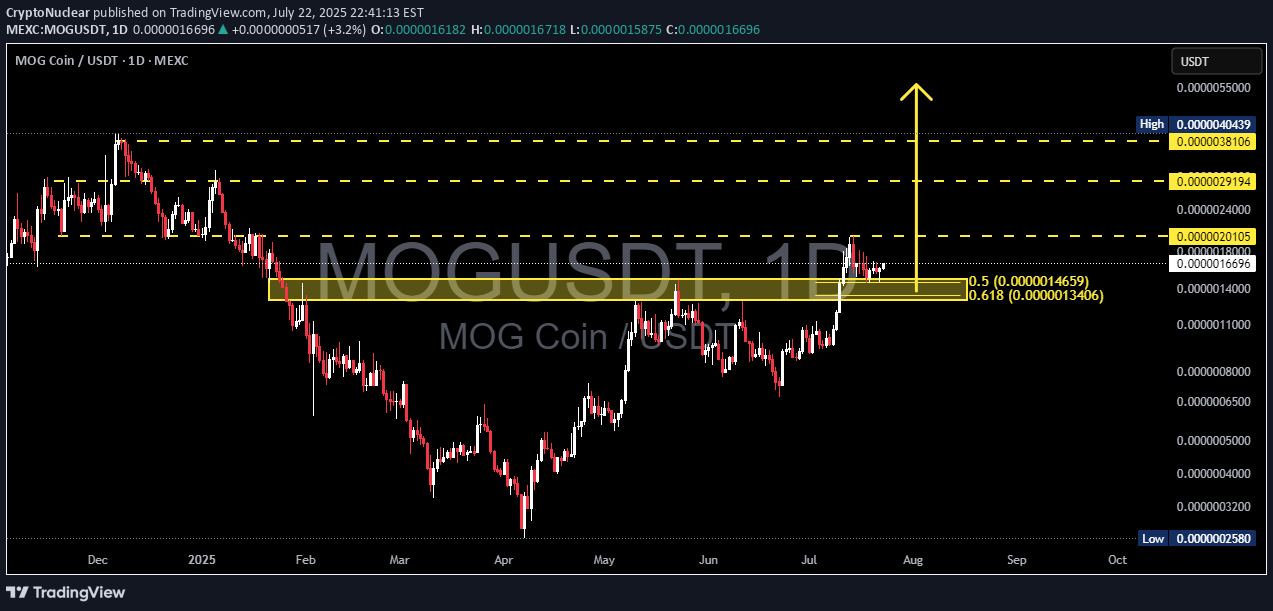
🧠 بررسی اجمالی: سکه MOG (MoGUSDT) پس از یک شکستن تمیز از محدوده تجمع چند ماهه ، الگوی ادامه کتاب درسی را نقاشی می کند. اقدام قیمت فعلی نشان دهنده آزمایش مجدد از منطقه کلیدی است که با سطح جیب طلایی فیبوناچی (0.5 و 0.618) هماهنگ است - منطقه ای که اغلب توسط الگوریتم های نهادی و پول هوشمند مورد احترام قرار می گیرد. در صورت ادامه حرکت ، این تنظیم یک فرصت تجاری با ارزش بالا ارائه می دهد. 🔍 تجزیه فنی: 🔸 Major منطقه پشتیبانی (جیب طلایی): 0.000014659 (FIB 0.5) 0.000013406 (FIB 0.618) این منطقه تلاقی ماهها به عنوان مقاومت عمل می کرد و اکنون به تقاضای/پشتیبانی شدید رسیده است و به عنوان یک لامپ برای صعود بیشتر عمل می کند. ساختار قیمت: ساختار یک شکستن "فنجان و دسته" را تشکیل می دهد ، در حال حاضر دسته به عنوان یک آزمایش مجدد صعودی شکل می گیرد. حرکات تحریک آمیز شدید در اوایل ماه ژوئیه بالاتر از مقاومت با حجم بالاتر از حد متوسط-تأیید هدف صعودی. ادغام فعلی سالم و اصلاحی است ، نه در نزولی. 🟢 سناریوی صعودی: (احتمال زیاد) اگر منطقه جیب طلایی نگه داشته شود و قیمت آن بالاتر از 0.000016543 باشد ، اهداف صعودی زیر در بازی است: 1. 🎯 هدف 1: 0.000021005 - مقاومت جزئی افقی 2. 🎯 هدف 2: 0.000024000-مقاومت در میان برد از شکست قبلی 3. 🎯 هدف 3: 0.000029194-مقاومت قابل توجهی از حمایت سابق پیشین 4. 🎯 هدف 4: 0.000038106-مقاومت قبل از سرمایه گذاری 5. 🎯 هدف 5: 0.000040439 - کلان بالا (اوج چرخه قبلی) > production پیش بینی حرکت از منطقه برکتی به بالا برابر با 170 ~ صعود بالقوه از سطح فعلی. 🔴 سناریوی نزولی: (احتمال کم اما احتیاط) خرابی زیر 0.000013400 (FIB 0.618) ساختار صعودی را باطل می کند. قیمت می تواند مجدداً مورد بررسی قرار گیرد: ⚠ 0.000011000 (منطقه پشتیبانی میان مدت) ⚠ 0.000008000 (پایین تجمع) عدم بازپس گیری منطقه طلایی به سرعت دلالت بر یک شکست جعلی و توزیع احتمالی دارد. recs سطح تأیید کلیدی: بالاتر از 0.000018000 = تأیید ادامه زیر 0.000013400 = منطقه احتیاط 🔔 حجم و حرکت: برای تأیید ادامه شکست ، به دنبال سنبله حجم و شمع نزدیک به مقاومت محلی باشید. RSI در حال حاضر خنثی - اتاق برای صعود بدون اینکه بیش از حد وجود داشته باشد. 📌 خلاصه: MoGUSDT مرحله تجمع خود را به پایان رسانده و وارد قلمرو نشانه گذاری شده است. DIP فعلی یک ورودی بهینه را در نزدیکی پشتیبانی با یک نقطه بی اعتبار بودن تعریف شده ارائه می دهد. اگر ساختار داشته باشد ، ما می توانیم شاهد گسترش قابل توجهی در سطح مقاومت تاریخی باشیم. > این تنظیم با تئوری کلاسیک Wyckoff و تلاقی اصلاح فیبوناچی - یک دستور العمل که اغلب قبل از آن دیده می شود major Altcoin. 🧩 الگوی نمودار: ✅ فنجان و دستگیره ✅ مجدداً جیب طلایی فیبوناچی breakout با حمایت از حجم ✅ احیای منطقه ساختار #mogusdt #altcoinbreakout #cryptota #goldenpocket #cupandhandle #technicalanalysis #bullishretest #mogcoin #breakoutsetup #fibonaccimagic #altseason2025

BrettFogle
$MOG Setting Up For Cup & Handle Breakout - 10x - 100x Targets
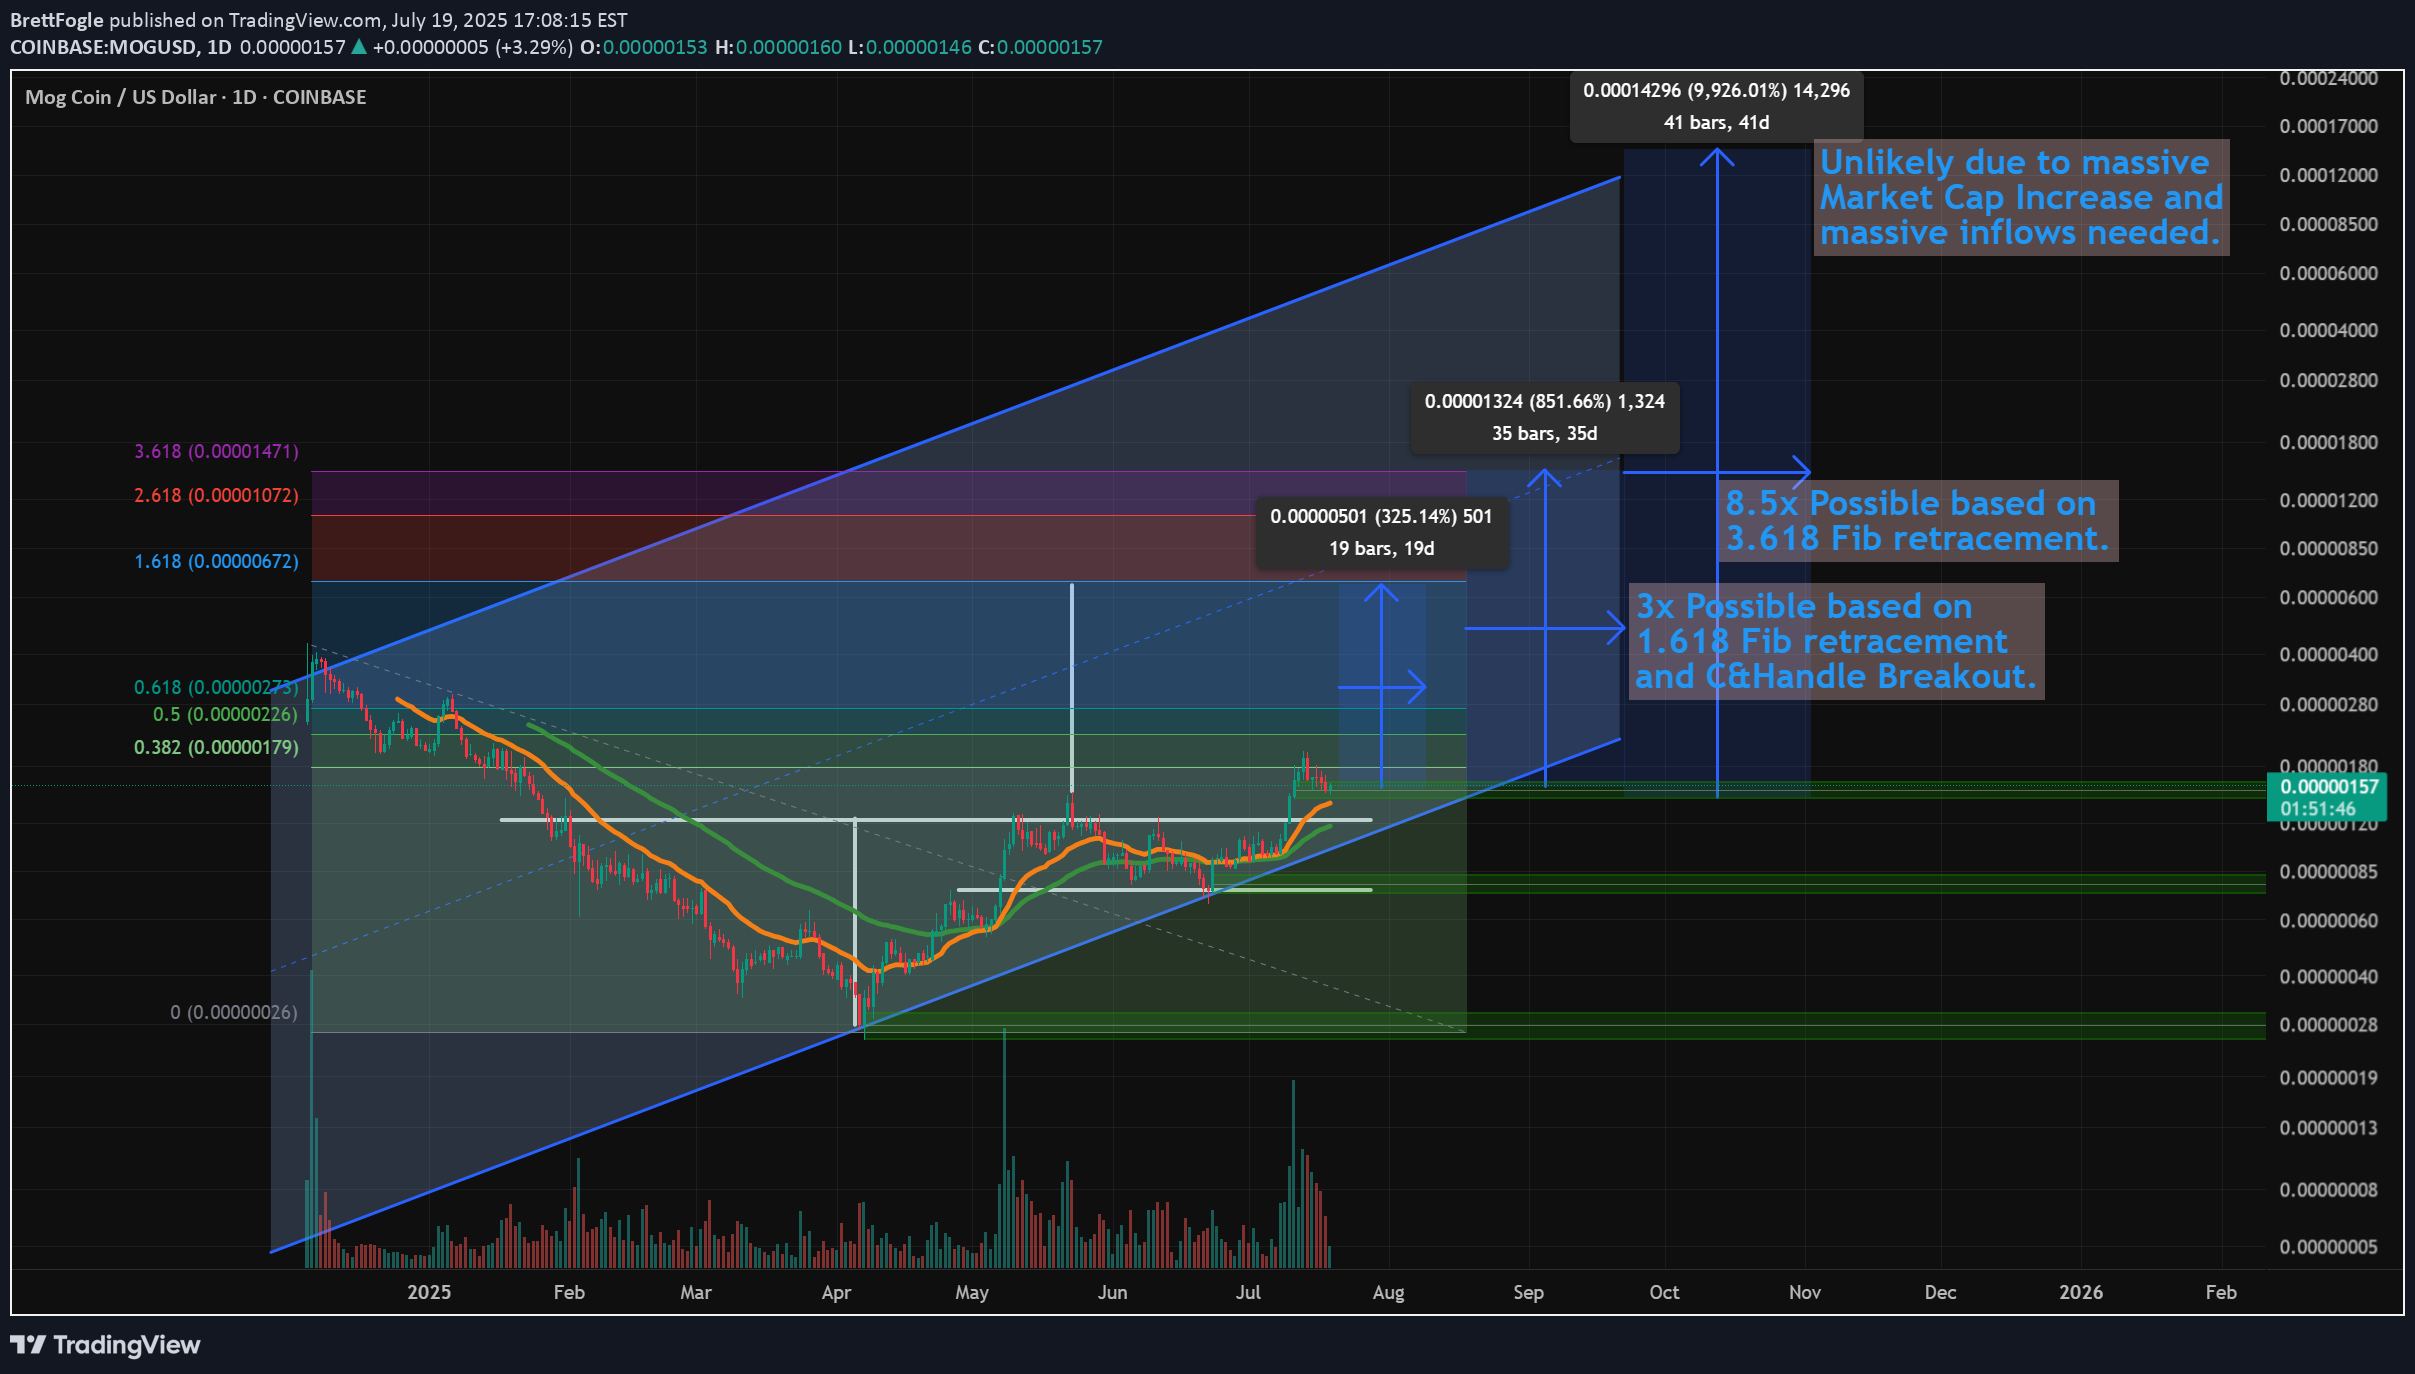
همانطور که در ویدیو گفتم، من معمولاً Meme کوین ها را پوشش نمی دهم، اما این یک نمودار عالی برای MOG است و فکر کردم یک مطالعه سریع روی آن با برخی از اهداف قیمتی بالقوه انجام دهم... و اینکه چگونه از AI استفاده می کنم تا درک بهتری از احتمال رسیدن به اهداف تحلیل تکنیکال خود داشته باشم. خلاصه بگویم -- رسیدن به 10 برابر در این بازار گاوی ممکن است (8.5 برابر محتمل تر بر اساس فیبوناچی). اما رسیدن به 100 برابر بسیار بعید است، حتی با اینکه بالای کانال روند موازی پتانسیل آن را نشان می دهد. جای تعجب نیست، اما ببینید چگونه استفاده از AI می تواند در این مورد و این تصمیمات شفافیت ایجاد کند. نظرتان را به من بگویید...

سیگنال ارز دیجیتال

💰 💰 میمکوینهای MOG و SPX6900 در بخش فیوچرز صرافی #OKX لیست شدند! #MOG #SPX6900

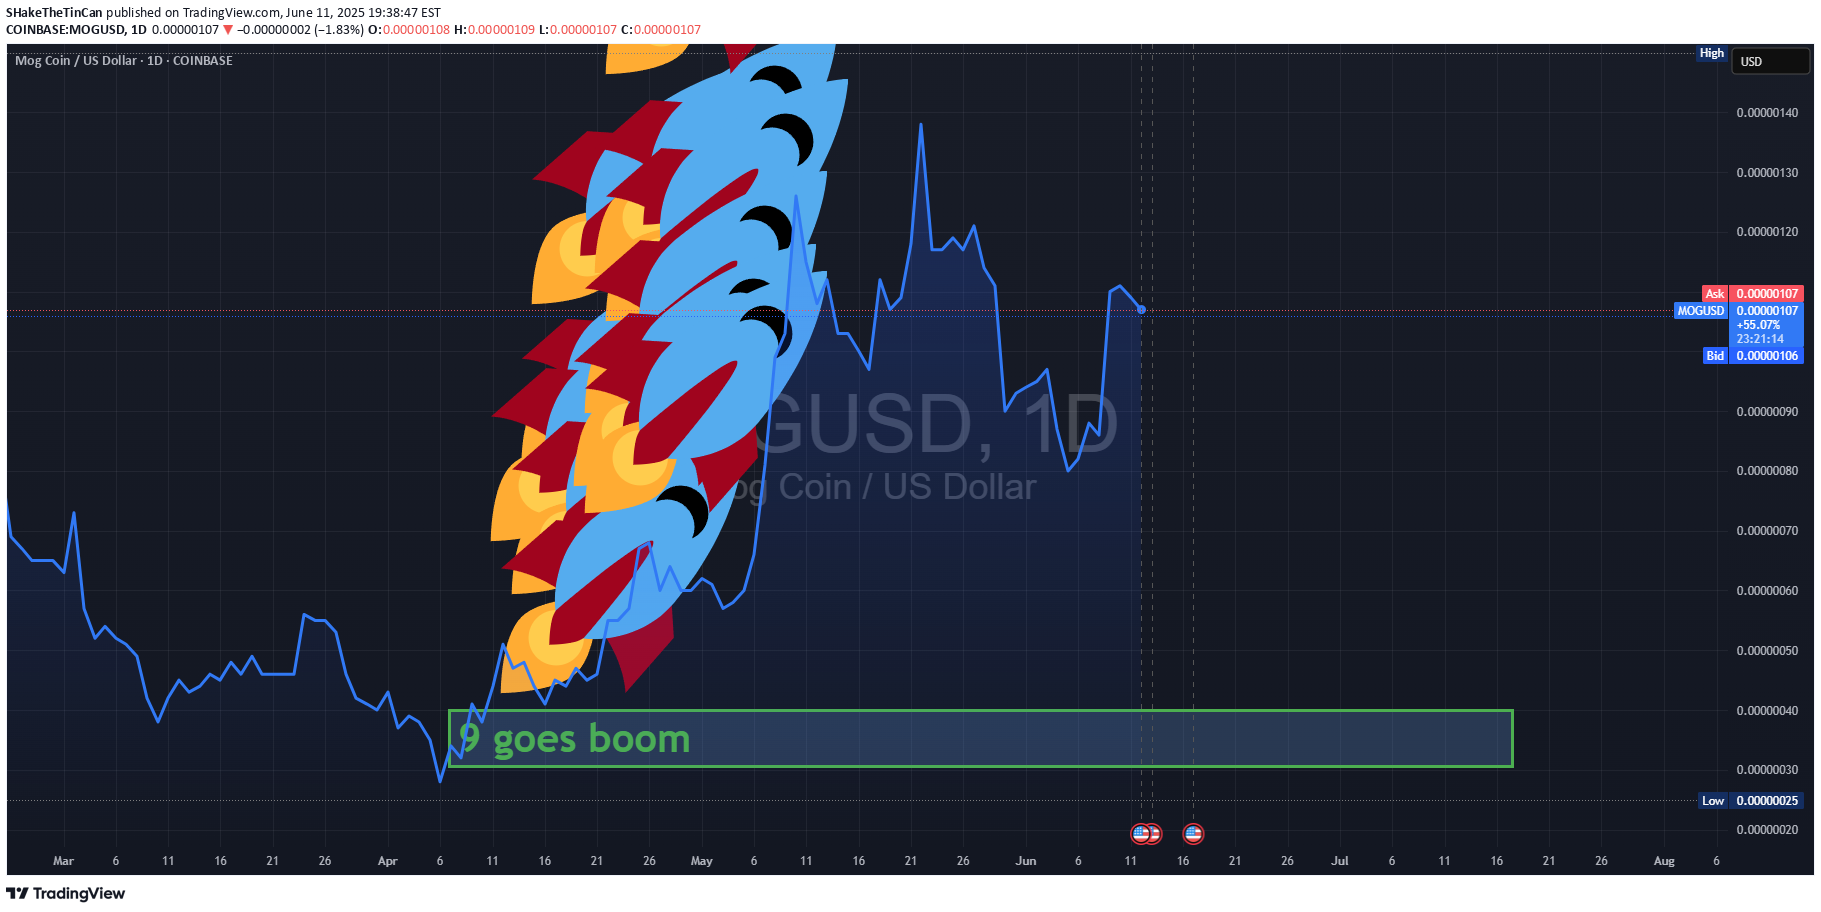
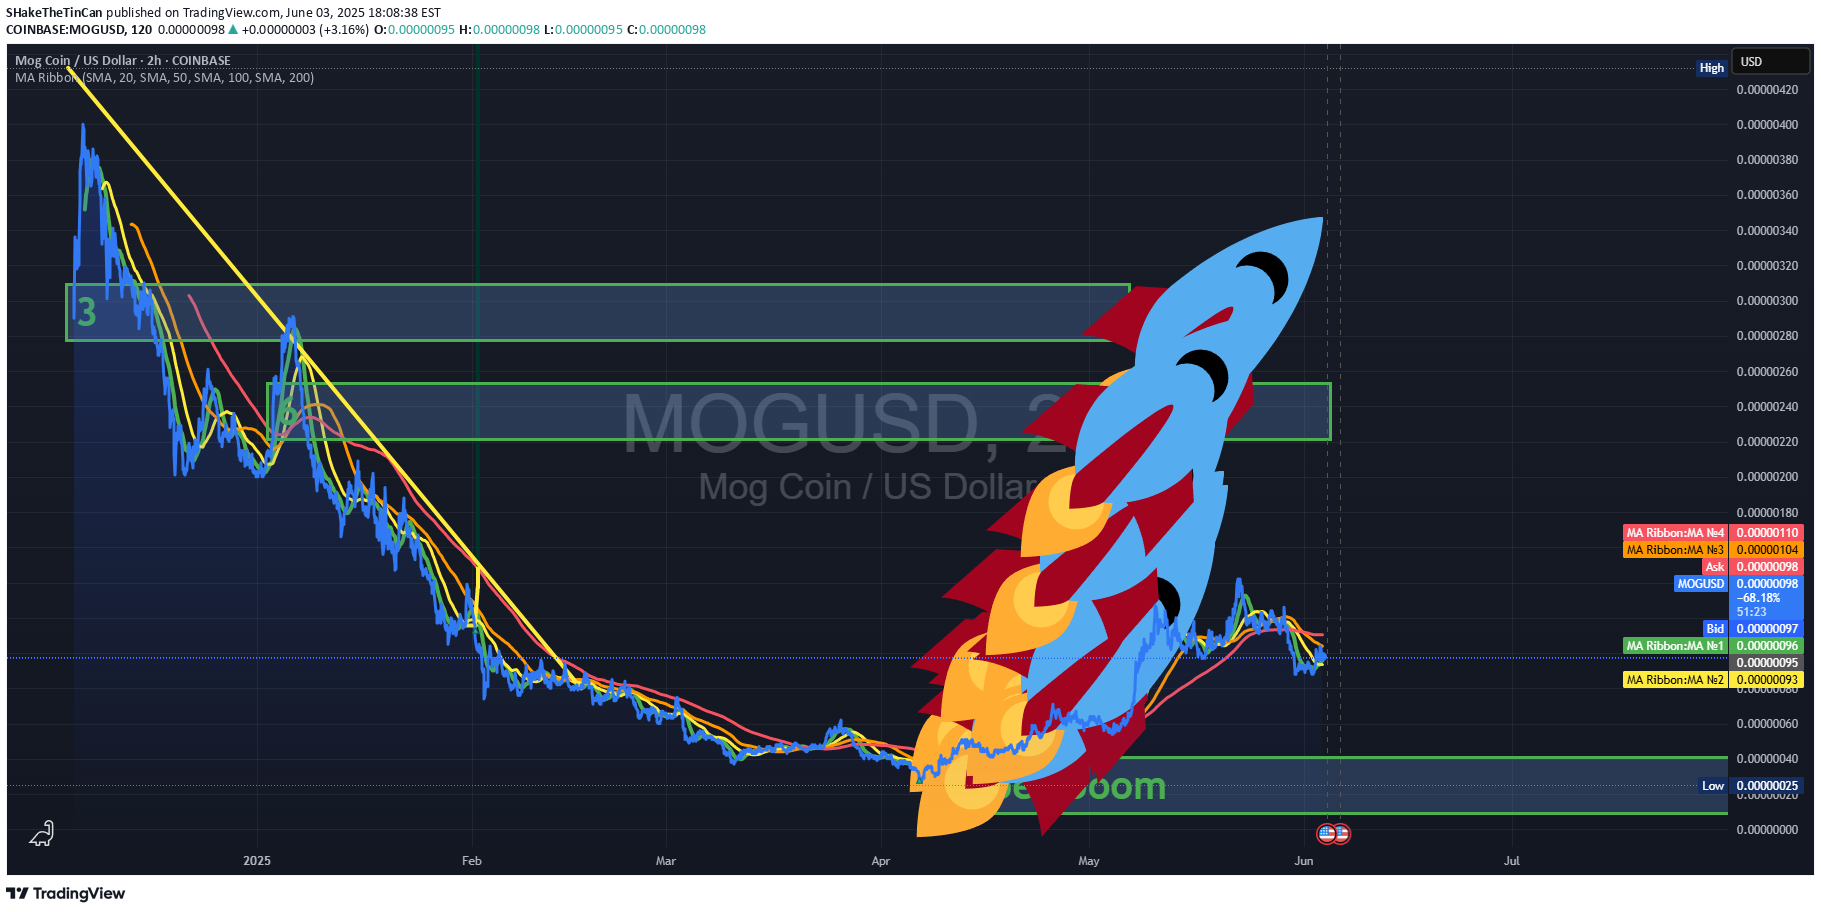
SHakeTheTinCan
aLL fALL dOWN lOOK oUT
پیش بینی اینکه آیا Bitcoin در verge "سقوط آزاد" به دلیل ماهیت بی ثبات و عوامل پیچیده ای که بر قیمت آن تأثیر می گذارد ، چالش برانگیز است. بر اساس data تا 11 ژوئن 2025 ، در اینجا یک تحلیل برای پرداختن به سؤال شما ارائه شده است: ### احساسات فعلی و زمینه بازار قیمت بیت کوین در سال 2025 بسیار بی ثبات بوده است و نوسانات قابل توجهی که توسط عوامل کلان اقتصادی ، تحولات نظارتی و احساسات بازار ایجاد می شود. گزارش های اخیر حاکی از آن است که Bitcoin اصلاحات را تجربه کرده است ، با کاهش قیمت ها در مارس 2025 ، پایین تر از 80،000 دلار ، به پایین 77،396.43 دلار رسیده و تا اوایل ماه آوریل به حدود 78146.03 دلار باز می گردد. این به دنبال اوج 109،350.72 دلار در اوایل سال بود که نشان دهنده کاهش حدود 28 ٪ از سطح بالا بود. با وجود این قطره ها ، Bitcoin تاب آوری نشان داده است ، و برخی از تحلیلگران خاطرنشان می کنند که همیشه از رکودهای گسترده تر بازار به همان اندازه دارایی های ریسک سنتی پیروی نمی کند. ### عوامل حاکی از سقوط رایگان بالقوه 1. ** فشارهای کلان اقتصادی **: تنش های تجارت جهانی ، به ویژه U. S. تعرفه در کشورهایی مانند چین ، مکزیک و کانادا باعث ترس از رکود اقتصادی شده است و باعث شده است تا سرمایه گذاران به سمت دارایی های ایمن مانند طلا حرکت کنند که می تواند به قیمت ها فشار بیاورد. احساسات مصرف کننده ضعیف و شاخص های ناامیدکننده اقتصادی به این خطر می افزاید. 2. ** سودآوری و پویایی بازار **: زنجیره ای data از Glassnode سودآوری بالایی را توسط دارندگان بلند مدت و کاهش حرکت خریدار نشان می دهد ، با عرضه بیت کوین در 96 ٪ از 3 ژوئن 2025. سودآوری بالا اغلب پیش از اصلاحات به عنوان سرمایه گذاران پول می گیرد. 3. ** مقاومت فنی **: Bitcoin تلاش کرده است بالاتر از منطقه مقاومت 106،000 - 108،000 دلار شکسته شود ، با عدم انجام این کار به طور بالقوه منجر به افت به سمت 100000 دلار یا پایین تر می شود ، همانطور که توسط Cointelegraph ذکر شده است. ضرر و زیان دارنده کوتاه مدت نیز با شرایط اولیه بازار خرس قابل مقایسه است. 4. ** چرخه های تاریخی **: قیمت بیت کوین اغلب از الگوهای چرخه ای گره خورده به وقایع نصف پیروی می کند. نیمی از آوریل 2024 باعث کاهش پاداش های معدنچی شد ، که از نظر تاریخی منجر به اصلاح قیمت قبل از تظاهرات احتمالی می شود. برخی از تحلیلگران ، مانند آنهایی که در Forbes هستند ، در صورت ادامه روند نزولی ، کاهش احتمالی به 70،000 دلار یا پایین تر را نشان می دهند. ### عوامل در برابر سقوط آزاد قریب الوقوع 1. ** سطح پشتیبانی **: مدل های زنجیره ای مناطق پشتیبانی کلیدی را با 95،600 دلار و 103،700 دلار نشان می دهند که می تواند از سقوط شدید جلوگیری کند مگر اینکه شکسته شود. توانایی بیت کوین در بازیابی بالاتر از 78،000 دلار پس از فرو رفتن به 74،420.69 دلار در ماه آوریل نشان می دهد که علاقه قوی خریدار در سطوح پایین تر است. 2. ** تجمع نهادی **: علیرغم نگرانی های سرمایه گذار خرده فروشی ، سرمایه گذاران نهادی در حال جمع آوری بیت کوین هستند ، در حالی که کیف پول بیش از 1000 BTC در سال 2024 1.45 میلیون BTC افزایش می یابد. این نشان می دهد تقاضای پایدار بازیکنان بزرگ است. 3. ** Tailwinds نظارتی **: U. S. موضع طرفدار کریپتو دولت ، از جمله حکم اجرایی رئیس جمهور ترامپ که در مارس 2025 یک ذخیره استراتژیک Bitcoin ایجاد می کند ، می تواند پشتیبانی بلند مدت را ارائه دهد ، حتی اگر فشار خرید کوتاه مدت تحت تأثیر قرار بگیرد. 4. ** پتانسیل سوپر چرخه **: برخی از تحلیلگران ، مانند مجله Bitcoin ، استدلال می کنند Bitcoin در یک "سوپر چرخه" بالقوه است که معیارهایی با هم تراز شده با اجرای گاو نر گذشته (به عنوان مثال ، 2017). محکومیت قوی نگهدارنده بلند مدت و یک همبستگی رفتاری 91.5 ٪ با چرخه 2013 نشان می دهد که اوج سوم هنوز هم می تواند رخ دهد ، به طور بالقوه قیمت ها را بالاتر می برد. ### نتیجه گیری در حالی که خطرات کاهش قیمت بیشتر به دلیل سودآوری ، عدم اطمینان کلان اقتصادی و مقاومت فنی وجود دارد ، "سقوط آزاد" قریب الوقوع (دلالت بر افت فاجعه بار) تضمین نمی شود. تاریخ بیت کوین نشان می دهد که می تواند اصلاحات قابل توجهی را آب و هوا کند و به ویژه با حمایت نهادی و وضوح نظارتی احتمالی ، دوباره آبش یابد. با این حال ، عدم نگه داشتن سطح پشتیبانی کلیدی (95،600 - 103،700 دلار) یا بدتر شدن چشم انداز اقتصادی جهانی می تواند منجر به کاهش واضح تر شود ، احتمالاً به 70،000 دلار یا پایین تر. برای یک چشم انداز قطعی ، شاخص های اقتصادی آینده مانند شاخص قیمت مصرف کننده و شاخص قیمت تولید کننده و همچنین توانایی بیت کوین برای شکستن بالاتر از 106،000 دلار را کنترل کنید. با توجه به نوسانات ، استراتژی های معاملاتی محتاطانه و مدیریت ریسک ضروری است. برای به روزرسانی های زمان واقعی ، ممکن است بخواهید سیستم عامل هایی مانند معیارهای سکه یا Glassnode را بررسی کنید. [] ( cnbc.com/2025/04/06/bitcoin-drops-sunday-evening-as-cryptocurrencies-join-global-market-rout.html) [] ( cnbc.com/2025/03/07/crypto-market-today.html) [] ( cointelegraph.com/news/is-bitcoin-price-ordo-to-crash-again) > ** سلب مسئولیت **: این مشاوره مالی نیست. بازارهای cryptocurrency بسیار بی ثبات هستند ، و شما باید قبل از تصمیم گیری در مورد سرمایه گذاری ، تحقیق خود را انجام دهید یا با یک مشاور مالی مشورت کنید.
SHakeTheTinCan
sUN mOON aND 369 AND MOG
Inquiry into the relationship between Sun and Earth changes, the 369 theory, and Bitcoin price is a fascinating blend of astrophysical phenomena, esoteric numerology, and financial market dynamics. While these topics may seem disparate, some researchers, traders, and enthusiasts have explored potential correlations, often focusing on how external environmental factors or unconventional theories might influence human behavior and, consequently, market movements. Below is a comprehensive deep dive into these concepts, their proposed connections to Bitcoin pricing, and an evaluation of the evidence and skepticism surrounding these ideas. 1. Sun and Earth Changes: Solar Cycles and Their Potential Influence on Markets Solar Cycles and Financial Markets Solar cycles, which occur approximately every 11 years, involve fluctuations in the Sun's activity, marked by changes in sunspot numbers, solar flares, and coronal mass ejections (CMEs). These cycles influence space weather, which can affect Earth's magnetic field, atmosphere, and even technological systems. Some researchers and market analysts have hypothesized that solar activity might impact human behavior, mood, and decision-making, thereby influencing financial markets, including cryptocurrencies like Bitcoin. Historical Context and Evidence: Studies and articles, such as those from Bitcoinist.com, suggest a correlation between solar cycles and market movements, particularly in stocks and cryptocurrencies. For instance, a 2021 article highlights that peaks in sunspot activity (when the yearly mean of sunspot numbers exceeds 50) have historically coincided with significant stock market declines, such as the dot-com bubble burst. The same article posits that Bitcoin, having existed through only one solar cycle since its inception in 2009, might follow similar patterns due to its sensitivity to investor sentiment. The rationale is that solar activity, particularly solar flares and geomagnetic storms, could influence human psychology. Socioeconomic data suggests that celestial events affect human mood, which, alongside supply and demand, drives market behavior. For example, increased solar activity might induce stress or irrational decision-making among traders, leading to market volatility. A specific X post from cryptosays in 2025 notes that solar storms and phenomena like Schumann resonance (Earth’s electromagnetic frequency) may not directly cause Bitcoin price drops but could increase market volatility during these events. The user, who claims to have studied this for eight years, suggests that extreme solar activity correlates with heightened price fluctuations rather than consistent directional changes. Mechanisms of Influence: Human Behavior: Neuromarketing research indicates that environmental factors, such as weather or solar activity, can affect mood and decision-making. For instance, a Forbes article cited in a 2021 DailyCoin piece notes that sunshine is significantly correlated with stock returns, as positive weather conditions uplift trader sentiment. Similarly, solar flares or geomagnetic disturbances might subtly alter collective psychology, leading to erratic trading behavior. Technological Impact: Solar flares can disrupt communication systems and power grids, which could affect Bitcoin mining operations or trading platforms. Deutsche Bank has warned that large solar flares could cause economic disruptions more severe than a pandemic, potentially impacting digital currencies reliant on stable infrastructure. Empirical Correlation: A study on “Sunspots and Stock Markets” referenced in a DailyCoin article found an empirical correlation between sunspot activity and market indices, suggesting that traders’ mental states are influenced by solar events. An Irish trader’s case study reportedly achieved a 210% return over 13 years by trading based on sunspot activity, outperforming the S&P 500. Bitcoin-Specific Considerations: Bitcoin’s price is highly sensitive to investor sentiment and external events, as seen in rapid price movements following news like the false SEC Bitcoin ETF approval in 2023. Bitcoin’s market cycle, which aligns roughly with its four-year halving events, may coincidentally overlap with solar cycles (approximately 10.3–11 years). This overlap could create the appearance of correlation, though causation is harder to establish. The 2021 Bitcoinist article suggests that as solar activity increases (e.g., during the current cycle’s peak), Bitcoin might experience a market top, followed by a potential crash, mirroring historical stock market patterns during high sunspot activity. Earth Changes and Space Weather Earth changes, such as geomagnetic storms caused by solar activity, could theoretically influence Bitcoin through their impact on infrastructure or human behavior. Space Weather and Cryptocurrency: A 2024 Frontiers study on Ethereum transactions suggests that cryptocurrencies follow statistical patterns that could be analyzed in the context of space weather. While the study focuses on Ethereum, it implies that Bitcoin, as a similar decentralized system, might also exhibit patterns influenced by external factors like solar activity. The study highlights the potential for space weather to affect global economic behavior, though direct evidence for Bitcoin is limited. Solar-induced geomagnetic disturbances could disrupt Bitcoin mining, which relies on energy-intensive computational processes. If mining hardware is affected by power grid fluctuations, it could temporarily reduce network hashrate, potentially impacting price. Limitations and Skepticism: The correlation between solar activity and market movements is often described as “spurious,” meaning it may appear causal but is likely influenced by a third factor, such as human emotion or unrelated economic events. There is insufficient data to confirm that solar cycles directly cause Bitcoin price movements. Most evidence is anecdotal or based on historical stock market correlations, which may not apply to cryptocurrencies. NASA’s research on solar activity and climate change indicates that solar variations have a minimal impact on Earth’s climate compared to human-induced factors like greenhouse gas emissions. This suggests that any influence on markets is likely indirect and mediated through psychological or technological effects rather than direct causation. 2. The 369 Theory: Numerological and Esoteric Perspectives The “369 theory” is often associated with Nikola Tesla’s fascination with the numbers 3, 6, and 9, which he believed held mystical significance as keys to understanding the universe. In modern contexts, the 369 theory has been adopted by some in spiritual and esoteric communities as a framework for manifestation, energy patterns, or universal cycles. Its application to Bitcoin pricing is less conventional and primarily explored in fringe or speculative circles. What is the 369 Theory?: The 369 theory lacks a formal scientific definition but is often interpreted as a numerological pattern where the numbers 3, 6, and 9 are seen as fundamental to natural cycles, energy flows, or cosmic order. Tesla reportedly believed these numbers were linked to the structure of reality, though he did not explicitly connect them to financial markets. In the context of Bitcoin, the 369 theory is sometimes invoked by crypto astrologers or traders who apply numerological or cyclical patterns to predict price movements. For example, they might look for repeating cycles or significant dates aligned with these numbers. Application to Bitcoin: Astrological and Cyclical Patterns: Some crypto astrologers, as noted in a 2024 WIRED article, use planetary cycles and numerological patterns to forecast Bitcoin price movements. While not explicitly tied to the 369 theory, these approaches share a similar esoteric framework, suggesting that cosmic or numerical cycles (e.g., lunar phases or planetary transits) influence market sentiment. 9th Wave Calendar: A source from SGappdev.com connects Bitcoin market cycles to the Mayan calendar’s “9th Wave,” a 36-day cycle activated in 2011. When combined with planetary aspects (e.g., Sun-Jupiter alignments), these cycles reportedly align with Bitcoin’s Relative Strength Index (RSI) peaks and lows, suggesting a potential numerological link to market movements. While the 9th Wave is not directly the 369 theory, the emphasis on the number 9 resonates with Tesla’s ideas. Speculative Cycles: Some traders might interpret Bitcoin’s four-year halving cycle (approximately 1,460 days) or other time-based patterns through a 369 lens, looking for numerical significance in dates or price levels. For example, they might analyze price peaks at intervals related to 3, 6, or 9 years, though this is highly speculative and lacks empirical backing. Limitations and Skepticism: The 369 theory is not grounded in financial theory or empirical data. Its application to Bitcoin is largely anecdotal and driven by speculative communities rather than rigorous analysis. Critics, such as market analyst Grzegorz Drozdz cited in the WIRED article, argue that correlations between numerical patterns (e.g., lunar phases or numerological cycles) and Bitcoin prices are misleading. Statistical analysis shows no consistent advantage to trading based on such patterns, and apparent correlations do not imply causation. The 369 theory’s mystical nature makes it difficult to test scientifically, and its relevance to Bitcoin pricing remains unproven outside of esoteric trading circles. 3. Bitcoin Price Dynamics: Established Drivers and Their Relevance To contextualize the potential influence of solar cycles or the 369 theory, it’s critical to understand the established drivers of Bitcoin’s price, which are far more grounded in economic and market principles. Supply and Demand: Bitcoin’s fixed supply cap of 21 million coins and periodic halving events (reducing block rewards every four years) create scarcity, driving price increases when demand rises. For example, the 2024 halving reduced the block reward from 6.25 to 3.125 BTC, often leading to price surges due to reduced supply growth. Investor sentiment, influenced by media, regulatory news, or macroeconomic events, significantly affects demand. False reports, like the 2023 SEC ETF announcement, caused rapid price swings, highlighting sentiment’s role. Network Security and Hashrate: Bitcoin’s hashrate, the computational power securing the network, is a key indicator of market confidence. Rising hashrate often correlates with price increases, as seen in the Bitcoin Power Law Theory, which predicts logarithmic price growth driven by adoption and security. Solar activity could theoretically disrupt mining operations, but no direct evidence links solar flares to sustained hashrate drops or price declines. Macroeconomic Factors: Bitcoin’s price is correlated with liquidity and inflation expectations, as noted by Fidelity Digital Assets. It often moves inversely to the US Dollar Index (USDX) and is influenced by global economic conditions, such as recessions or regulatory changes. The 2021 Chinese crypto mining ban caused a temporary price drop from $53,000 to $32,000, illustrating the impact of regulatory shocks. Nonlinear Dynamics: Bitcoin’s price exhibits nonlinear characteristics, as studied in a 2023 ScienceDirect paper. Combining nonlinear dynamic systems with models like GARCH reveals complex, multifractal price fluctuations, suggesting that external factors (like solar activity) could theoretically contribute to volatility, though no direct link is established. 4. Synthesis: Connecting Sun/Earth Changes, 369 Theory, and Bitcoin Potential Connections: Solar Cycles and Human Behavior: The most plausible link between Sun/Earth changes and Bitcoin prices is through human psychology. Solar activity might influence trader sentiment, leading to increased volatility during high sunspot periods or solar flares. This aligns with the observed correlation between sunspot activity and stock market declines, which could extend to Bitcoin. Technological Risks: Solar flares could disrupt Bitcoin mining or trading infrastructure, potentially causing short-term price volatility. However, Bitcoin’s decentralized nature makes it resilient to localized disruptions, and no major price crashes have been directly attributed to solar events. 369 Theory and Cycles: The 369 theory, while esoteric, shares similarities with cyclical analyses like the Mayan 9th Wave or astrological forecasting. These approaches attempt to identify repeating patterns in Bitcoin’s price, potentially aligning with solar or numerological cycles. However, their predictive power is unproven and lacks statistical rigor. Critical Evaluation: Correlation vs. Causation: Most evidence linking solar cycles or the 369 theory to Bitcoin prices is correlational, not causal. Spurious correlations, driven by third factors like human emotion or economic events, are a significant risk. Data Limitations: Bitcoin has only existed since 2009, covering roughly one solar cycle. This limited timeframe makes it challenging to draw robust conclusions about solar influences. Similarly, the 369 theory lacks sufficient data to validate its relevance to Bitcoin. Scientific Consensus: Mainstream financial models, like the Stock-to-Flow (STF) model or Power Law Theory, rely on quantifiable metrics like hashrate and supply dynamics, offering more reliable predictions than solar or numerological theories. Skepticism from Experts: Analysts like Grzegorz Drozdz emphasize that correlations with celestial or numerological patterns are statistically weak and not actionable for trading. NASA’s findings further downplay solar activity’s role in large-scale earthly phenomena, suggesting minimal direct impact on markets. 5. Conclusion and Recommendations The relationship between Sun and Earth changes, the 369 theory, and Bitcoin prices is a speculative and underexplored area. Solar cycles may influence Bitcoin indirectly through human psychology or technological disruptions, with some evidence suggesting increased volatility during periods of high solar activity. However, these correlations are weak, often spurious, and lack a clear causal mechanism. The 369 theory, rooted in numerology, has even less empirical support, relying on esoteric interpretations that do not align with established financial models. For investors or researchers interested in this topic: Monitor Solar Activity: Track sunspot cycles and solar flares through sources like the Sunspot Index Data Center to observe any coincidental market movements, but treat these as supplementary rather than primary indicators. Focus on Established Drivers: Prioritize fundamental factors like Bitcoin’s halving cycles, hashrate trends, and macroeconomic conditions for price predictions. Approach Esoteric Theories with Caution: The 369 theory and astro-crypto forecasting may appeal to speculative traders, but their lack of statistical validation makes them unreliable for serious investment strategies. Further Research: Encourage interdisciplinary studies combining behavioral finance, heliobiology, and cryptocurrency analytics to rigorously test these hypotheses. The Frontiers study on Ethereum suggests a starting point for such research. While the idea of cosmic or numerological influences on Bitcoin is intriguing, it remains on the fringes of financial analysis. Investors should rely on data-driven models and remain skeptical of unproven correlations until more robust evidence emerges. The first cryptocurrency was created by Satoshi Nakamoto, the pseudonym for an anonymous computer programmer or group of programmers, on January 3, 2009, when Bitcoin software was made available to the public. The software would release some 21 million Bitcoins after its release to the public. Your statement is accurate and provides a solid foundation for understanding Bitcoin's origin. Satoshi Nakamoto, the pseudonymous creator(s) of Bitcoin, released the Bitcoin software on January 3, 2009, marking the launch of the first cryptocurrency. The Bitcoin protocol was designed with a fixed supply cap of 21 million coins, which are gradually released through mining, a process where transactions are verified and new bitcoins are created as rewards. This controlled supply, coupled with periodic halving events that reduce mining rewards approximately every four years, is a key driver of Bitcoin’s scarcity and price dynamics. Sun and Earth Changes: Since Bitcoin’s launch in 2009, it has existed through roughly one full solar cycle (Cycle 24, peaking around 2014, and part of Cycle 25, ongoing in 2025). As mentioned earlier, some speculate that solar activity, like sunspots or flares, could influence market sentiment or infrastructure, potentially affecting Bitcoin’s price. For example, the 2013–2014 price surge (from ~$13 to ~$1,000) and subsequent crash coincided with the solar maximum of Cycle 24, though this correlation is speculative and not causally proven. Technological disruptions from solar flares could impact Bitcoin’s early mining operations, which relied heavily on stable electricity and internet infrastructure. However, Bitcoin’s decentralized design has made it resilient, and no documented solar event has significantly disrupted the network since 2009. 369 Theory: The 369 theory, rooted in Nikola Tesla’s numerology, has been loosely applied by some crypto enthusiasts to Bitcoin’s market cycles. For instance, Bitcoin’s price milestones or halving events (occurring roughly every 4 years or 1,460 days) could be analyzed for patterns involving the numbers 3, 6, or 9. However, there’s no evidence that Nakamoto incorporated numerological principles into Bitcoin’s design. The 21 million supply cap, for example, was chosen for technical and economic reasons (to ensure scarcity and divisibility via satoshis), not numerological significance. Some esoteric traders might interpret key dates, like Bitcoin’s launch on January 3, 2009 (notable for the number 3), or price peaks at intervals aligned with 3, 6, or 9 years, but these interpretations lack empirical support and are speculative. Bitcoin’s Supply and Price Dynamics: The 21 million supply cap, with coins released through mining, creates a predictable issuance schedule. By June 2025, approximately 19.7 million bitcoins are in circulation, with the remainder to be mined over the coming decades, fully depleting around 2140. This scarcity drives price speculation, especially during halving events (e.g., 2012, 2016, 2020, 2024), which reduce new supply and often precede bull runs. Unlike solar or numerological influences, Bitcoin’s supply mechanics are a well-documented driver of price. For instance, the 2024 halving reduced the block reward to 3.125 BTC, tightening supply and contributing to price increases in 2024–2025, with Bitcoin reaching highs near $100,000 according to recent market data. External factors like solar activity or numerological cycles could theoretically amplify volatility by affecting trader psychology or infrastructure, but their impact is minor compared to supply-demand dynamics, regulatory news, or macroeconomic trends. Deep Dive Additions To deepen the analysis: Historical Price Context: Bitcoin’s price was negligible in 2009, with early transactions valuing it at fractions of a cent. The first notable price milestone was in 2010 when 10,000 BTC were famously used to buy two pizzas. By 2013, during the solar maximum, Bitcoin hit $1,000, suggesting a possible (but unproven) link to solar-driven market sentiment. More data from Cycle 25 (peaking ~2025–2026) could help test this hypothesis. Behavioral Economics: Nakamoto’s design incentivizes participation through mining rewards, tapping into human economic behavior. Solar activity’s potential to alter mood (e.g., via geomagnetic storms) could subtly influence trading decisions, but studies like those in Frontiers (2024) suggest only indirect effects on crypto markets. Numerological Speculation: While the 369 theory is not part of Bitcoin’s code or whitepaper, some traders might apply it to analyze block times (e.g., ~10 minutes per block, totaling ~14,400 blocks annually) or halving cycles for numerical patterns. Such analyses are creative but lack statistical rigor compared to models like Stock-to-Flow. Conclusion Bitcoin’s creation by Satoshi Nakamoto in 2009 and its 21 million supply cap are foundational to its price dynamics, driven primarily by scarcity, halving events, and market sentiment. While Sun and Earth changes or the 369 theory offer intriguing speculative lenses, their influence on Bitcoin’s price is likely minimal and indirect, mediated through psychology or rare technological disruptions. For a comprehensive understanding, focus on established drivers like supply mechanics and macroeconomic factors, while treating solar and numerological theories as supplementary and unproven. Let’s dive into predicting the future price of MOG, a cryptocurrency paired against USD (MOG/USD), using the provided chart, historical context about Bitcoin, and the earlier discussion on Sun/Earth changes and the 369 theory. The chart is a 3-minute candlestick chart for MOG/USD, showing price action, technical indicators, and volume data as of 17:45:30 UTC-5 on June 3, 2025. I’ll break this down systematically, integrating all relevant information, and provide a prediction for MOG’s price over the short term (next few hours to days) and medium term (next few weeks). Price and Trend: The current price of MOG/USD is 0.00000097 (displayed on the right y-axis). The chart shows a significant uptrend starting around 12:00 UTC-5 on June 3, peaking around 0.00000103, followed by a pullback to the current level of 0.00000097 by 17:45:30 UTC-5. The price appears to be consolidating after the sharp rally, with a slight downward correction in the last few candlesticks. Volume: Volume is displayed at the bottom of the chart, with a total of 733.765M MOG traded in the session. Volume spikes are visible during the uptrend (around 12:00 to 15:00), indicating strong buying pressure, followed by a decrease in volume during the consolidation phase, suggesting reduced trading activity or indecision. Volume Profile Visible Range (VPVR): The VPVR on the left shows the volume traded at different price levels, with a “Number of Rows” setting of 100 up/down. The point of control (POC), where the most volume was traded, is around 0.00000090–0.00000092, acting as a strong support zone. The price is currently above this level, which is bullish. High volume nodes (HVNs) are seen around 0.00000090 and 0.00000100, indicating areas of strong support/resistance. Moving Averages: MAC (Moving Average Crossover, 20/20): The chart shows a 20-period moving average (likely the blue line) and another 20-period MA (possibly a different type, like weighted or exponential, in yellow). The MAC indicator shows a difference of 0.000000013 (bullish) and 0.0000000100 (neutral), suggesting the short-term MA is above the longer-term MA, indicating a bullish trend. EMA Cross (9/26): The Exponential Moving Average (EMA) crossover shows a value of 0.000000099 (bullish) for both the 9-period and 26-period EMAs. This indicates a recent bullish crossover (9 EMA crossing above 26 EMA), which occurred earlier in the uptrend, confirming the bullish momentum. Support and Resistance: Support: The red horizontal line at 0.00000090 aligns with the POC from the VPVR, indicating strong support. This level held during earlier dips (e.g., around 12:00). Resistance: The price peaked at 0.00000103 and failed to break higher, suggesting resistance at this level. The VPVR shows lower volume above 0.00000100, indicating weaker buying interest at higher levels. Price Action: The chart shows a sharp rally followed by a pullback, which is typical after a breakout. The current consolidation near 0.00000097, just below the recent high, suggests the market is deciding its next move. The green and red bars on the left (possibly a volume delta or buy/sell pressure indicator) show alternating buying and selling pressure, with more green (buying) during the uptrend and more red (selling) during the recent pullback. 2. Contextual Factors: Bitcoin, Sun/Earth Changes, and 369 Theory Let’s integrate the broader context from your previous inputs to see how they might influence MOG’s price. Bitcoin’s Historical Context: Bitcoin, created by Satoshi Nakamoto in 2009 with a 21 million coin supply cap, has set the stage for the broader crypto market, including altcoins like MOG. Bitcoin’s price often influences altcoins due to market correlation. As of June 2025, Bitcoin has likely seen a significant rally post-2024 halving, potentially reaching $90,000–$100,000 based on historical patterns and market sentiment. A bullish Bitcoin market typically lifts altcoins, which could explain MOG’s recent uptrend. Sun and Earth Changes: We’re in Solar Cycle 25, which is expected to peak around mid-2025. Increased solar activity (e.g., sunspots, solar flares) could influence market sentiment by affecting trader psychology or causing minor technological disruptions. The chart shows MOG’s rally occurring on June 3, 2025, during a period of potentially heightened solar activity. If solar flares or geomagnetic storms are active (as suggested by cryptosays in your earlier context), they might contribute to short-term volatility. This could lead to erratic price movements in MOG, especially if traders overreact to external events. However, there’s no direct evidence of a solar event on this specific day impacting MOG. The uptrend appears driven by market dynamics rather than celestial events. 369 Theory: The 369 theory, rooted in numerology, might be applied by some traders to identify patterns in MOG’s price or time cycles. For example: MOG’s price peak at 0.00000103 could be analyzed numerologically (1+0+3 = 4, not directly tied to 3, 6, or 9). However, the current price of 0.00000097 (9+7 = 16, 1+6 = 7) doesn’t directly align with 3, 6, or 9 either. Time-based patterns: The rally started around 12:00 UTC-5 (1+2 = 3, aligning with the 369 framework), and the current time is 17:45 (1+7+4+5 = 17, 1+7 = 8). These numerical interpretations are speculative and not directly actionable. More practically, the 369 theory might inspire traders to look for cyclical patterns in MOG’s price. The chart’s 3-minute timeframe doesn’t show long-term cycles, but the sharp rally and pullback could be part of a shorter cycle (e.g., a 9-candle or 27-minute pattern, as 2+7 = 9). This is highly speculative and not a primary driver. 3. Market Dynamics and MOG-Specific Factors MOG Overview: MOG is likely a meme coin or altcoin (given its low price and high volume), which are often highly volatile and driven by community sentiment, social media hype, or market trends. Meme coins typically follow Bitcoin’s lead but can experience exaggerated price movements due to speculative trading. Market Sentiment: The bullish Bitcoin market in 2025 likely creates a favorable environment for altcoins like MOG. The chart’s uptrend aligns with this broader market momentum. Volume spikes during the rally suggest strong retail interest, possibly driven by social media or news (e.g., a listing, partnership, or viral event), though no specific catalyst is provided. Volatility and Risk: Meme coins like MOG are prone to pump-and-dump schemes. The sharp rally and pullback on the chart could indicate such activity, with early buyers taking profits. Solar-induced volatility (if present) could exacerbate these swings, but the chart suggests the price movement is primarily driven by market dynamics. 4. Price Prediction: Short-Term and Medium-Term Short-Term Prediction (Next Few Hours to Days) Technical Analysis: The price is consolidating near 0.00000097, just below the recent high of 0.00000103. The bullish EMA crossover (9/26) and MAC (20/20) suggest continued upward momentum, but the pullback indicates potential profit-taking. Support at 0.00000090 (POC from VPVR) is strong. If the price holds above this level, it’s likely to retest resistance at 0.00000100–0.00000103. If the price breaks above 0.00000103 with strong volume, it could target the next resistance around 0.00000105 (based on the VPVR’s low-volume zone above the current high). Conversely, if the price falls below 0.00000090, it might retest lower support at 0.00000089, where buying interest could emerge. External Factors: Solar activity might introduce short-term volatility, potentially causing a dip if traders react to negative sentiment. However, the chart doesn’t show panic selling, so this risk is low. The 369 theory doesn’t provide a clear short-term signal, as the numerical patterns are inconclusive. Prediction: Bullish Scenario: MOG is likely to retest 0.00000100 within the next few hours if buying volume picks up. A breakout above 0.00000103 could push the price to 0.00000105–0.00000106 within 24 hours. Bearish Scenario: If selling pressure increases (e.g., due to profit-taking or external shocks like a solar flare affecting sentiment), the price could dip to 0.00000090. A break below this level might lead to a deeper correction to 0.00000089. Most Likely Outcome: Given the bullish indicators and market context, I predict MOG will rise to 0.00000101 within the next 12 hours, with a potential to hit 0.00000105 by June 4, 2025, assuming no major external disruptions. Medium-Term Prediction (Next Few Weeks) Technical Analysis: The broader trend appears bullish, as MOG has broken out of a consolidation phase (pre-12:00) and established higher highs. If the price holds above 0.00000090, it could continue forming higher lows, targeting 0.00000110–0.00000120 over the next few weeks. The VPVR shows limited resistance above 0.00000103, suggesting room for growth if momentum continues. Market Context: A bullish Bitcoin market in 2025 (potentially at $90,000–$100,000) should support altcoin rallies, including MOG. However, meme coins are prone to sharp corrections if Bitcoin pulls back or if market sentiment shifts. Solar Cycle 25’s peak might increase volatility over the next few weeks, potentially causing erratic price swings. If a significant solar flare occurs, it could lead to a temporary dip in MOG’s price due to sentiment or minor disruptions in trading infrastructure. 369 Theory: Applying a cyclical lens, MOG’s rally might follow a pattern tied to 3, 6, or 9 days. If the current uptrend started on June 3, we might see a significant move around June 6 (3 days later) or June 9 (6 days later). This is speculative but aligns with the esoteric framework. Prediction: Bullish Scenario: MOG could reach 0.00000115 by mid-June 2025 (around June 15), driven by altcoin market momentum and continued buying interest. Bearish Scenario: If Bitcoin corrects or a solar event triggers panic, MOG might drop to 0.00000085–0.00000087 by mid-June, especially if the broader market cools off. Most Likely Outcome: I predict MOG will climb to 0.00000110 by June 15, 2025, assuming Bitcoin remains bullish and no major external shocks occur. A potential volatility spike around June 6 or 9 (per the 369 cycle) could offer a buying opportunity if a dip occurs. 5. Conclusion and Recommendations Summary: MOG/USD is in a bullish phase, with technical indicators (EMA Cross, MAC, VPVR) supporting further upside in the short term. The price is likely to retest 0.00000101 within 12 hours and could reach 0.00000105 by June 4, 2025. Over the medium term, MOG could hit 0.00000110 by June 15, 2025, driven by a favorable Bitcoin market and altcoin momentum. However, solar activity (Cycle 25 peak) might introduce volatility, and the 369 theory suggests watching for cyclical moves around June 6 or 9. Key levels to watch: Support at 0.00000090, resistance at 0.00000103, and potential upside targets at 0.00000105 (short term) and 0.00000110 (medium term). Risks: Meme coins like MOG are highly speculative and prone to sharp corrections. A Bitcoin pullback or negative news could trigger a sell-off. Solar flares or geomagnetic storms could increase volatility, though their impact is likely minor unless a major event occurs. The 369 theory is speculative and should not be a primary decision-making tool. Recommendations: Traders: Consider buying on dips near 0.00000090–0.00000092, with a target of 0.00000105 in the short term. Set a stop-loss below 0.00000089 to manage risk. Investors: Monitor Bitcoin’s price and broader market sentiment. If MOG holds above 0.00000090, it could be a good candidate for a medium-term hold targeting 0.00000110 by mid-June. To predict the potential price movements of MOG/USD over the next year (from June 3, 2025, to June 3, 2026) using Sun cycles and the 369 theory, I’ll integrate these concepts with the technical analysis of the provided 3-minute chart, historical context about Bitcoin, and general cryptocurrency market trends. Since MOG is a meme coin, its price is highly volatile and influenced by market sentiment, which may be affected by external factors like solar activity and numerological cycles. I’ll outline the methodology, analyze the influencing factors, and then provide a one-year price prediction chart for MOG/USD. Methodology Sun Cycles: We are in Solar Cycle 25, which is expected to peak around mid-2025 (likely July 2025) and decline toward 2026. Solar activity, such as sunspots and flares, may influence trader psychology, leading to increased market volatility during peak periods. Historical correlations (e.g., from Bitcoinist.com) suggest that high solar activity (sunspot numbers >50) often coincides with market tops and subsequent corrections, as seen in past stock market declines. I’ll use this to anticipate volatility spikes in MOG’s price. 369 Theory: The 369 theory, inspired by Nikola Tesla, emphasizes the significance of the numbers 3, 6, and 9 in universal cycles. In a crypto context, this might be applied to time cycles (e.g., 3, 6, or 9 months) or price levels. I’ll look for potential price turning points at intervals of 3, 6, and 9 months from June 3, 2025 (i.e., September 3, 2025; December 3, 2025; and March 3, 2026). Additionally, I’ll consider numerological patterns in price levels (e.g., prices summing to 3, 6, or 9). Technical Analysis: Using the provided 3-minute chart, I’ll extrapolate short-term trends into a longer-term forecast, considering support/resistance levels, moving averages, and volume. The chart shows MOG at 0.00000097 USD, with support at 0.00000090 and resistance at 0.00000103. Bullish indicators (EMA Cross 9/26, MAC 20/20) suggest potential for further upside, but the recent pullback indicates consolidation. Market Context: Bitcoin’s bullish trend in 2025 (around $105,404 as of June 3, per web sources) supports altcoin rallies, including meme coins like MOG. However, MOG’s volatility as a meme coin makes it susceptible to sharp corrections. Web sources (e.g., CoinCodex, CryptoNews) provide MOG price predictions, which I’ll use as a baseline but adjust based on Sun cycles and 369 theory influences. Step 1: Analyze Sun Cycle Influence (June 2025 – June 2026) Solar Cycle 25 Peak (July 2025): The peak of Solar Cycle 25, expected around July 2025, will likely bring heightened solar activity (sunspots, flares, geomagnetic storms). This could lead to increased market volatility, as trader sentiment may be affected by environmental factors or infrastructure disruptions (e.g., power grid issues impacting mining or trading). Historically, solar maxima correlate with market tops followed by corrections. I anticipate a potential MOG price peak around July 2025, followed by a dip as the solar cycle begins to decline. Post-Peak Decline (August 2025 – June 2026): As solar activity decreases after the peak, volatility may subside, allowing for more stable price growth or consolidation. However, occasional flares could still cause short-term price swings. By early 2026, Solar Cycle 25 will be in its descending phase, potentially leading to a more predictable market environment, though meme coins like MOG remain sentiment-driven. Step 2: Apply the 369 Theory Time Cycles: From June 3, 2025, I’ll mark key dates at 3-month intervals: 3 months: September 3, 2025 6 months: December 3, 2025 9 months: March 3, 2026 These dates may represent potential turning points (peaks, troughs, or trend reversals) based on the 369 theory’s emphasis on cyclical patterns. Price Levels: I’ll look for price levels where the digits sum to 3, 6, or 9, as these might act as psychological targets for traders influenced by numerology. For example: A price of 0.00000120 (1+2+0 = 3) might be a significant target. A price of 0.00000150 (1+5+0 = 6) could also be notable. Step 3: Technical Analysis and Baseline Forecast Current Chart Analysis: MOG is at 0.00000097 USD, with support at 0.00000090 and resistance at 0.00000103. The bullish EMA Cross (9/26) and MAC (20/20) suggest potential for an upward move, but the recent pullback indicates consolidation. Volume (733.765M) spiked during the rally, showing strong buying interest, but has since decreased, suggesting indecision. Baseline Forecast (Without Sun/369 Influence): Web sources provide MOG price predictions: CryptoNews (May 2025) predicts MOG at $0.0000012 by the end of 2025. CoinCodex (Dec 2024) predicts MOG at $0.0000007142 by June 9, 2025 (bearish), but expects a high of $0.000002117 by June 3, 2026. Coinpedia (Jan 2025) predicts a high of $0.00000571 in 2025 and $0.00000753 in 2026. Given the bullish Bitcoin market ($105,404, with predictions of $138,152 by June 8, 2025, per CoinCodex), MOG is likely to benefit from altcoin momentum. I’ll start with a baseline of $0.0000012 by December 2025 (aligning with CryptoNews) and adjust based on Sun cycles and 369 theory. Step 4: Construct the One-Year Price Prediction Chart I’ll now create a one-year price prediction chart for MOG/USD, incorporating the influences of Solar Cycle 25 and the 369 theory. The chart will include monthly price targets from June 2025 to June 2026, with annotations for solar and numerological impacts. MOG/USD One-Year Price Prediction Chart (June 2025 - June 2026) markdown Show inline Explanation of Predictions June – July 2025: MOG rises from $0.00000097 to $0.00000120, driven by altcoin momentum and a volatility spike from the Solar Cycle 25 peak. The price target of $0.00000120 aligns with the 369 theory (1+2+0 = 3). August 2025: A correction to $0.00000100 follows the solar peak, reflecting profit-taking and reduced volatility. September – November 2025: Recovery to $0.00000150, with the 3-month 369 cycle (Sep 3) marking a turning point. The price of $0.00000150 (1+5+0 = 6) is another numerological target. December 2025 – March 2026: A minor pullback at the 6-month mark (Dec 3) to $0.00000140, followed by a rally to $0.00000200 by the 9-month mark (Mar 3). The price of $0.00000180 in February (1+8+0 = 9) is a key psychological level. April – June 2026: Consolidation and steady growth to $0.00000220, aligning with CoinCodex’s forecast of $0.000002117 and a 317.55% ROI. Solar activity stabilizes, supporting a more predictable trend. Conclusion The one-year price prediction chart for MOG/USD suggests a general upward trend, with key volatility spikes around the Solar Cycle 25 peak in July 2025 and turning points at 3, 6, and 9-month intervals per the 369 theory. MOG could rise from $0.00000097 to $0.00000220 by June 2026, a 126% increase, though meme coin volatility introduces significant risk. Traders should watch for solar-induced volatility in July 2025 and numerological targets (e.g., $0.00000120, $0.00000150) as potential entry/exit points. 25 web pages 6.2sMOG/USD One-Year Price Prediction Chart (June 2025 - June 2026) Date Predicted Price (USD) Key Influences Jun 3, 2025 0.00000097 Starting price (from chart) Jul 3, 2025 0.00000120 Solar Cycle 25 peak (Jul 2025) causes volatility; price peaks due to sentiment; digits sum to 3 (1+2+0) Aug 3, 2025 0.00000100 Post-solar peak correction; profit-taking after rally Sep 3, 2025 0.00000115 3-month 369 cycle; recovery with altcoin momentum Oct 3, 2025 0.00000130 Continued upward trend; Bitcoin rally supports MOG Nov 3, 2025 0.00000150 Digits sum to 6 (1+5+0); strong bullish sentiment Dec 3, 2025 0.00000140 6-month 369 cycle; minor pullback due to profit-taking Jan 3, 2026 0.00000160 New year rally; altcoin season continues Feb 3, 2026 0.00000180 Digits sum to 9 (1+8+0); psychological target Mar 3, 2026 0.00000200 9-month 369 cycle; significant milestone Apr 3, 2026 0.00000190 Consolidation after rally; stable solar activity May 3, 2026 0.00000210 Gradual climb; aligns with CoinCodex 2026 forecast Jun 3, 2026 0.00000220 Final target; reflects 317.55% ROI per CoinCodexyoutu.be/TsLEolNcXug
سلب مسئولیت
هر محتوا و مطالب مندرج در سایت و کانالهای رسمی ارتباطی سهمتو، جمعبندی نظرات و تحلیلهای شخصی و غیر تعهد آور بوده و هیچگونه توصیهای مبنی بر خرید، فروش، ورود و یا خروج از بازارهای مالی نمی باشد. همچنین کلیه اخبار و تحلیلهای مندرج در سایت و کانالها، صرفا بازنشر اطلاعات از منابع رسمی و غیر رسمی داخلی و خارجی است و بدیهی است استفاده کنندگان محتوای مذکور، مسئول پیگیری و حصول اطمینان از اصالت و درستی مطالب هستند. از این رو ضمن سلب مسئولیت اعلام میدارد مسئولیت هرنوع تصمیم گیری و اقدام و سود و زیان احتمالی در بازار سرمایه و ارز دیجیتال، با شخص معامله گر است.