
Terrapins
@t_Terrapins

What symbols does the trader recommend buying?
Purchase History
پیام های تریدر
Filter
Signal Type
Terrapins
The Convertible Trap --- Part One: The Architecture December 2024 Marcus Chen stood before the floor-to-ceiling windows of his corner office on the 47th floor of One Manhattan West, watching the city blur into twilight. The Bloomberg terminal on his desk glowed with a constellation of green numbers—Bitcoin had just crossed $110,000, and MicroStrategy's stock was up another 15% for the day. As Chief Investment Officer at Sovereign Capital Management, overseeing $480 billion in assets, he'd seen every financial instrument imaginable. But what Michael Saylor and MicroStrategy were building was something else entirely. "Marcus, you need to see this." Sarah Kozlowski, his senior analyst, burst through his door without knocking—a breach of protocol that meant something significant. She spread a series of charts across his Italian marble desk, her usually steady hands trembling slightly with excitement. "I've been modeling MSTR's convertible bond strategy for three weeks. It's not just clever—it's architecturally perfect." Marcus studied the papers. MicroStrategy had issued another $2 billion in convertible bonds at 0.875% interest, due 2029. The bonds could convert to MSTR shares if the stock hit $1,000—currently trading at $450. The company would use every dollar to buy more Bitcoin. "Explain it to me like I'm a client," Marcus said, though he understood perfectly well. He wanted to hear her reasoning. Sarah pulled up a chair, her Princeton MBA and MIT engineering background evident in how she structured her explanation. "Think of it as a three-layer cake. Layer one: Institutions like us, State Street, Vanguard—we're legally restricted from holding Bitcoin directly. Our charters, our compliance departments, our insurance policies—they all prohibit direct cryptocurrency exposure." "But they don't prohibit holding equities or corporate bonds," Marcus interjected. "Exactly. Layer two: MicroStrategy becomes our proxy. They hold Bitcoin, we hold them. But here's where it gets beautiful—they've promised publicly, legally, repeatedly, that they will never sell a single Bitcoin . It's their core value proposition. They're a Bitcoin black hole." Marcus walked to his window, processing. Twenty-three floors below, he could see the evening rush beginning on the Hudson River Greenway. Cyclists and joggers, oblivious to the financial architecture being constructed above them. "Layer three?" he asked. "The convertible bonds. We're calling them STRK internally— Saylor's Trap, Really, Kid —" Sarah smiled at the trader slang. "These aren't normal corporate bonds. They're a bet on MSTR reaching specific price targets. If MSTR hits $1,000, bondholders convert to equity. If not, they get their money back plus interest." "And MicroStrategy uses the bond proceeds to buy more Bitcoin," Marcus said slowly, "which drives up their stock price because they're leveraged to Bitcoin's movement, which makes the conversion more likely, which attracts more institutional money to the bonds..." "Which they use to buy more Bitcoin," Sarah finished. "It's a perpetual motion machine powered by institutional FOMO and regulatory arbitrage." --- Part Two: The Believers March 2025 The Sovereign Capital Management quarterly board meeting took place in the firm's pristine boardroom, with its Rothko paintings and panoramic views of the Hudson. Marcus presented to twelve board members, each representing different institutional stakeholders—pension funds, sovereign wealth funds, university endowments. "We're recommending a $3 billion position," Marcus said, clicking through his presentation. "Split between MSTR equity and the convertible bonds." Board member Patricia Thornton, former Federal Reserve governor, raised a manicured hand. "What's our downside protection?" "The bonds provide a floor," Marcus explained. "Even if Bitcoin crashes, MicroStrategy owes us the principal plus interest. They have Bitcoin reserves worth $30 billion against $8 billion in convertible debt." "Unless Bitcoin falls more than 70%," Patricia noted. "Which has happened before," added James Park, representing the California State Teachers' Retirement System. "2022, Bitcoin fell from $69,000 to $16,000." Marcus nodded. "True. But MicroStrategy's strategy has evolved. They're not just holding Bitcoin—they're the primary institutional gateway to Bitcoin. Every major fund that wants crypto exposure but can't hold it directly comes through them. They've become systemically important ." "Too big to fail?" Patricia's tone was skeptical. "Too interconnected to fail," Marcus corrected. "State Street has $2 billion in MSTR. Vanguard has $3 billion. BlackRock, $4 billion. If MSTR fails, it takes down every institution's crypto allocation." The board voted 10-2 to approve the investment. That evening, Marcus met his old friend David Kim for drinks at The Campbell, a cocktail bar in Grand Central Terminal. David ran crypto strategy for Bridgewater Associates, the world's largest hedge fund. "You're buying MSTR?" David asked, swirling his $30 Old Fashioned. "Everyone is," Marcus replied. "You?" "Ray Dalio thinks it's the greatest example of reflexivity he's ever seen. George Soros's theory made real—market participants' biased views shape market fundamentals, which shape views, which shape fundamentals..." "Until?" Marcus prompted. David was quiet for a moment, watching commuters rush past the bar's entrance. "Until the only way to maintain the reflexivity is to never sell. Ever. Saylor's created a roach motel for capital. Money checks in, but it can't check out. " --- Part Three: The Prophets June 2025 The "Bitcoin Miami 2025" conference was a spectacle of excess. Marcus attended reluctantly, sent by his board to "understand the ecosystem." The Miami Beach Convention Center pulsed with electronic music, laser lights, and the energy of 50,000 true believers. Michael Saylor's keynote was scheduled for prime time. Marcus found himself in the VIP section, surrounded by institutional investors trying to look casual in their business-casual interpretation of Miami wear—khakis and polo shirts that still screamed "Wall Street." Saylor took the stage to thunderous applause. At 60, he looked energized, evangelical. Behind him, a giant screen showed MicroStrategy's Bitcoin holdings: 423,000 BTC, worth $52 billion at current prices. "We are not a company," Saylor declared. "We are a Bitcoin bank for the institutional world. Every corporation, every pension fund, every sovereign wealth fund that cannot or will not hold Bitcoin directly—we are their bridge to the future." The crowd roared. Marcus noticed Sarah in the row ahead, frantically taking notes. " We will never sell ," Saylor continued, his voice rising. "Not at $100,000. Not at $1 million. Not at $10 million per Bitcoin. MicroStrategy is where Bitcoin goes to live forever. We are the event horizon—once Bitcoin enters our treasury, it never leaves." After the speech, Marcus found himself at an exclusive rooftop party, hosted by Galaxy Digital. The Miami skyline glittered around them, Biscayne Bay stretching to the dark Atlantic beyond. "It's a cult," said a familiar voice. Marcus turned to find Christine Walsh, chief economist at the Federal Reserve Bank of New York, holding a mojito and looking deeply uncomfortable. "Christine? What brings the Fed to Bitcoin Miami?" "Systemic risk assessment," she said quietly. "We're tracking institutional exposure to crypto through MSTR. It's... significant." "How significant?" She glanced around, ensuring they weren't being overheard. "If you aggregate all the convertible bonds, equity holdings, and derivative exposure, the street has about $200 billion tied to MicroStrategy. That's not a company anymore, Marcus. It's a synthetic crypto ETF with no exit door ." "The SEC approved actual Bitcoin ETFs last year," Marcus pointed out. "Which hold actual Bitcoin they can sell," Christine countered. "MicroStrategy holds Bitcoin it claims it will never sell. What happens when bondholders want their money back, but selling Bitcoin would break the company's core promise?" Before Marcus could answer, fireworks erupted over the bay, spelling out "BITCOIN" in golden sparks. The crowd cheered. Christine shook her head and disappeared into the party. --- Part Four: The Mechanics September 2025 Sarah's desk had become a command center for tracking the MSTR phenomenon. Six monitors displayed real-time data: Bitcoin price, MSTR stock, convertible bond prices, institutional holdings, social media sentiment, and blockchain analytics. "Look at this," she called Marcus over one morning. "MSTR's beta to Bitcoin is now 2.8x. When Bitcoin moves 1%, MSTR moves 2.8%." "That's the leverage," Marcus said. "They've borrowed to buy Bitcoin, so they're magnifying the moves." "But watch this," Sarah pulled up a correlation chart. "The convertible bonds are creating a feedback loop. When Bitcoin rises, MSTR rises faster, making conversion more likely, so bond prices rise, so MicroStrategy can issue more bonds at better terms—" "So they buy more Bitcoin," Marcus finished. "Show me the sensitivity analysis." Sarah clicked through her models. "If Bitcoin hits $200,000, MSTR goes to approximately $2,000 per share. Every convertible bondholder converts to equity. MicroStrategy can issue new bonds against the higher equity value." "And if Bitcoin falls to $50,000?" Sarah's expression darkened. "MSTR drops to around $150. They'd owe $15 billion in bond principal against Bitcoin holdings worth $20 billion. Still solvent, but barely." "What about $30,000?" "Then they're underwater. They'd have to sell Bitcoin to pay bondholders, but—" "But they've promised never to sell," Marcus said. "So they can't. They'd default instead?" Sarah nodded. "Or find another way. Issue equity at crushed prices. Negotiate with bondholders. But once they break the 'never sell' promise, the entire thesis collapses ." Marcus studied the screens. Something felt familiar—dangerously familiar. He'd seen this kind of financial engineering before, in 2008, when mortgage-backed securities created similar feedback loops. "Sarah, model one more scenario for me. What happens if several major institutions try to exit simultaneously?" Her fingers flew across the keyboard. The model ran for several minutes, then displayed results that made them both step back. " Cascade failure ," Sarah whispered. "If institutions holding 20% of MSTR try to exit, the selling pressure drops MSTR by 60%, triggering bond covenants, forcing Bitcoin sales, creating more selling pressure..." "Print that out," Marcus ordered. "And schedule a meeting with risk management. Today." --- Part Five: The Momentum December 2025 Bitcoin crossed $200,000 on December 15th, 2025. The financial media called it the "Saylor Singularity"—MicroStrategy's holdings were worth $100 billion, making it one of the most valuable companies in the S&P 500 despite having only 2,000 employees and minimal revenue outside of Bitcoin appreciation. Marcus watched the celebration from his office. On CNBC, analysts debated whether MSTR could reach $5,000 per share. On Bloomberg, Michael Saylor announced another $10 billion convertible bond offering—the largest in corporate history. "The institutional demand is insatiable," Saylor told the interviewer. "We're giving the world's largest financial institutions what they want—Bitcoin exposure with a corporate wrapper. We're the bridge between the old financial system and the new." Marcus's phone buzzed. David Kim from Bridgewater. "You seeing this?" David asked without preamble. "Watching Saylor on Bloomberg right now." "No, check the blockchain. Someone just moved 50,000 Bitcoin from a wallet dormant since 2010." Marcus pulled up the blockchain explorer. Sure enough, an ancient wallet—one of the original Bitcoin miners—had awakened. Fifty thousand Bitcoin, worth $10 billion at current prices, on the move. "Satoshi?" Marcus asked, referring to Bitcoin's pseudonymous creator. "Or someone from that era. Marcus, if original holders start selling into this rally..." "They sell into MSTR's buying," Marcus said. "MicroStrategy is the buyer of last resort. They have to be—they've promised to buy Bitcoin with every dollar they raise." "What if that's the point?" David's voice was strange. "What if the early Bitcoin holders have been waiting for someone like Saylor? Someone who would create a mechanism to buy their coins at any price, no questions asked?" Marcus felt a chill despite his office's warmth. "You're suggesting this was planned?" "I'm suggesting that anyone smart enough to create Bitcoin was smart enough to anticipate how institutions would eventually need to access it. And what better way to cash out tens of billions in Bitcoin than to create a buyer who publicly promises to never stop buying ?" --- Part Six: The Warning Signs February 2026 The first crack appeared, as they often do, in an unexpected place. Turkey's central bank, facing a currency crisis, announced it would sell its Bitcoin reserves—50,000 coins accumulated since 2024. The market absorbed the selling initially, but then Iran announced similar plans, followed by Argentina. Marcus convened an emergency meeting with his team. "Sovereign sellers," he said, addressing the twelve analysts and traders gathered in the conference room. "We didn't model for this." "MicroStrategy is buying," one trader reported. "They're deploying their latest bond proceeds. Taking everything the sovereigns are selling." "At what price?" Marcus asked. "Bitcoin's down to $180,000. MSTR is at $1,400, off 30% from the peak." Sarah pulled up her models. "The February 2027 convertibles are now at risk. Strike price is $1,500. If MSTR doesn't recover, those bondholders will want cash, not equity." "How much?" "$4 billion in principal due." Marcus did quick math. "MicroStrategy would need to sell 22,000 Bitcoin to raise that cash." "Which they won't do," Sarah said. "Can't do. The moment they sell a single Bitcoin, their stock goes to zero. Every institutional holder exits. The thesis breaks. " Patricia Thornton from the board called Marcus directly. "Are we hedged?" "We've bought put options on MSTR," Marcus confirmed. "But Patricia, if MSTR fails, those puts might not pay. The counterparties are the same institutions that own MSTR. It's all interconnected." "Systemic risk," Patricia said quietly. "Like 2008." "Worse," Marcus replied. "In 2008, the bad assets were mortgages on real houses. Here, the asset is Bitcoin—purely digital, purely psychological. If confidence breaks..." He didn't need to finish. --- Part Seven: The Unraveling May 2026 The Bloomberg headline was stark: "MicroStrategy Bonds Trading at 70 Cents on Dollar as Bitcoin Slides." Bitcoin had fallen to $120,000, down 40% from its peak. MSTR was at $800, down 60%. The mathematics were brutal and simple—leverage that magnified gains also magnified losses. Marcus attended an emergency meeting at the Federal Reserve Bank of New York. The room was filled with the who's who of American finance—CEOs of major banks, heads of regulatory agencies, senior government officials. Christine Walsh from the Fed led the meeting. "Total institutional exposure to MicroStrategy: $380 billion. That's direct holdings. Indirect exposure through derivatives and linked products: another $200 billion." "They can just hold the bonds to maturity," suggested the CEO of JPMorgan. "Get paid back in cash." "With what cash?" Christine asked. "MicroStrategy's business generates $500 million in annual revenue. They have $20 billion in convertible bonds outstanding. The only way they can pay is—" "Selling Bitcoin," finished the Treasury Secretary. "Which they've promised never to do." Michael Saylor appeared on the conference room screen via secure video link. Even through the pixelated connection, Marcus could see the strain on his face. "Gentlemen, ladies," Saylor began, "MicroStrategy remains committed to our strategy. We will not sell Bitcoin. We have alternative financing options—" "What options?" the JPMorgan CEO interrupted. "Your stock is down 60%. You can't issue equity at these levels. No one will lend to you." "We're in discussions with sovereign wealth funds—" "Who are selling Bitcoin themselves," the Treasury Secretary said. "Michael, the music has stopped. You need to sell Bitcoin to meet your obligations." Saylor's jaw clenched. "The moment we sell, we destroy $380 billion in institutional value. Every fund that bought MSTR as a Bitcoin proxy loses everything. Is that what you want?" The room fell silent. It was the ultimate prisoner's dilemma—everyone would be better off if MicroStrategy held, but MicroStrategy would be better off if it sold. --- Part Eight: The Cascade June 2026 The end came not with a bang, but with a spreadsheet. MicroStrategy's CFO, under pressure from bondholders and facing personal liability, leaked an internal document showing the company's true financial position. Without Bitcoin sales, they could operate for three more months. The convertible bonds due in August couldn't be paid without liquidating Bitcoin. The leak hit Reddit first, then Twitter, then the financial press. Within hours, MSTR was down 40%. Bitcoin, sensing weakness, fell 20%. Marcus watched from his office as the cascade began. Funds that had bought MSTR on leverage faced margin calls. To meet them, they sold MSTR, pushing it down further, triggering more margin calls. "It's 1987, 2008, and 2020 combined," Sarah said, standing beside him. "But faster. Everything's algorithmic now. The selling is automated." By noon, MSTR was down 70% for the day. Trading was halted seventeen times. Each halt only increased the panic—buyers disappeared, knowing more selling was coming. Then, at 2:47 PM Eastern Time, the announcement came: "MicroStrategy Announces Strategic Bitcoin Sales to Ensure Financial Stability." The press release was corporate speak for capitulation. They would sell 100,000 Bitcoin—roughly 20% of their holdings—to pay off near-term debt and establish a cash cushion. The market's reaction was swift and brutal. If MicroStrategy was selling, everyone would sell. Bitcoin fell from $100,000 to $70,000 in an hour. MSTR stock, briefly halted, reopened down 85% from the morning. --- Part Nine: The Reckoning July 2026 The congressional hearing was held in the Rayburn House Office Building, the same room where they'd grilled bank CEOs after 2008. Michael Saylor sat alone at the witness table, facing forty-three members of the House Financial Services Committee. "Mr. Saylor," the committee chair began, "your company's failure has resulted in over $400 billion in losses to institutional investors, pension funds, and retirement accounts. How do you explain this?" Saylor leaned into the microphone. "MicroStrategy didn't fail. We adapted to market conditions. We still hold 400,000 Bitcoin—" "Worth $30 billion at current prices," the chair interrupted. "Down from $100 billion. Your stockholders have lost everything. Your bondholders are being paid back at 30 cents on the dollar." "The strategy was sound," Saylor insisted. "We created a mechanism for institutions to gain Bitcoin exposure—" "You created a trap," the ranking member interjected. "A financial weapon of mass destruction, as Warren Buffett might say. Institutions couldn't buy Bitcoin directly, so they bought your promises. And when those promises broke..." Marcus watched the hearing from his office—one of the few he still had. Sovereign Capital had survived, barely, by selling their MSTR position in January before the worst of the collapse. They'd lost $800 million but avoided the complete wipeout that befell others. State Street: $2 billion loss. Vanguard: $3 billion loss. Various pension funds: $50 billion combined. The numbers were staggering, but the second-order effects were worse. The collapse in Bitcoin and MSTR had triggered a broader market selloff. Crypto-correlated stocks crashed. Tech stocks, seen as speculative, fell 30%. Credit markets froze as institutions faced massive losses. --- Part Ten: The Revelation September 2026 Marcus met David Kim at a coffee shop in Greenwich Village, far from their usual Wall Street haunts. Both men had left their firms—Marcus to start a small advisory business, David to teach at Columbia. "I've been analyzing the blockchain," David said, sliding a tablet across the table. "Look at this." The screen showed Bitcoin wallet analytics—flows, timing, amounts. "Remember those early wallets that woke up during the boom? They sold perfectly into MicroStrategy's buying. Almost like they knew exactly when and how much MSTR would buy." Marcus studied the data. "You're suggesting coordination?" "I'm suggesting something more elegant. What if Satoshi—or whoever created Bitcoin—understood that institutional adoption would require an intermediary? A bridge between the anarchist vision of cryptocurrency and the regulatory reality of institutional finance?" "MicroStrategy," Marcus said slowly. "Not specifically MicroStrategy, but something like it. Some entity that would promise to never sell, becoming a one-way valve for institutional capital. The early holders could sell into institutional buying, cashing out billions, while institutions got exposure to an asset they couldn't directly hold." Marcus sat back. "But that would mean—" "That Bitcoin was designed from the beginning as history's greatest liquidity extraction mechanism. Not a conspiracy, exactly. More like... intelligent design . Create a scarce digital asset, wait for institutional FOMO, provide a mechanism for them to buy but never sell, then cash out into their buying." "That's insane," Marcus said. "Is it?" David pulled up another chart. "Look at the net flows. Early Bitcoin holders—the ones from 2009 to 2013—cashed out $500 billion during the MicroStrategy boom. That money came from institutions, pension funds, retirement accounts. It was the greatest wealth transfer in history , from institutional capital to anonymous early adopters." Marcus stared at the data. The pattern was undeniable. --- Part Eleven: The New Normal December 2026 Bitcoin stabilized around $50,000. MicroStrategy, restructured through bankruptcy, emerged as a small software company again, its Bitcoin holdings liquidated to pay creditors. Michael Saylor stepped down, his fortune evaporated, his legacy complicated. The congressional committee issued a 400-page report recommending new regulations on corporate cryptocurrency holdings and convertible bond issuances. The SEC implemented strict rules on institutional crypto exposure. The era of financial engineering through crypto proxies was over. Marcus stood in his new office—smaller, simpler, with a view of the East River instead of the Hudson. He was writing a book about the MicroStrategy phenomenon, trying to capture the madness and brilliance of it all. His phone buzzed. Sarah, now running her own research firm. "You see the news?" she asked. "What now?" "Some company in Singapore is issuing Bitcoin-backed bonds. They promise to hold Bitcoin forever, never sell. Institutions are interested." Marcus laughed, dark and knowing. " Different verse, same song. " "You think it'll happen again?" Marcus looked out at the river, watching a container ship navigate toward the Atlantic. "The names change, the instruments evolve, but the pattern remains. Someone creates a mechanism to concentrate wealth while appearing to democratize it. Investors, driven by greed and FOMO, pile in. The machine runs until it can't. Then it collapses, and we promise never again." "Until the next time," Sarah said. "Until the next time." --- Epilogue: The Historian 2030 Professor Marcus Chen stood before his graduate finance class at Columbia Business School. On the screen behind him: a chart of Bitcoin's price from 2009 to 2030, with the MicroStrategy era highlighted in red. "The MicroStrategy collapse of 2026," he began, "represents a unique moment in financial history. It wasn't fraud, exactly—everything was disclosed. It wasn't illegality—regulators had approved it all. It was something more subtle: a system designed to fail profitably ." A student raised her hand. "Professor, do you think it was intentional? The whole Bitcoin-to-institutional-capital pipeline?" Marcus considered the question he'd been pondering for four years. "Intent is hard to prove. But consider this: Bitcoin was created by someone or some group brilliant enough to solve the double-spending problem that had plagued digital currency for decades. They created a system that survived every attack, scaled beyond anyone's imagination, and eventually attracted trillions in institutional capital." He clicked to the next slide, showing fund flows from 2024 to 2026. "Is it so hard to believe they also anticipated how institutions would need to access Bitcoin? That they understood regulatory constraints would require intermediaries? That those intermediaries would create the perfect exit liquidity for early holders?" The class was silent, absorbing the implications. "The MicroStrategy story isn't just about one company or one man's obsession with Bitcoin. It's about how financial innovation can become financial extraction. How complexity can hide simple wealth transfers. How the promise of democratization can enable unprecedented concentration." He clicked to his final slide: a quote from Satoshi Nakamoto's original Bitcoin whitepaper: "The traditional banking model achieves a level of privacy by limiting access to information to the parties involved and the trusted third party. The necessity to announce all transactions publicly precludes this method, but privacy can still be maintained by breaking the flow of information in another place: by keeping public keys anonymous." "Perhaps," Marcus said, "the real innovation wasn't the anonymity of transactions, but the anonymity of the architects. They built a machine that would inevitably create its own exit liquidity, then disappeared before anyone understood what they'd built." A student in the back called out, "So it was all a scam?" Marcus smiled, the same ambiguous smile he'd worn since 2026. "No, not a scam. Something more elegant and more troubling. A system working exactly as designed, just not as advertised. The greatest magic trick in financial history —making institutional wealth disappear into anonymous wallets, and making everyone applaud the innovation while it happened." The bell rang. Students filed out, discussing the lecture in hushed tones. Marcus remained, staring at the Bitcoin price chart, still wondering if he was seeing patterns that weren't there or missing patterns that were. His phone buzzed. A news alert: "New DeFi Protocol Promises Institutional Gateway to Cryptocurrency 2.0." Marcus shook his head and smiled. The machine was starting up again, with new gears, new levers, but the same essential mechanism—a one-way valve for institutional capital, a promise of revolution that delivered extraction. He gathered his papers and left the classroom. Outside, New York hummed with its eternal energy, fortunes being made and lost, the next financial innovation always just around the corner. In his pocket, his phone buzzed again. He didn't check it. He knew what it would say—someone, somewhere, was building the next MicroStrategy, the next bridge between institutional capital and digital assets. The next trap. The cycle continued. --- Terrapin's Note This is a work of speculative fiction exploring potential dynamics in financial markets. The scenarios described are hypothetical and not intended as financial advice, predictions, or accusations of wrongdoing. Real financial markets are complex, regulated, and unpredictable. Any investment decisions should be made with proper research, risk assessment, and professional guidance. The story explores themes of financial engineering, systemic risk, and unintended consequences. While inspired by real financial instruments and strategies, all specific events and outcomes are fictional. The goal is to provoke thought about market structures, institutional behavior, and the potential risks of financial innovation. --- If you found this speculative analysis thought-provoking, follow me on TradingView for more deep dives into market mechanics, systemic risks, and the patterns that repeat throughout financial history. Not financial advice. Always DYOR. The best trade is often the one you don't make.
Terrapins

The Convertible Trap Part One: The Architecture December 2024 Marcus Chen stood before the floor-to-ceiling windows of his corner office on the 47th floor of One Manhattan West, watching the city blur into twilight. The Bloomberg terminal on his desk glowed with a constellation of green numbers—Bitcoin had just crossed $110,000, and MicroStrategy's stock was up another 15% for the day. As Chief Investment Officer at Sovereign Capital Management, overseeing $480 billion in assets, he'd seen every financial instrument imaginable. But what Michael Saylor and MicroStrategy were building was something else entirely. "Marcus, you need to see this." Sarah Kozlowski, his senior analyst, burst through his door without knocking—a breach of protocol that meant something significant. She spread a series of charts across his Italian marble desk, her usually steady hands trembling slightly with excitement. "I've been modeling MSTR's convertible bond strategy for three weeks. It's not just clever—it's architecturally perfect." Marcus studied the papers. MicroStrategy had issued another $2 billion in convertible bonds at 0.875% interest, due 2029. The bonds could convert to MSTR shares if the stock hit $1,000—currently trading at $450. The company would use every dollar to buy more Bitcoin. "Explain it to me like I'm a client," Marcus said, though he understood perfectly well. He wanted to hear her reasoning. Sarah pulled up a chair, her Princeton MBA and MIT engineering background evident in how she structured her explanation. "Think of it as a three-layer cake. Layer one: Institutions like us, State Street, Vanguard—we're legally restricted from holding Bitcoin directly. Our charters, our compliance departments, our insurance policies—they all prohibit direct cryptocurrency exposure." "But they don't prohibit holding equities or corporate bonds," Marcus interjected. "Exactly. Layer two: MicroStrategy becomes our proxy. They hold Bitcoin, we hold them. But here's where it gets beautiful—they've promised publicly, legally, repeatedly, that they will never sell a single Bitcoin. It's their core value proposition. They're a Bitcoin black hole." Marcus walked to his window, processing. Twenty-three floors below, he could see the evening rush beginning on the Hudson River Greenway. Cyclists and joggers, oblivious to the financial architecture being constructed above them. "Layer three?" he asked. "The convertible bonds. We're calling them STRK internally—Saylor's Trap, Really, Kid—" Sarah smiled at the trader slang. "These aren't normal corporate bonds. They're a bet on MSTR reaching specific price targets. If MSTR hits $1,000, bondholders convert to equity. If not, they get their money back plus interest." "And MicroStrategy uses the bond proceeds to buy more Bitcoin," Marcus said slowly, "which drives up their stock price because they're leveraged to Bitcoin's movement, which makes the conversion more likely, which attracts more institutional money to the bonds..." "Which they use to buy more Bitcoin," Sarah finished. "It's a perpetual motion machine powered by institutional FOMO and regulatory arbitrage." Part Two: The Believers March 2025 The Sovereign Capital Management quarterly board meeting took place in the firm's pristine boardroom, with its Rothko paintings and panoramic views of the Hudson. Marcus presented to twelve board members, each representing different institutional stakeholders—pension funds, sovereign wealth funds, university endowments. "We're recommending a $3 billion position," Marcus said, clicking through his presentation. "Split between MSTR equity and the convertible bonds." Board member Patricia Thornton, former Federal Reserve governor, raised a manicured hand. "What's our downside protection?" "The bonds provide a floor," Marcus explained. "Even if Bitcoin crashes, MicroStrategy owes us the principal plus interest. They have Bitcoin reserves worth $30 billion against $8 billion in convertible debt." "Unless Bitcoin falls more than 70%," Patricia noted. "Which has happened before," added James Park, representing the California State Teachers' Retirement System. "2022, Bitcoin fell from $69,000 to $16,000." Marcus nodded. "True. But MicroStrategy's strategy has evolved. They're not just holding Bitcoin—they're the primary institutional gateway to Bitcoin. Every major fund that wants crypto exposure but can't hold it directly comes through them. They've become systemically important." "Too big to fail?" Patricia's tone was skeptical. "Too interconnected to fail," Marcus corrected. "State Street has $2 billion in MSTR. Vanguard has $3 billion. BlackRock, $4 billion. If MSTR fails, it takes down every institution's crypto allocation." The board voted 10-2 to approve the investment. That evening, Marcus met his old friend David Kim for drinks at The Campbell, a cocktail bar in Grand Central Terminal. David ran crypto strategy for Bridgewater Associates, the world's largest hedge fund. "You're buying MSTR?" David asked, swirling his $30 Old Fashioned. "Everyone is," Marcus replied. "You?" "Ray Dalio thinks it's the greatest example of reflexivity he's ever seen. George Soros's theory made real—market participants' biased views shape market fundamentals, which shape views, which shape fundamentals..." "Until?" Marcus prompted. David was quiet for a moment, watching commuters rush past the bar's entrance. "Until the only way to maintain the reflexivity is to never sell. Ever. Saylor's created a roach motel for capital. Money checks in, but it can't check out." Part Three: The Prophets June 2025 The "Bitcoin Miami 2025" conference was a spectacle of excess. Marcus attended reluctantly, sent by his board to "understand the ecosystem." The Miami Beach Convention Center pulsed with electronic music, laser lights, and the energy of 50,000 true believers. Michael Saylor's keynote was scheduled for prime time. Marcus found himself in the VIP section, surrounded by institutional investors trying to look casual in their business-casual interpretation of Miami wear—khakis and polo shirts that still screamed "Wall Street." Saylor took the stage to thunderous applause. At 60, he looked energized, evangelical. Behind him, a giant screen showed MicroStrategy's Bitcoin holdings: 423,000 BTC, worth $52 billion at current prices. "We are not a company," Saylor declared. "We are a Bitcoin bank for the institutional world. Every corporation, every pension fund, every sovereign wealth fund that cannot or will not hold Bitcoin directly—we are their bridge to the future." The crowd roared. Marcus noticed Sarah in the row ahead, frantically taking notes. "We will never sell," Saylor continued, his voice rising. "Not at $100,000. Not at $1 million. Not at $10 million per Bitcoin. MicroStrategy is where Bitcoin goes to live forever. We are the event horizon—once Bitcoin enters our treasury, it never leaves." After the speech, Marcus found himself at an exclusive rooftop party, hosted by Galaxy Digital. The Miami skyline glittered around them, Biscayne Bay stretching to the dark Atlantic beyond. "It's a cult," said a familiar voice. Marcus turned to find Christine Walsh, chief economist at the Federal Reserve Bank of New York, holding a mojito and looking deeply uncomfortable. "Christine? What brings the Fed to Bitcoin Miami?" "Systemic risk assessment," she said quietly. "We're tracking institutional exposure to crypto through MSTR. It's... significant." "How significant?" She glanced around, ensuring they weren't being overheard. "If you aggregate all the convertible bonds, equity holdings, and derivative exposure, the street has about $200 billion tied to MicroStrategy. That's not a company anymore, Marcus. It's a synthetic crypto ETF with no exit door." "The SEC approved actual Bitcoin ETFs last year," Marcus pointed out. "Which hold actual Bitcoin they can sell," Christine countered. "MicroStrategy holds Bitcoin it claims it will never sell. What happens when bondholders want their money back, but selling Bitcoin would break the company's core promise?" Before Marcus could answer, fireworks erupted over the bay, spelling out "BITCOIN" in golden sparks. The crowd cheered. Christine shook her head and disappeared into the party. Part Four: The Mechanics September 2025 Sarah's desk had become a command center for tracking the MSTR phenomenon. Six monitors displayed real-time data: Bitcoin price, MSTR stock, convertible bond prices, institutional holdings, social media sentiment, and blockchain analytics. "Look at this," she called Marcus over one morning. "MSTR's beta to Bitcoin is now 2.8x. When Bitcoin moves 1%, MSTR moves 2.8%." "That's the leverage," Marcus said. "They've borrowed to buy Bitcoin, so they're magnifying the moves." "But watch this," Sarah pulled up a correlation chart. "The convertible bonds are creating a feedback loop. When Bitcoin rises, MSTR rises faster, making conversion more likely, so bond prices rise, so MicroStrategy can issue more bonds at better terms—" "So they buy more Bitcoin," Marcus finished. "Show me the sensitivity analysis." Sarah clicked through her models. "If Bitcoin hits $200,000, MSTR goes to approximately $2,000 per share. Every convertible bondholder converts to equity. MicroStrategy can issue new bonds against the higher equity value." "And if Bitcoin falls to $50,000?" Sarah's expression darkened. "MSTR drops to around $150. They'd owe $15 billion in bond principal against Bitcoin holdings worth $20 billion. Still solvent, but barely." "What about $30,000?" "Then they're underwater. They'd have to sell Bitcoin to pay bondholders, but—" "But they've promised never to sell," Marcus said. "So they can't. They'd default instead?" Sarah nodded. "Or find another way. Issue equity at crushed prices. Negotiate with bondholders. But once they break the 'never sell' promise, the entire thesis collapses." Marcus studied the screens. Something felt familiar—dangerously familiar. He'd seen this kind of financial engineering before, in 2008, when mortgage-backed securities created similar feedback loops. "Sarah, model one more scenario for me. What happens if several major institutions try to exit simultaneously?" Her fingers flew across the keyboard. The model ran for several minutes, then displayed results that made them both step back. "Cascade failure," Sarah whispered. "If institutions holding 20% of MSTR try to exit, the selling pressure drops MSTR by 60%, triggering bond covenants, forcing Bitcoin sales, creating more selling pressure..." "Print that out," Marcus ordered. "And schedule a meeting with risk management. Today." Part Five: The Momentum December 2025 Bitcoin crossed $200,000 on December 15th, 2025. The financial media called it the "Saylor Singularity"—MicroStrategy's holdings were worth $100 billion, making it one of the most valuable companies in the S&P 500 despite having only 2,000 employees and minimal revenue outside of Bitcoin appreciation. Marcus watched the celebration from his office. On CNBC, analysts debated whether MSTR could reach $5,000 per share. On Bloomberg, Michael Saylor announced another $10 billion convertible bond offering—the largest in corporate history. "The institutional demand is insatiable," Saylor told the interviewer. "We're giving the world's largest financial institutions what they want—Bitcoin exposure with a corporate wrapper. We're the bridge between the old financial system and the new." Marcus's phone buzzed. David Kim from Bridgewater. "You seeing this?" David asked without preamble. "Watching Saylor on Bloomberg right now." "No, check the blockchain. Someone just moved 50,000 Bitcoin from a wallet dormant since 2010." Marcus pulled up the blockchain explorer. Sure enough, an ancient wallet—one of the original Bitcoin miners—had awakened. Fifty thousand Bitcoin, worth $10 billion at current prices, on the move. "Satoshi?" Marcus asked, referring to Bitcoin's pseudonymous creator. "Or someone from that era. Marcus, if original holders start selling into this rally..." "They sell into MSTR's buying," Marcus said. "MicroStrategy is the buyer of last resort. They have to be—they've promised to buy Bitcoin with every dollar they raise." "What if that's the point?" David's voice was strange. "What if the early Bitcoin holders have been waiting for someone like Saylor? Someone who would create a mechanism to buy their coins at any price, no questions asked?" Marcus felt a chill despite his office's warmth. "You're suggesting this was planned?" "I'm suggesting that anyone smart enough to create Bitcoin was smart enough to anticipate how institutions would eventually need to access it. And what better way to cash out tens of billions in Bitcoin than to create a buyer who publicly promises to never stop buying?" Part Six: The Warning Signs February 2026 The first crack appeared, as they often do, in an unexpected place. Turkey's central bank, facing a currency crisis, announced it would sell its Bitcoin reserves—50,000 coins accumulated since 2024. The market absorbed the selling initially, but then Iran announced similar plans, followed by Argentina. Marcus convened an emergency meeting with his team. "Sovereign sellers," he said, addressing the twelve analysts and traders gathered in the conference room. "We didn't model for this." "MicroStrategy is buying," one trader reported. "They're deploying their latest bond proceeds. Taking everything the sovereigns are selling." "At what price?" Marcus asked. "Bitcoin's down to $180,000. MSTR is at $1,400, off 30% from the peak." Sarah pulled up her models. "The February 2027 convertibles are now at risk. Strike price is $1,500. If MSTR doesn't recover, those bondholders will want cash, not equity." "How much?" "$4 billion in principal due." Marcus did quick math. "MicroStrategy would need to sell 22,000 Bitcoin to raise that cash." "Which they won't do," Sarah said. "Can't do. The moment they sell a single Bitcoin, their stock goes to zero. Every institutional holder exits. The thesis breaks." Patricia Thornton from the board called Marcus directly. "Are we hedged?" "We've bought put options on MSTR," Marcus confirmed. "But Patricia, if MSTR fails, those puts might not pay. The counterparties are the same institutions that own MSTR. It's all interconnected." "Systemic risk," Patricia said quietly. "Like 2008." "Worse," Marcus replied. "In 2008, the bad assets were mortgages on real houses. Here, the asset is Bitcoin—purely digital, purely psychological. If confidence breaks..." He didn't need to finish. Part Seven: The Unraveling May 2026 The Bloomberg headline was stark: "MicroStrategy Bonds Trading at 70 Cents on Dollar as Bitcoin Slides." Bitcoin had fallen to $120,000, down 40% from its peak. MSTR was at $800, down 60%. The mathematics were brutal and simple—leverage that magnified gains also magnified losses. Marcus attended an emergency meeting at the Federal Reserve Bank of New York. The room was filled with the who's who of American finance—CEOs of major banks, heads of regulatory agencies, senior government officials. Christine Walsh from the Fed led the meeting. "Total institutional exposure to MicroStrategy: $380 billion. That's direct holdings. Indirect exposure through derivatives and linked products: another $200 billion." "They can just hold the bonds to maturity," suggested the CEO of JPMorgan. "Get paid back in cash." "With what cash?" Christine asked. "MicroStrategy's business generates $500 million in annual revenue. They have $20 billion in convertible bonds outstanding. The only way they can pay is—" "Selling Bitcoin," finished the Treasury Secretary. "Which they've promised never to do." Michael Saylor appeared on the conference room screen via secure video link. Even through the pixelated connection, Marcus could see the strain on his face. "Gentlemen, ladies," Saylor began, "MicroStrategy remains committed to our strategy. We will not sell Bitcoin. We have alternative financing options—" "What options?" the JPMorgan CEO interrupted. "Your stock is down 60%. You can't issue equity at these levels. No one will lend to you." "We're in discussions with sovereign wealth funds—" "Who are selling Bitcoin themselves," the Treasury Secretary said. "Michael, the music has stopped. You need to sell Bitcoin to meet your obligations." Saylor's jaw clenched. "The moment we sell, we destroy $380 billion in institutional value. Every fund that bought MSTR as a Bitcoin proxy loses everything. Is that what you want?" The room fell silent. It was the ultimate prisoner's dilemma—everyone would be better off if MicroStrategy held, but MicroStrategy would be better off if it sold. Part Eight: The Cascade June 2026 The end came not with a bang, but with a spreadsheet. MicroStrategy's CFO, under pressure from bondholders and facing personal liability, leaked an internal document showing the company's true financial position. Without Bitcoin sales, they could operate for three more months. The convertible bonds due in August couldn't be paid without liquidating Bitcoin. The leak hit Reddit first, then Twitter, then the financial press. Within hours, MSTR was down 40%. Bitcoin, sensing weakness, fell 20%. Marcus watched from his office as the cascade began. Funds that had bought MSTR on leverage faced margin calls. To meet them, they sold MSTR, pushing it down further, triggering more margin calls. "It's 1987, 2008, and 2020 combined," Sarah said, standing beside him. "But faster. Everything's algorithmic now. The selling is automated." By noon, MSTR was down 70% for the day. Trading was halted seventeen times. Each halt only increased the panic—buyers disappeared, knowing more selling was coming. Then, at 2:47 PM Eastern Time, the announcement came: "MicroStrategy Announces Strategic Bitcoin Sales to Ensure Financial Stability." The press release was corporate speak for capitulation. They would sell 100,000 Bitcoin—roughly 20% of their holdings—to pay off near-term debt and establish a cash cushion. The market's reaction was swift and brutal. If MicroStrategy was selling, everyone would sell. Bitcoin fell from $100,000 to $70,000 in an hour. MSTR stock, briefly halted, reopened down 85% from the morning. Part Nine: The Reckoning July 2026 The congressional hearing was held in the Rayburn House Office Building, the same room where they'd grilled bank CEOs after 2008. Michael Saylor sat alone at the witness table, facing forty-three members of the House Financial Services Committee. "Mr. Saylor," the committee chair began, "your company's failure has resulted in over $400 billion in losses to institutional investors, pension funds, and retirement accounts. How do you explain this?" Saylor leaned into the microphone. "MicroStrategy didn't fail. We adapted to market conditions. We still hold 400,000 Bitcoin—" "Worth $30 billion at current prices," the chair interrupted. "Down from $100 billion. Your stockholders have lost everything. Your bondholders are being paid back at 30 cents on the dollar." "The strategy was sound," Saylor insisted. "We created a mechanism for institutions to gain Bitcoin exposure—" "You created a trap," the ranking member interjected. "A financial weapon of mass destruction, as Warren Buffett might say. Institutions couldn't buy Bitcoin directly, so they bought your promises. And when those promises broke..." Marcus watched the hearing from his office—one of the few he still had. Sovereign Capital had survived, barely, by selling their MSTR position in January before the worst of the collapse. They'd lost $800 million but avoided the complete wipeout that befell others. State Street: $2 billion loss. Vanguard: $3 billion loss. Various pension funds: $50 billion combined. The numbers were staggering, but the second-order effects were worse. The collapse in Bitcoin and MSTR had triggered a broader market selloff. Crypto-correlated stocks crashed. Tech stocks, seen as speculative, fell 30%. Credit markets froze as institutions faced massive losses. Part Ten: The Revelation September 2026 Marcus met David Kim at a coffee shop in Greenwich Village, far from their usual Wall Street haunts. Both men had left their firms—Marcus to start a small advisory business, David to teach at Columbia. "I've been analyzing the blockchain," David said, sliding a tablet across the table. "Look at this." The screen showed Bitcoin wallet analytics—flows, timing, amounts. "Remember those early wallets that woke up during the boom? They sold perfectly into MicroStrategy's buying. Almost like they knew exactly when and how much MSTR would buy." Marcus studied the data. "You're suggesting coordination?" "I'm suggesting something more elegant. What if Satoshi—or whoever created Bitcoin—understood that institutional adoption would require an intermediary? A bridge between the anarchist vision of cryptocurrency and the regulatory reality of institutional finance?" "MicroStrategy," Marcus said slowly. "Not specifically MicroStrategy, but something like it. Some entity that would promise to never sell, becoming a one-way valve for institutional capital. The early holders could sell into institutional buying, cashing out billions, while institutions got exposure to an asset they couldn't directly hold." Marcus sat back. "But that would mean—" "That Bitcoin was designed from the beginning as history's greatest liquidity extraction mechanism. Not a conspiracy, exactly. More like... intelligent design. Create a scarce digital asset, wait for institutional FOMO, provide a mechanism for them to buy but never sell, then cash out into their buying." "That's insane," Marcus said. "Is it?" David pulled up another chart. "Look at the net flows. Early Bitcoin holders—the ones from 2009 to 2013—cashed out $500 billion during the MicroStrategy boom. That money came from institutions, pension funds, retirement accounts. It was the greatest wealth transfer in history, from institutional capital to anonymous early adopters." Marcus stared at the data. The pattern was undeniable. Part Eleven: The New Normal December 2026 Bitcoin stabilized around $50,000. MicroStrategy, restructured through bankruptcy, emerged as a small software company again, its Bitcoin holdings liquidated to pay creditors. Michael Saylor stepped down, his fortune evaporated, his legacy complicated. The congressional committee issued a 400-page report recommending new regulations on corporate cryptocurrency holdings and convertible bond issuances. The SEC implemented strict rules on institutional crypto exposure. The era of financial engineering through crypto proxies was over. Marcus stood in his new office—smaller, simpler, with a view of the East River instead of the Hudson. He was writing a book about the MicroStrategy phenomenon, trying to capture the madness and brilliance of it all. His phone buzzed. Sarah, now running her own research firm. "You see the news?" she asked. "What now?" "Some company in Singapore is issuing Bitcoin-backed bonds. They promise to hold Bitcoin forever, never sell. Institutions are interested." Marcus laughed, dark and knowing. "Different verse, same song." "You think it'll happen again?" Marcus looked out at the river, watching a container ship navigate toward the Atlantic. "The names change, the instruments evolve, but the pattern remains. Someone creates a mechanism to concentrate wealth while appearing to democratize it. Investors, driven by greed and FOMO, pile in. The machine runs until it can't. Then it collapses, and we promise never again." "Until the next time," Sarah said. "Until the next time." Epilogue: The Historian 2030 Professor Marcus Chen stood before his graduate finance class at Columbia Business School. On the screen behind him: a chart of Bitcoin's price from 2009 to 2030, with the MicroStrategy era highlighted in red. "The MicroStrategy collapse of 2026," he began, "represents a unique moment in financial history. It wasn't fraud, exactly—everything was disclosed. It wasn't illegality—regulators had approved it all. It was something more subtle: a system designed to fail profitably." A student raised her hand. "Professor, do you think it was intentional? The whole Bitcoin-to-institutional-capital pipeline?" Marcus considered the question he'd been pondering for four years. "Intent is hard to prove. But consider this: Bitcoin was created by someone or some group brilliant enough to solve the double-spending problem that had plagued digital currency for decades. They created a system that survived every attack, scaled beyond anyone's imagination, and eventually attracted trillions in institutional capital." He clicked to the next slide, showing fund flows from 2024 to 2026. "Is it so hard to believe they also anticipated how institutions would need to access Bitcoin? That they understood regulatory constraints would require intermediaries? That those intermediaries would create the perfect exit liquidity for early holders?" The class was silent, absorbing the implications. "The MicroStrategy story isn't just about one company or one man's obsession with Bitcoin. It's about how financial innovation can become financial extraction. How complexity can hide simple wealth transfers. How the promise of democratization can enable unprecedented concentration." He clicked to his final slide: a quote from Satoshi Nakamoto's original Bitcoin whitepaper: "The traditional banking model achieves a level of privacy by limiting access to information to the parties involved and the trusted third party. The necessity to announce all transactions publicly precludes this method, but privacy can still be maintained by breaking the flow of information in another place: by keeping public keys anonymous." "Perhaps," Marcus said, "the real innovation wasn't the anonymity of transactions, but the anonymity of the architects. They built a machine that would inevitably create its own exit liquidity, then disappeared before anyone understood what they'd built." A student in the back called out, "So it was all a scam?" Marcus smiled, the same ambiguous smile he'd worn since 2026. "No, not a scam. Something more elegant and more troubling. A system working exactly as designed, just not as advertised. The greatest magic trick in financial history—making institutional wealth disappear into anonymous wallets, and making everyone applaud the innovation while it happened." The bell rang. Students filed out, discussing the lecture in hushed tones. Marcus remained, staring at the Bitcoin price chart, still wondering if he was seeing patterns that weren't there or missing patterns that were. His phone buzzed. A news alert: "New DeFi Protocol Promises Institutional Gateway to Cryptocurrency 2.0." Marcus shook his head and smiled. The machine was starting up again, with new gears, new levers, but the same essential mechanism—a one-way valve for institutional capital, a promise of revolution that delivered extraction. He gathered his papers and left the classroom. Outside, New York hummed with its eternal energy, fortunes being made and lost, the next financial innovation always just around the corner. In his pocket, his phone buzzed again. He didn't check it. He knew what it would say—someone, somewhere, was building the next MicroStrategy, the next bridge between institutional capital and digital assets. The next trap. The cycle continued.
Terrapins
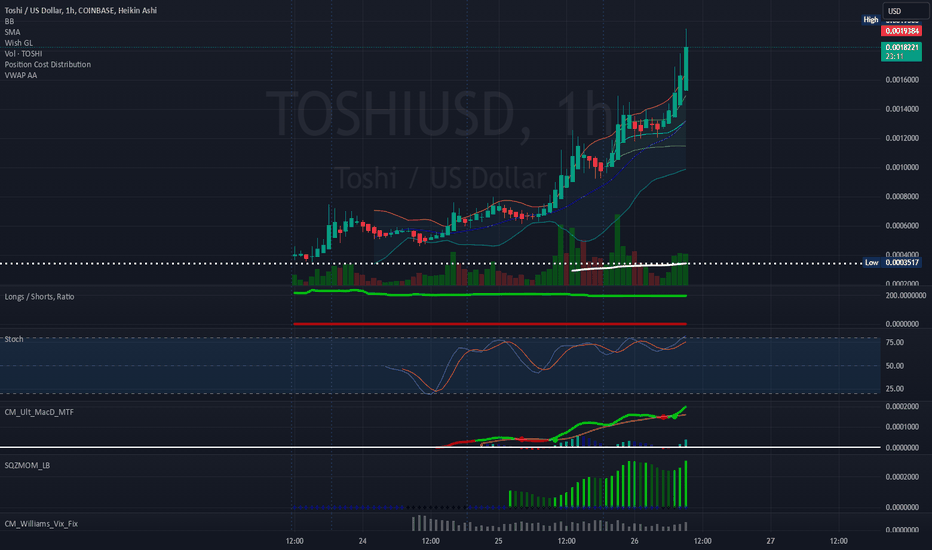
Daily Chart: 1H Chart: Check out: twitter.com/Toshi_base toshithecat.com/ It appears that TOSHI is a Base network MEME token surrounding Brian Armstrong's Cat, Toshi. This MEME coin seems unique in the sense that it functions much like Solana. It has it's own marketplace for generating unique tokens to list on DEXSCREENER. I think this token is promising, considering it is fairly "new" to the multiple CEX's now. Exposure to the token is increasing. I feel like technical indicators can't really come into play until the 2HR, 4HR, 8HR, and 1 day charts can really start drawing. The Market Cap is under 1B. PEPE's Market Cap is somewhere around 6.3B right now (1/26/25). There's significant potential for this coin and I think it could reach .01 with a 2.5B-3.5B market cap. Lastly, I noticed TOSHI offers NFToshi's and NFToshi 2.0's. Following this buzz, I think this will draw attention to the their NFT's which will also see a floor increase. NFToshi's: rarible.com/collection/base/0xbdb1a8772409a0c5eeb347060cbf4b41dd7b2c62 NFToshi 2.0's: magiceden.us/collections/base/0xbc72A61bD9511C7CF9eD7E4B0cAC1b8D0FBa4bC6 I appreciate any comments. Thanks.It's been 1 hour since making this post and TOSHI has already touched .0025... Crazy.The 15 minutes trending up 30 minute chart is about to trend green: I'm expecting a huge pumpTypically, I steer clear of my doodle's to predict the market structure, but this is healthy normal looking market structure unfolding. I am providing supplemental charts: 2HR Chart: 4HR Chart: 8HR Chart: Note, that it takes 17 candlesticks in order for the indicators to begin drawing on the Stochastics and MACD, which is significant for determining entries.8HR Chart (Updated w/ more time data) There's bounces between .001 and .00125. Consolidation around .001.8HR Chart (Updated with more time data): I'll make my next update in 3-4 days when the Daily chart is able to draw indicators. It needs 17 total days for that to occur on this chart.Daily Chart (finally drew stochastic data): Consolidation at .00065-.007 It looks like (along with BTC) there's an 8 hour push upward as the stochastics low and MACD too along with a BTC consolidation at 92,000-96,000. I would not be surprised to finally see TOSHI gain upward momentum back towards .00125 or .0015.8 Hour Chart (updated with more time data):
Terrapins
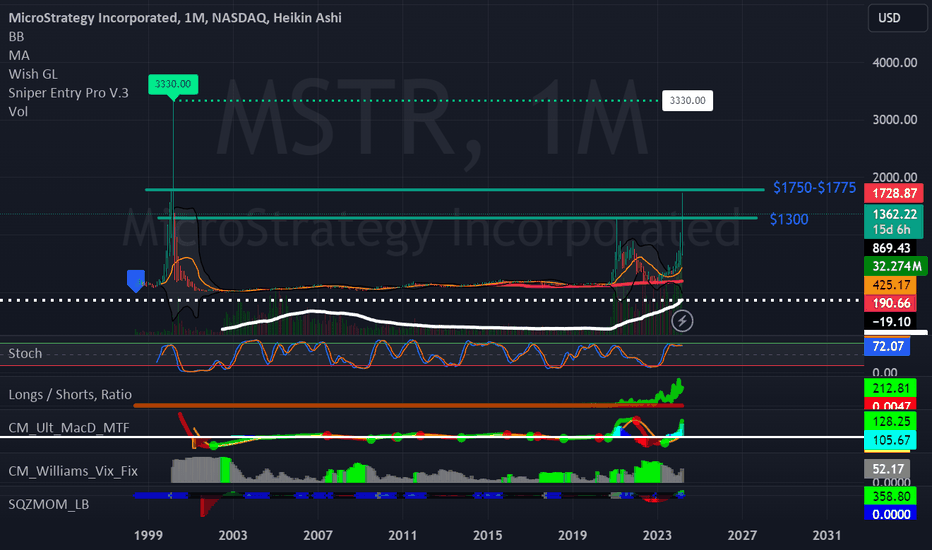
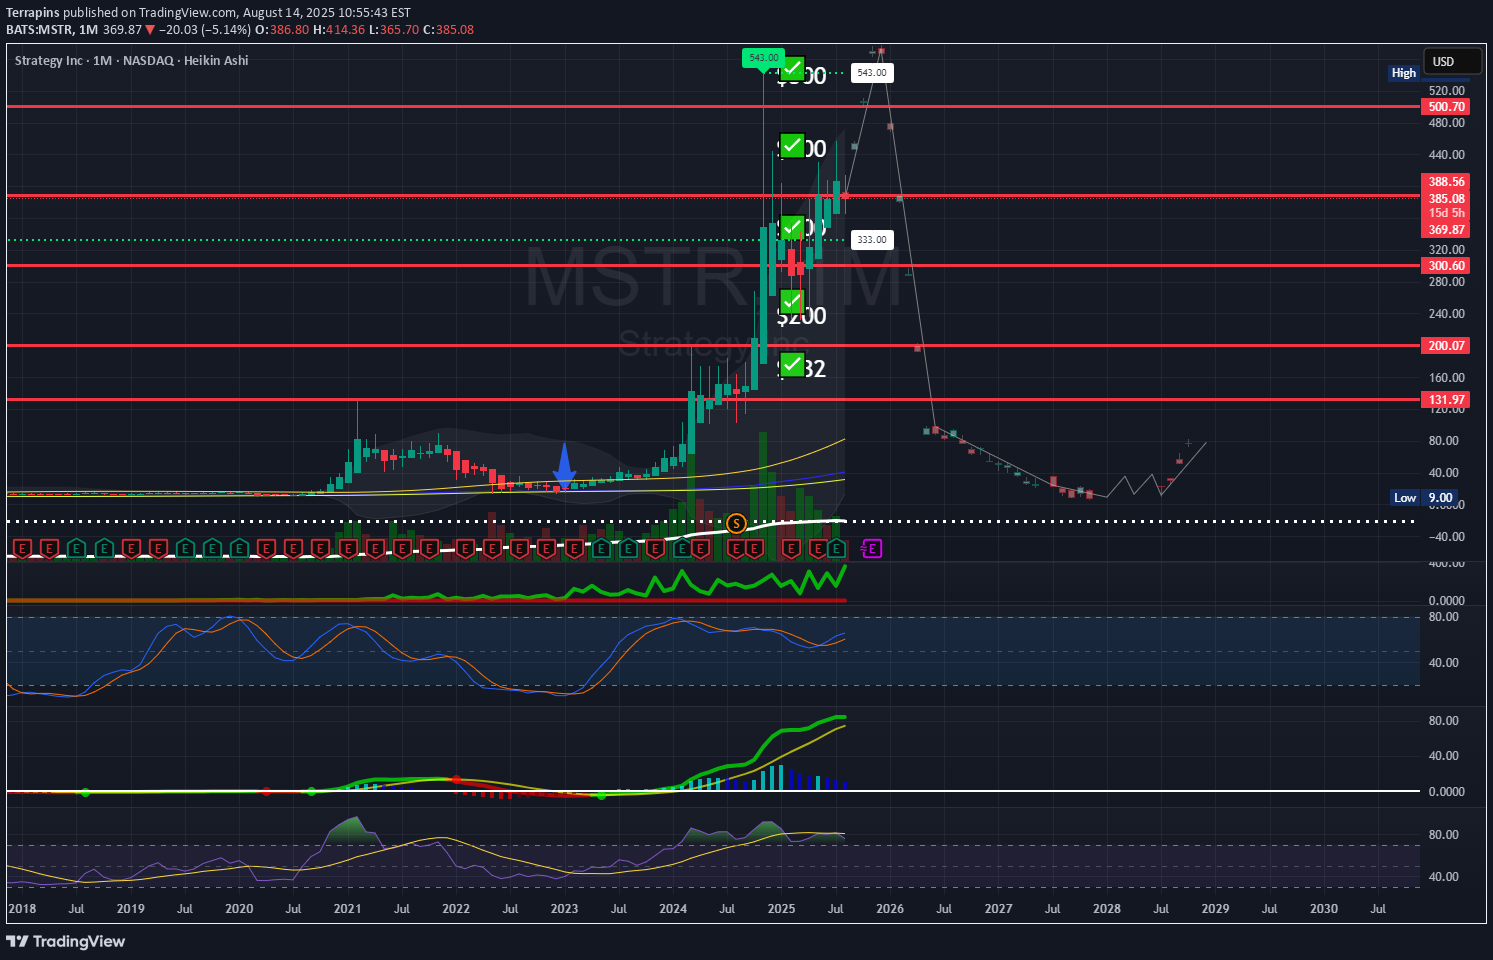
After entering MSTR at $200 in January of 2023, it is evident that MicroStrategy shines as the ideal stock to generate profit day after day. Given its high beta nature and volatility based on Bitcoin's movement, we can price MSTR in a manner that is fixed to Bitcoin's price. The reasoning is that MicroStrategy believes, and has believed, that BTC is the most appropriate store of value now and in the future. It appears that they may be correct. I am anticipating MSTR to surpass $1750-1775 and reach $2,000. BTC should hit $75,000 at that point. This is where I will decide to sell off some shares in anticipation of a price correction down to $800-$1250 per share of $MSTR. At this time, I believe Bitcoin will fall to 52K to 55K. It should, in order to make sense, considering liquidity in the market. As of 3/13/2024, it costs $42,000-$47,000 USD to mine 1 BTC , based on the average cost of electricity globally. I believe we will see a very common "sell the news" event come April prior to, or during, the halving. Bitcoin will correct. The halving will double the complexity to mine one Bitcoin, which will push the electricity cost to the range of $84,000-$95,000 USD. This will be the next gap up, and Bitcoin will continue to reach historical highs. Stay tuned.Price action is tracing Bitcoin, as expected. There's been a drop from $73,000-$74,000 USD for 1 BTC to a $63,000 USD for 1 BTC , as of 03/19/2024. This has played out in less than two weeks time. $700-$800 would be the price-fixed support level for MSTR based on a $52,000-$55,000 USD $BTC.Here is the updated Daily for more precise values. I made a mistake by indicating that the downtrend would take 379 days.Here's an update of my chart view. Note: My predictions have remained the same. Please read previous updates to this idea. We did touch $2000 as I predicted in my March 13th, 2024 posting. Now, the crash.WOW, look at the chart follow my line down... almost perfect! There was the anticipated crash as mentioned last week. Will it further down to 52-55K? It is hard to say at this stage. I simply don't know. We're at a break point. Either we spike back towards a 100K BTC or we fall more to a 52-55K $BTC. I won't re-enter unless it does fall down to a $700-$1000 MSTR or a $52,000-$55,000 BTCUpdates will be coming soon as we've surpassed the previous ATH of $73,000-$74,000 USD for 1 BTC. A new post will be delivered this weekend. Any questions please ask in the comments and they will be answered.After observing MSTR's consistent beta movement of 1.59x relative to Bitcoin, it's evident that MicroStrategy continues to shine as the ideal stock for capturing leveraged Bitcoin exposure. Given its high beta nature and volatility based on Bitcoin's movement, we can pretty effectively price MSTR in a manner that is fixed to Bitcoin's price movements. Current Position Analysis - MSTR: $272.36 (on Friday) - BTC: $76,417 (on Friday) The reasoning remains solid - MicroStrategy believes, and has believed, that BTC is the most appropriate store of value now and in the future. The evidence continues to support their thesis. Price Targets I am anticipating MSTR to reach $317-343 when BTC hits the $85,000-90,000 range. This is where strategic position management becomes crucial. A partial position reduction would be smart in anticipation of a significant price correction. Expected Correction The correction should take MSTR down to the $143-157 range, coinciding with Bitcoin pulling back to $52,000-55,000. This retracement makes sense from a market liquidity perspective and aligns with typical crypto market cycles. Mining Economics Current mining expenses suggest a fundamental floor. After the next period of mining difficulty adjustments, we expect production costs to create natural price support. This economic reality will drive the next significant move upward. Long-Term Projection The longer-term outlook points to MSTR reaching approximately $502 when BTC achieves $120,000. This projection is based on: - Maintained 1.59x price correlation - Historical movement patterns - Mining cost economics - Market liquidity cycles Trading Strategy 1. Current Levels to $85,000 BTC - Hold existing positions - Add on minor pullbacks - Target MSTR: $317-343 2. $85,000-90,000 BTC Range - Begin scaling out positions - Lock in profits - Prepare for correction 3. Correction Phase - BTC Target: $52,000-55,000 - MSTR Target: $143-157 - Prime accumulation zone 4. Recovery and Consolidation - BTC: $70,000-73,000 - MSTR: $238-253 - Rebuild positions 5. Long-term Movement - Final Target: MSTR $502+ - BTC Target: $120,000 - Scale positions accordingly ------------------ Current Snapshot as of 11/10: BTC: $80,500 (up from our last analysis at $76,417) Change: +$4,083 (+5.34% increase) Expected MSTR movement: 5.34% × 1.59 = 8.49% increase Therefore, MSTR should theoretically be around $295-$300 (from $272.36) We're approaching our predicted range of $85,000-90,000 BTC faster than anticipated! If the 1.59x correlation holds: At BTC $85,000: MSTR should hit ≈ $317 At BTC $90,000: MSTR should reach ≈ $343 Please note that we're in the profit-taking preparation zone. The rapid move toward $80,500 suggests really strong momentum. The correction target ($52,000-55,000) becomes more relevant as we push higher too.Target of $300 for MSTR has been hit at 9:30AM EST on 11/11/2024. BTC has reached $82,200 roughly.History has been made for MSTR today. MSTR has crossed through $333 per share, which was the ATH set during the week of March 6th in the year 2000. Microstrategy has not seen this all-time high since the DOT COM bubble in 2000! This is pretty remarkable.Speechless. 🤐Citron short volume today reports that the volume has completely detached from Bitcoin fundamentals. I agree! Remember what I said... If the 1.59x correlation holds: At BTC $85,000: MSTR should hit ≈ $317 At BTC $90,000: MSTR should reach ≈ $343 At BTC $120,000: MSTR should reach ≈ $502
Terrapins

The weekly MACD hasn't been drawn yet so there's likely more impact by the daily MACD on the price point. BONK has seen .00004 as a high, so it's possible there's shorts waiting to get rekt at the top. Expecting a slow climb back towards .00004. Take note of the rising stochastic and MACD. Long/shorts ratio has taken a standstill at .000012 to .000014 indicating there's a supply level there. If it does fall to .000012 I would pick up more. A great 2-3X hold.Idea came to fruition. Thanks. Next target will be BONK dropping a 0. Would not be surprised to see it drop 2 0's over the year, mkt cap and volume from SOL can be pushed to BONK quickly. T1: .00004 ✅ T2: .0001 ❓ T3: .001 ❓Bollinger Bands on the 8HR are squeezing. Stochastic is in a healthy range of 20-80 (between the Red & Green lines). CM_Ult_MacD_MTF is a great indicator for Moving Average Convergence Divergence. -> It is showing a decreasing downtrend movement. Pressure is moving back to the Longs vs Shorts. We can see this is true with the Longs vs Shorts Ratio as it is increasing ever so slightly. A potential set-up soon for another breakout towards past .00004..000027 Entry 1 .000022 Entry 2The 8HR is indicating that a price jump may occur. Let's look at the daily chart too though. (Below)Daily chart to supplement the 8HR chart (Above). Daily charts says there's still a possibility we could have a pullback down to .0000222 / .000027. BUT. the 8HR shows that: Volatility/volume is decreasing. Long ratio is still ever so slightly increasing. MACD is still progressively decreasing. My favorite indicator is SQZMOM_LB with CM_Williams_Vix_Fix because we can have a better visualization for "IF" a squeeze is a possibility soon. These are telling signs that there's token accumulation at (or around) .00003.ENTRY 1 and 2 have been hit as of 03/19/2024 @ 8:45AM EST. It looks like we are continuing in a downtrend. I will continue to average my position down at .0000175. This would be our last liquidation level.We've hit the .0000222 mark and I'm seeing consolidation around this price point. It is still possible to see BONK drop to .0000175 so don't be overconfident on a high leverage play just yet. Watching the 4HR and 8HR is important now.This is a continuation for BONK as our T1 of .00004 was achieved on March 8th/9th. Our next target will be BONK dropping a 0. Again, I would not be surprised to see it drop 2 0's over the year, mkt cap, and volume from SOL can be pushed to BONK quickly. T1: .00004 ✅ | March 8th/9th T2: .0001 ❓ | TBD T3: .001 ❓ | TBD ___________________________________________________________ Since BONK has dropped below .00004, I will continue the idea back to .00004. See the DAILY chart for BONK. Long / Shorts seems to be have hit a wall and trending back up towards the Longs. CM_Ult_MacD_MFT chart has drawn a Green Dot on the MACD, which indicates a potential breakdown and trend reversal. In addition, the SQZMOM_LB chart is revealing an upcoming "squeeze" or, really it is just additional confirmation on top of the CM_Ult_MAcD_MFT chart that there is a trend reversal and prices will begin to climb. Let's watch it climb towards the new T1, T2, until it hits .00004 (T3) again. July should be an interesting time for crypto.Quick chart update. We didn't touch, but almost barely touched our support of .0000175 ✅.New update coming soon as we've escaped the End of Summer downtrend.BONK for the last 3 months has been hovering between the support and T1. Yesterday night, BONK drew a green dot on the CM_Ult_MacD_MTF chart, indicating there's a trend reversal underway upwards. The MacD is my favorite give away. Stochastics along with the Long / Short Ratio tells us right now that there's an increase in longs and it's trending towards being "overbought", but it's not there yet. The price is well-placed in my opinion. Long / Short Ratio is displaying a jump in Longs vs. Shorts - it looks like on Thursday/Friday a considerable amount people jumped on board the BONK train going long. I've noticed that the CM_Williams_Vix_Fix chart tends to become sluggish when a breakout is soon to occur, usually within the next two weeks. See April 20th to May 20th on the Daily... Notice that VIX momentum decreases, while the MACD increases, and Stochastics increase. VIX flattens out, MACD hits the ceiling and trends down, Stochastics hit overbought and trends down to oversold - then, it finally takes off. I suspect a similar movement, where the VIX will flatten out for BONK, which indicates an "agreement" on the consolidation of the price. I would not like to see it fall below .00002 anymore, but I will not change the supports and targets I've had all along. I am re-entering the trade at .00002175, however on a 2-3X long so I will not liquidate if we hit our support again. I placed a limit buy at .0000175 just in case, to average down my buy-in. Good luck with your trades the next month and a half to everyone. This is an exciting time.The weekly is used for confirmation bias. It can be a strong tool in the shed. Stochastic are telling us that BONK is neither overbought or oversold. CM_Ult_MacD_MTF has drawn a green dot, which is a very strong indication to me that we are approaching a breakout. SQZMOM_LB is showing a reversal too. This indicator tends to point out when a potential squeeze is about to occur over the next two or three weeks. Cheers 🍻T1 has been reached! BONK should acquire its next targets as Bitcoin climbs toward 85,000-90,000+.T2 has been reached! T1: .0000275 ✅ | November 10th T2: .0003375 ✅ | November 12th T3: .0004 ❓ | TBDT3 has been reached only hours later! T1: .0000275 ✅ | November 10th T2: .00003375 ✅ | November 12th T3: .00004 ✅ | November 12th Next target is: .0001 ❓ | TBD👍🍻Looks like BONK is about to go up.
Terrapins

Anticipating a breakout to >=$15 over the next few months.This is still in-line with the trend analysis. Average pos @ 1.9Accumulating more BAND at 1.7A long awaited update! BAND's 200 WEEK MA has been drawn. At 4 Bucks! Take notes📝 We will see rapid accumulation and climb towards $4. Once, $4 I will re-update. I expect to see an overall "progressive" climb to $8.7-$10.👀🚀 soon?Monthly Chart update.Daily Chart to supplement
Terrapins

Technical Analysis Overview Current Price : $3.7605 Weekly Trend : A decrease of 27.10%, indicating recent bearish sentiment. 1-Month Trend : An increase of 8.98%, showing some recovery. 6-Month and Yearly Trends : Impressive growth of 289.95% and 260.09%, respectively, highlighting a strong bullish trend in the medium to long term. Advanced Technical Indicators Relative Strength Index (RSI) : Approaching overbought territory, signaling a potential reversal or consolidation in the short term. Moving Average Convergence Divergence (MACD) : Suggests a bullish crossover, indicating strong buying momentum. Chart Patterns and Analysis Bullish Triangle Pattern : Indicating a potential breakout and continuation of the uptrend. Falling Wedge Patterns : Multiple patterns suggest a diminishing selling pressure and a possible trend reversal. Unique Insights Potential for a Major Rally : Analysts have identified key levels for a potential 10x payout, suggesting that FTT might be gearing up for a significant rally. Impact of External News : News flow and external events, such as regulatory changes or developments within the FTX ecosystem, can have a substantial impact on FTT's price. Keeping an eye on these factors is crucial for understanding potential market movements. Market Sentiment and External Factors Market Capitalization : $1.234B USD. Trading Volume Analysis : High trading volume of $191.331M USD with a significant volume/market cap ratio. Recent News Coverage Impacting FTT FTX Trading and FTX Digital Markets Settlement ( PYMNTS.com ): A unified approach to valuing customer claims could impact FTT's valuation and distribution. Valuation Rules Set by FTX and Bahamas Liquidators ( Bloomberg.com ): Crucial for determining the valuation of FTT in bankruptcy proceedings. Unified Asset Distribution Deal ( CryptoSlate ): Streamlining the asset distribution process within the FTX ecosystem. FTX's Bankruptcy Exit Plan ( Banking Dive ): Involves valuing assets at their November 11, 2022, rate, affecting FTT's value. FTX's Crypto Asset Liquidation ( Watcher Guru ): The liquidation of $240 million worth of crypto assets, including FTT, could influence its market price. Conclusion FTT presents a complex picture with both short-term bearish and long-term bullish trends. The technical indicators suggest strong buying momentum, but overbought conditions signal caution. The recent news, particularly the settlement and bankruptcy proceedings, directly impacts the valuation and liquidity of FTT.Our first bullish flag on the 8HR. Will continue to monitor for one on the 1D.second bullish flag on the 8HR.I will enter here at $1.60 as there is a squeeze happening here on the 8HR chart. There is also somewhat of a "cup" forming along the price point of $1.60. I will enter here, but a small amount of my position size. I am going to see if it is shorted further to $1.135 (shown in my older images) and then CMP my position there some more.Update for February 20th, 2024: There's an undeniable squeeze occurring on the daily chart. There is also evidence that it broke out of the converging triangle/falling wedge that was more-or-less validation for its previous price and downfall. I am CMPing my position and doubling down here. I don't ever use more than 20X on my positions and I always (try to) put forth 5% (OK, sometimes 10%!) of my balance for position sizes.Nothing special, as expected.
Disclaimer
Any content and materials included in Sahmeto's website and official communication channels are a compilation of personal opinions and analyses and are not binding. They do not constitute any recommendation for buying, selling, entering or exiting the stock market and cryptocurrency market. Also, all news and analyses included in the website and channels are merely republished information from official and unofficial domestic and foreign sources, and it is obvious that users of the said content are responsible for following up and ensuring the authenticity and accuracy of the materials. Therefore, while disclaiming responsibility, it is declared that the responsibility for any decision-making, action, and potential profit and loss in the capital market and cryptocurrency market lies with the trader.