Technical analysis by Terrapins about Symbol TOSHI: Buy recommendation (1/26/2025)

Terrapins
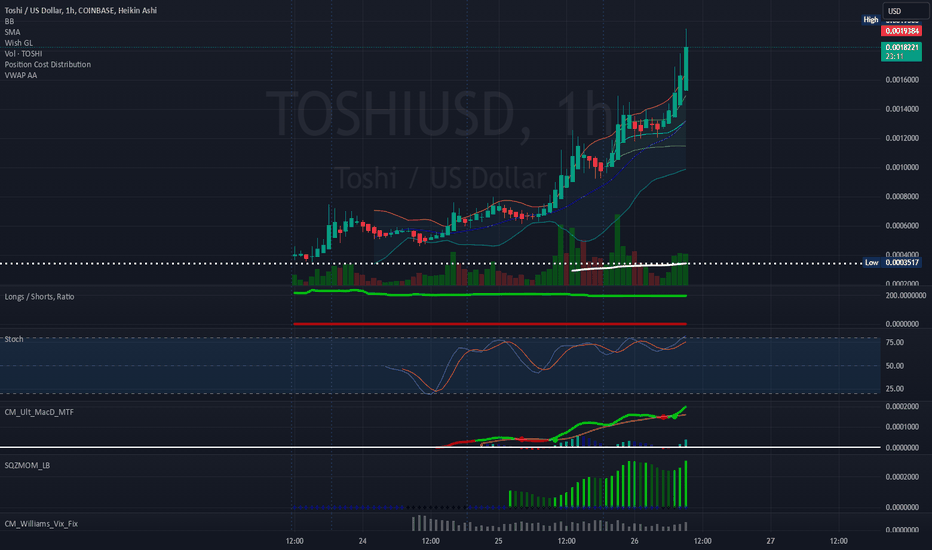
Daily Chart: 1H Chart: Check out: twitter.com/Toshi_base toshithecat.com/ It appears that TOSHI is a Base network MEME token surrounding Brian Armstrong's Cat, Toshi. This MEME coin seems unique in the sense that it functions much like Solana. It has it's own marketplace for generating unique tokens to list on DEXSCREENER. I think this token is promising, considering it is fairly "new" to the multiple CEX's now. Exposure to the token is increasing. I feel like technical indicators can't really come into play until the 2HR, 4HR, 8HR, and 1 day charts can really start drawing. The Market Cap is under 1B. PEPE's Market Cap is somewhere around 6.3B right now (1/26/25). There's significant potential for this coin and I think it could reach .01 with a 2.5B-3.5B market cap. Lastly, I noticed TOSHI offers NFToshi's and NFToshi 2.0's. Following this buzz, I think this will draw attention to the their NFT's which will also see a floor increase. NFToshi's: rarible.com/collection/base/0xbdb1a8772409a0c5eeb347060cbf4b41dd7b2c62 NFToshi 2.0's: magiceden.us/collections/base/0xbc72A61bD9511C7CF9eD7E4B0cAC1b8D0FBa4bC6 I appreciate any comments. Thanks.It's been 1 hour since making this post and TOSHI has already touched .0025... Crazy.The 15 minutes trending up 30 minute chart is about to trend green: I'm expecting a huge pumpTypically, I steer clear of my doodle's to predict the market structure, but this is healthy normal looking market structure unfolding. I am providing supplemental charts: 2HR Chart: 4HR Chart: 8HR Chart: Note, that it takes 17 candlesticks in order for the indicators to begin drawing on the Stochastics and MACD, which is significant for determining entries.8HR Chart (Updated w/ more time data) There's bounces between .001 and .00125. Consolidation around .001.8HR Chart (Updated with more time data): I'll make my next update in 3-4 days when the Daily chart is able to draw indicators. It needs 17 total days for that to occur on this chart.Daily Chart (finally drew stochastic data): Consolidation at .00065-.007 It looks like (along with BTC) there's an 8 hour push upward as the stochastics low and MACD too along with a BTC consolidation at 92,000-96,000. I would not be surprised to finally see TOSHI gain upward momentum back towards .00125 or .0015.8 Hour Chart (updated with more time data):
