
RajaSaien
@t_RajaSaien

What symbols does the trader recommend buying?
Purchase History
پیام های تریدر
Filter
RajaSaien
تحلیل فیلی کوین (FIL): شکست الگوی گُوِه نزولی و شانس انفجار صعودی!
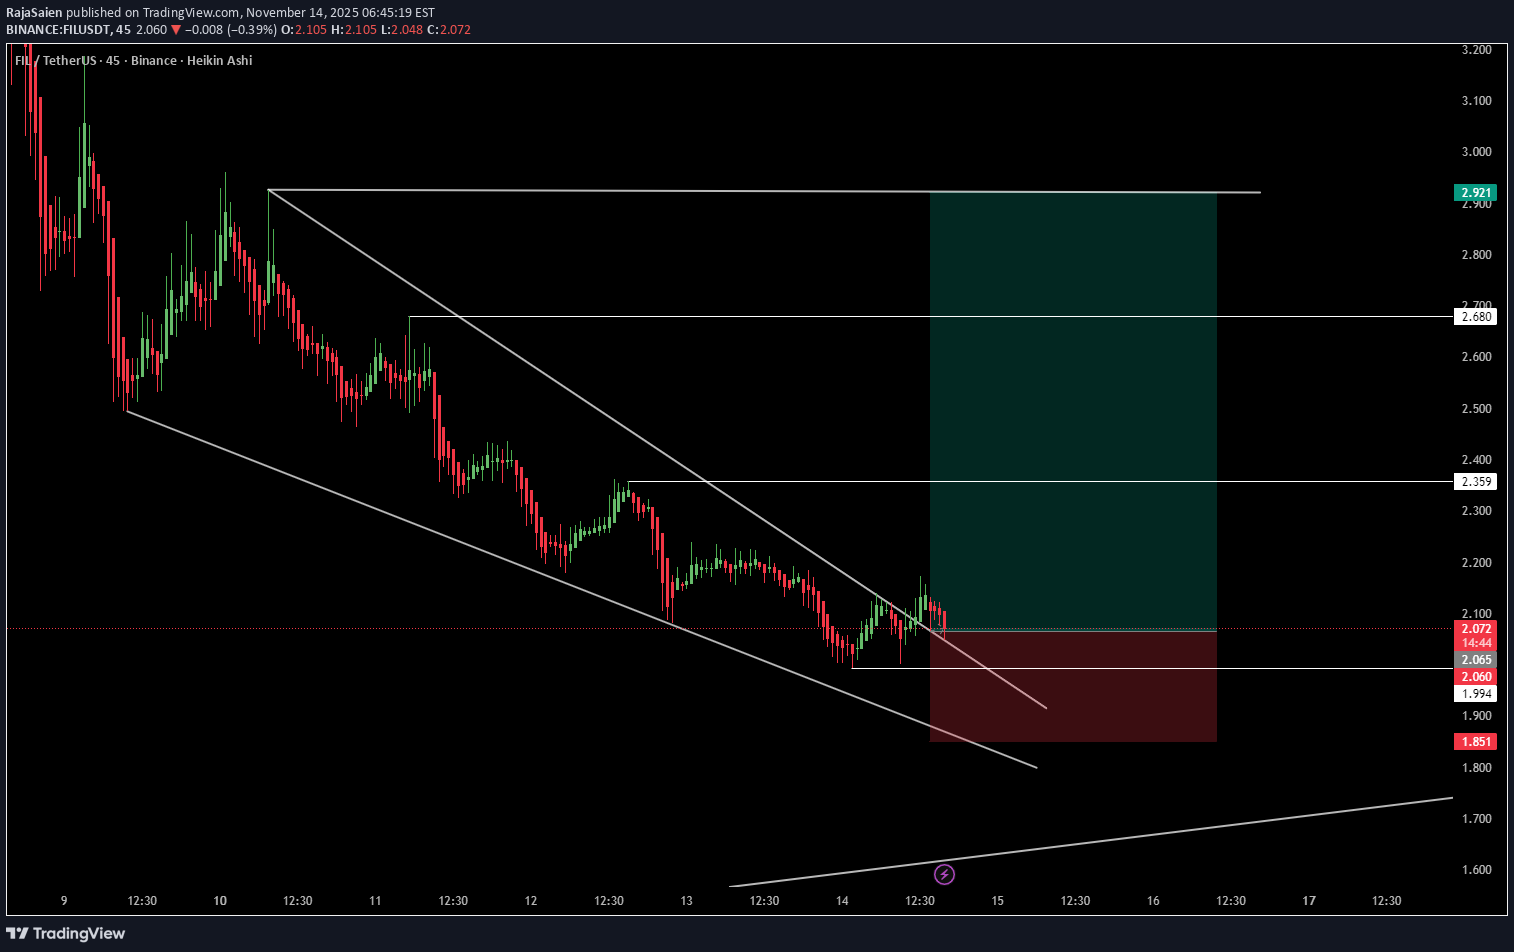
FIL/USDT has broken out of a clean Falling Wedge pattern on the 45m timeframe and is currently retesting the upper trendline. This retest zone is a high-probability area for bullish continuation if buyers hold above the breakout level. 📈 Technical Highlights Falling Wedge breakout successfully completed Price retesting the trendline support Bullish structure forming above $2.06 Strong upside targets if retest confirms 💹 Trade Plan Entry: $2.06 – $2.10 Stop Loss: $1.85 TP1: $2.35 TP2: $2.68 TP3: $2.90 ⚠️ Invalid Scenario If FIL closes below $2.04 (45m candle), the retest fails and bullish setup becomes invalid. 📢 Note This is a technical analysis idea only — not financial advice. Always manage risk and trade safely.
RajaSaien
Technical Analysis (SSV/USDT – 4H)
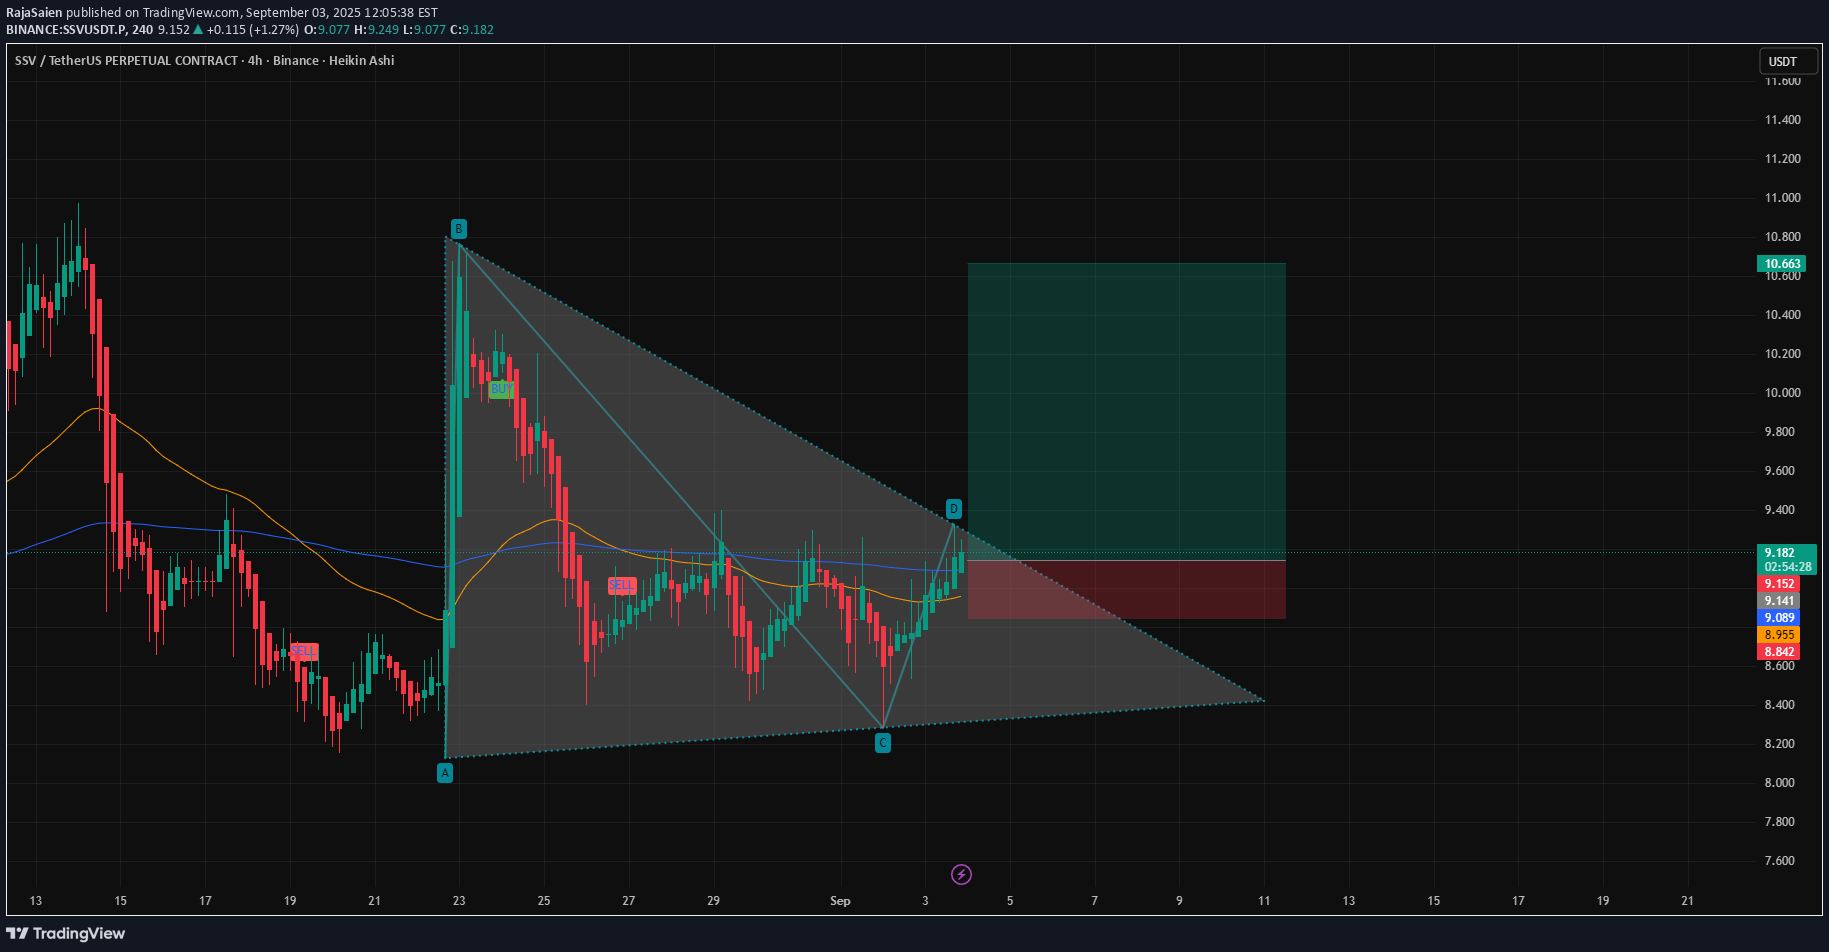
1. Pattern The chart is showing a descending triangle / falling wedge structure (A–B–C–D). Price has moved up strongly from point C → D, now testing the upper trendline resistance. If breakout happens above 9.20–9.30, bullish momentum can accelerate. 2. Key Levels Immediate Resistance: 9.20 – 9.30 (trendline + supply zone). Next Targets: TP1 → 9.60 TP2 → 10.20 TP3 → 11.00 (extended breakout target). Support Levels: 9.00 (short-term EMA + round number). 8.95 (200 EMA). 8.60 (lower wedge support). 3. Indicators EMA Structure: Price is trading just above 50 EMA (orange) and 200 EMA (blue) → early bullish signal. If 50 EMA crosses 200 EMA, trend confirmation will strengthen. Momentum: Recent bullish candles show strength; watch for volume confirmation. 4. Scenarios Bullish (High Probability): Break and close above 9.30 → opens the way to 9.60 → 10.20 → 11.00. Bearish (Low Probability): If rejection occurs, price may retest 9.00 → 8.95 support, possibly even 8.60. 📌 Trading Plan Entry (Aggressive): Current zone (9.15–9.20), anticipating breakout. Entry (Conservative): Wait for 4H candle close above 9.30. Stop Loss: Below 8.85 (safe zone under support). Targets: 🎯 TP1: 9.60 🎯 TP2: 10.20 🎯 TP3: 11.00 ✅ Summary: SSV/USDT is at a decisive point near resistance. A breakout above 9.30 will likely confirm a bullish move toward 10+. Until then, caution advised with a stop below 8.85 to manage risk.
RajaSaien
Technical Analysis Of Manausdt 4H
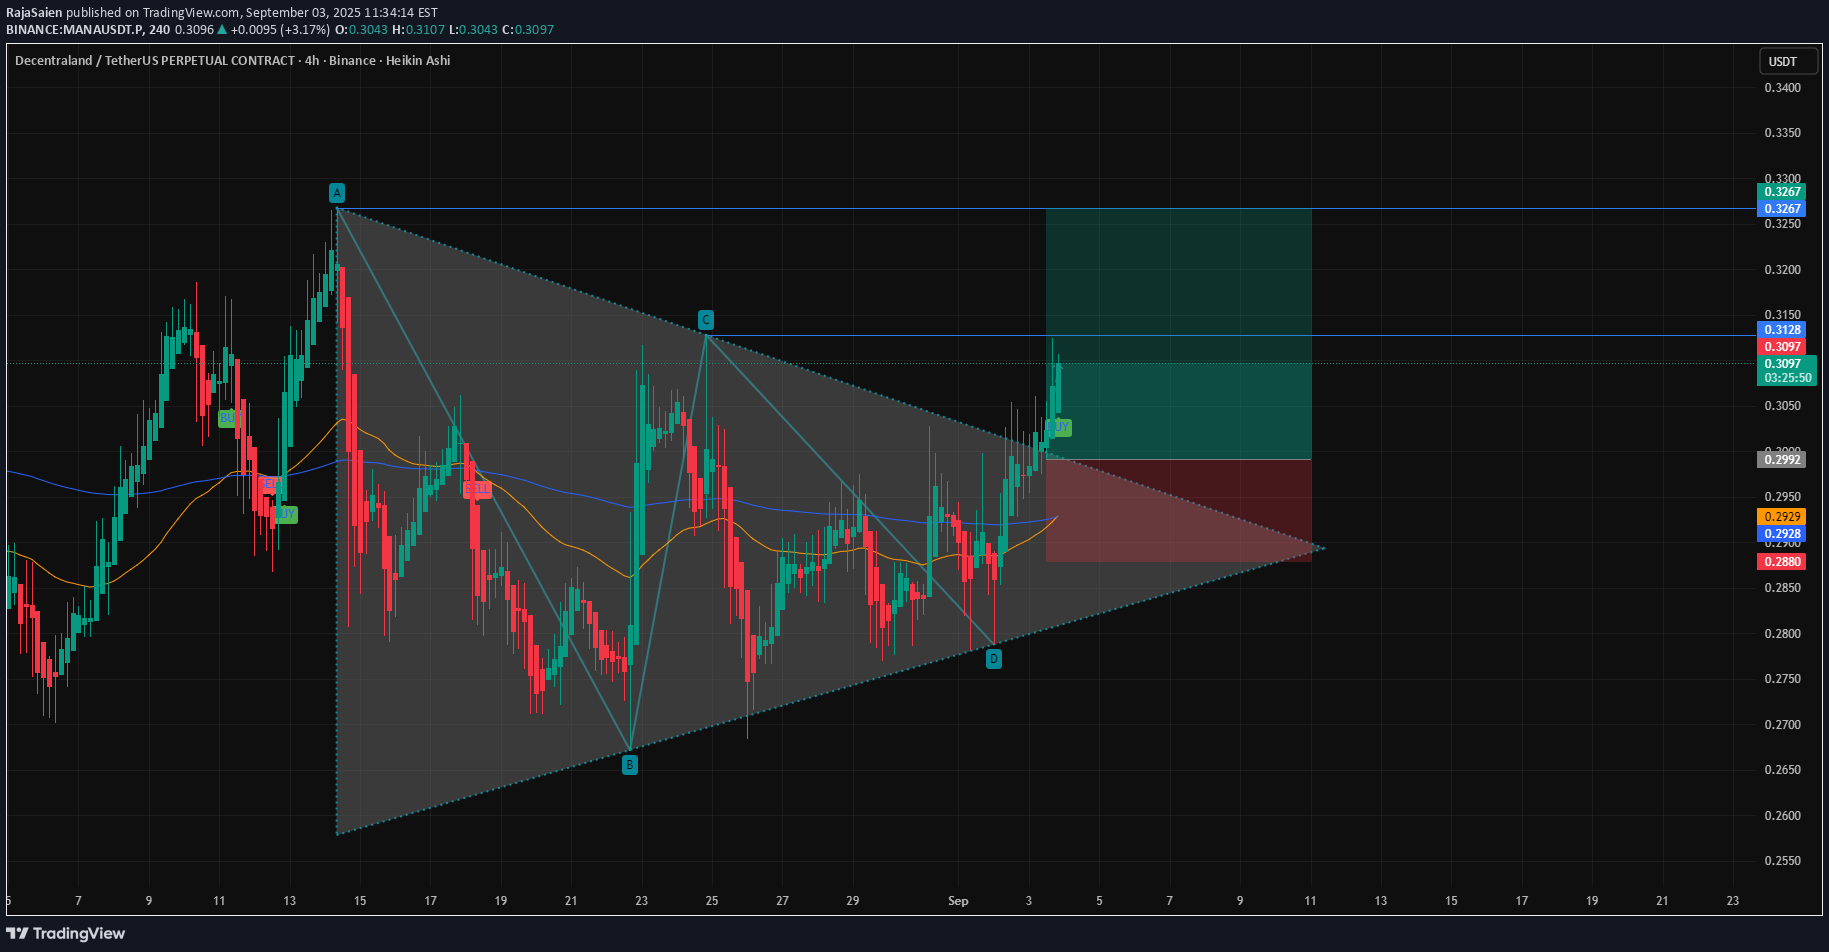
🔎 Technical Analysis 1. Chart Pattern Price has been trading inside a symmetrical triangle (A–B–C–D formation). Recently, it broke out to the upside, signaling a possible bullish continuation. Breakout candles are supported by green Heikin Ashi momentum, confirming buying pressure. 2. Key Levels Immediate Support: 0.2950 – 0.2920 (200 EMA + triangle base support). Current Price Zone: 0.3090 – 0.3100 (post-breakout). Resistance Levels: 0.3128 → First hurdle (just tested). 0.3267 → Next upside target. 0.3400+ → Extended bullish target if momentum continues. 3. Indicators EMA Trend: 50 EMA (yellow) crossing above 200 EMA (blue) → Golden Cross setup, bullish bias. Volume (not shown but inferred): Breakouts from triangles usually need volume; if confirmed, breakout has strength. 4. Potential Scenarios Bullish Case (High Probability): Price sustains above 0.3128, pushes toward 0.3267, and possibly 0.3400. Bearish Case (Low Probability): If price fails to hold 0.3000–0.2950, it could fall back into the triangle and retest 0.2920. 5. Trading Plan Entry (Aggressive): Current levels (0.3090–0.3100) on pullbacks. Entry (Conservative): Wait for 4H candle close above 0.3128. Stop Loss: Below 0.2950 (triangle support + 200 EMA). Targets: TP1 → 0.3128 TP2 → 0.3267 TP3 → 0.3400 ✅ Summary: MANA/USDT has broken out of a symmetrical triangle on the 4H chart with bullish EMA structure. As long as price stays above 0.2950, bias remains bullish with targets at 0.3128 → 0.3267 → 0.3400. Failure to hold above 0.2950 would invalidate the breakout.
RajaSaien
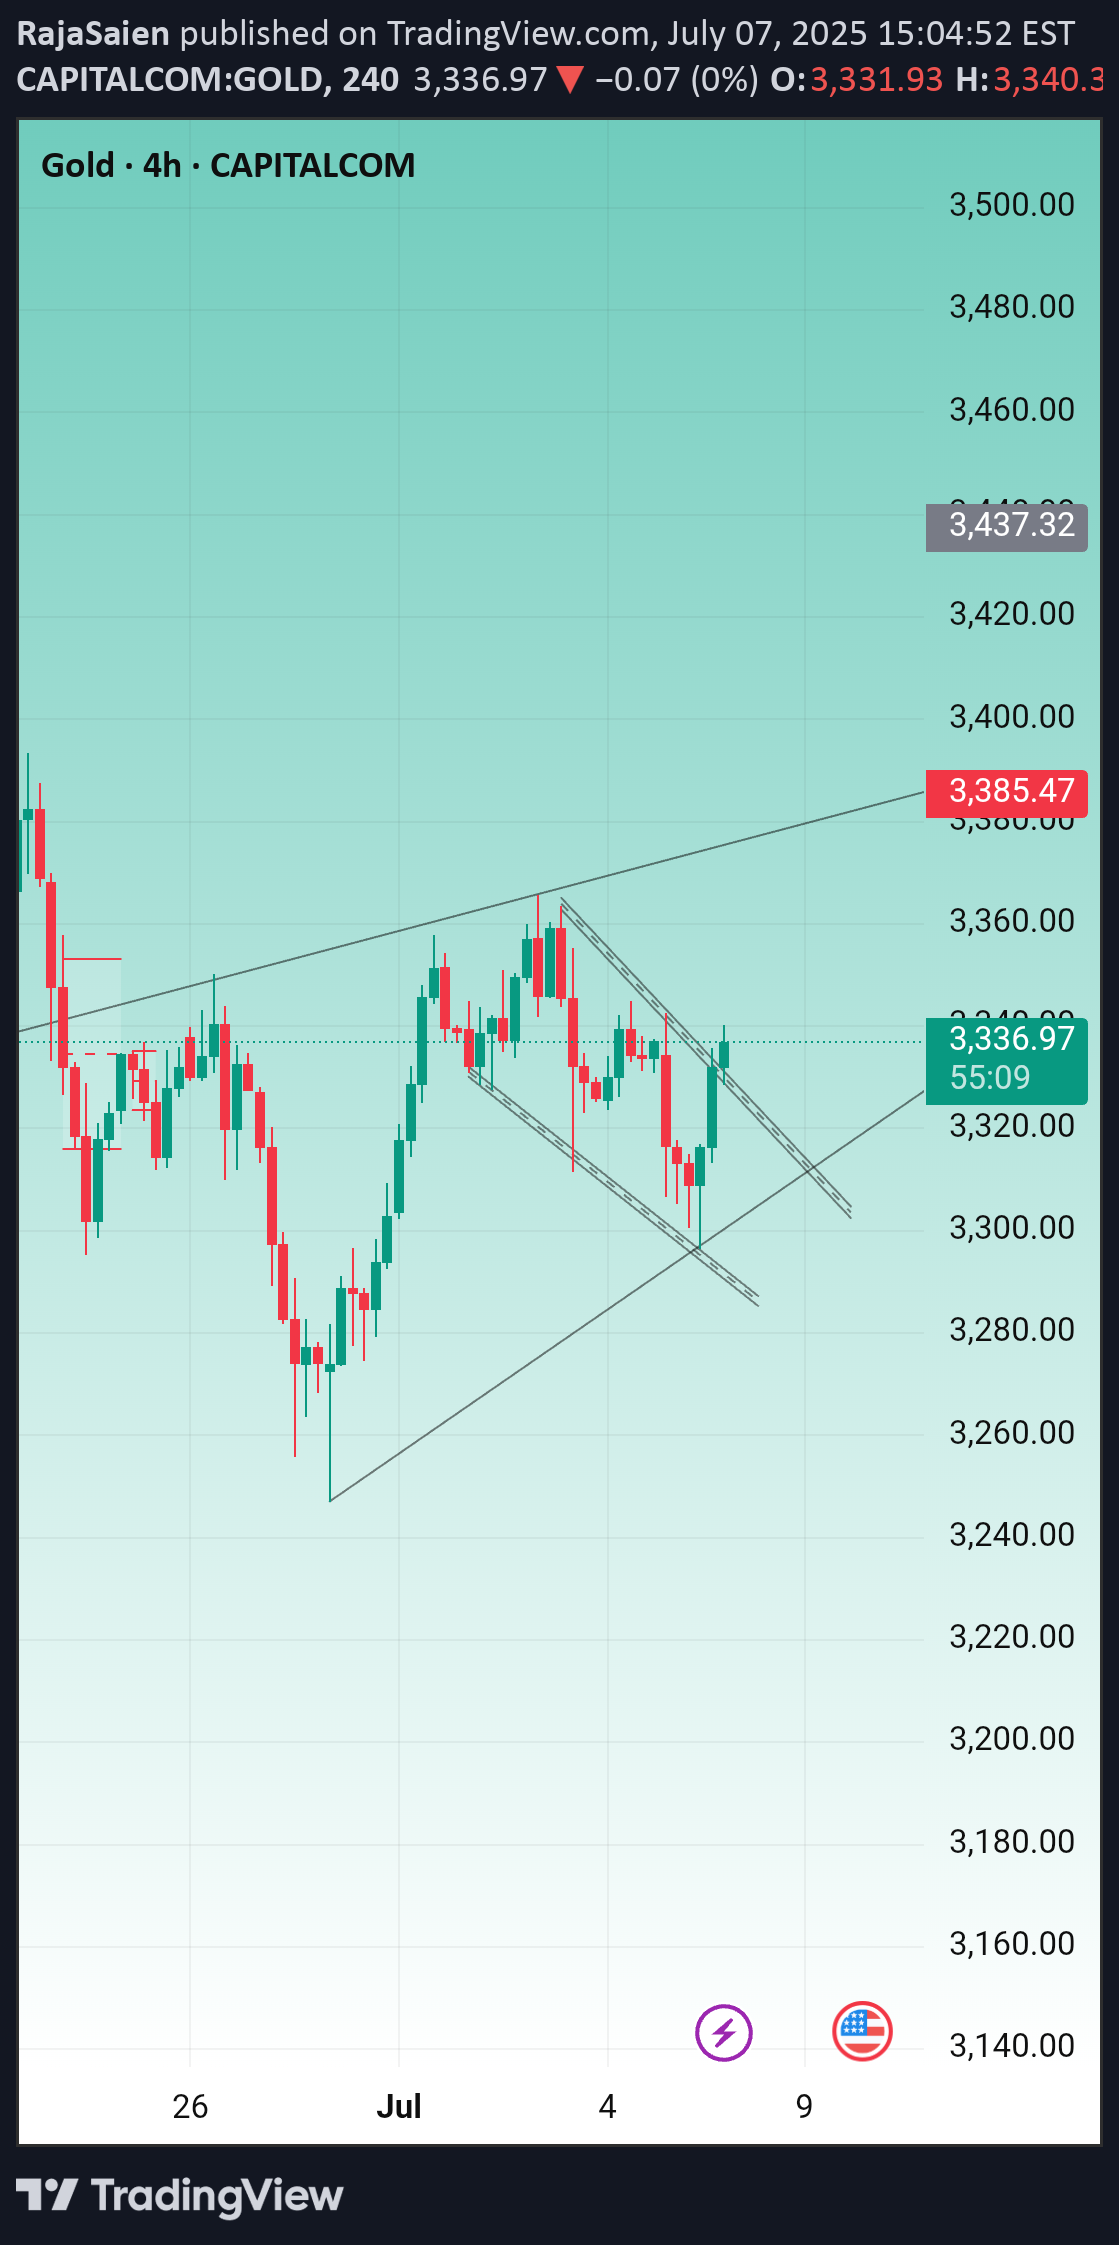
Gold is currently squeezing inside a descending triangle
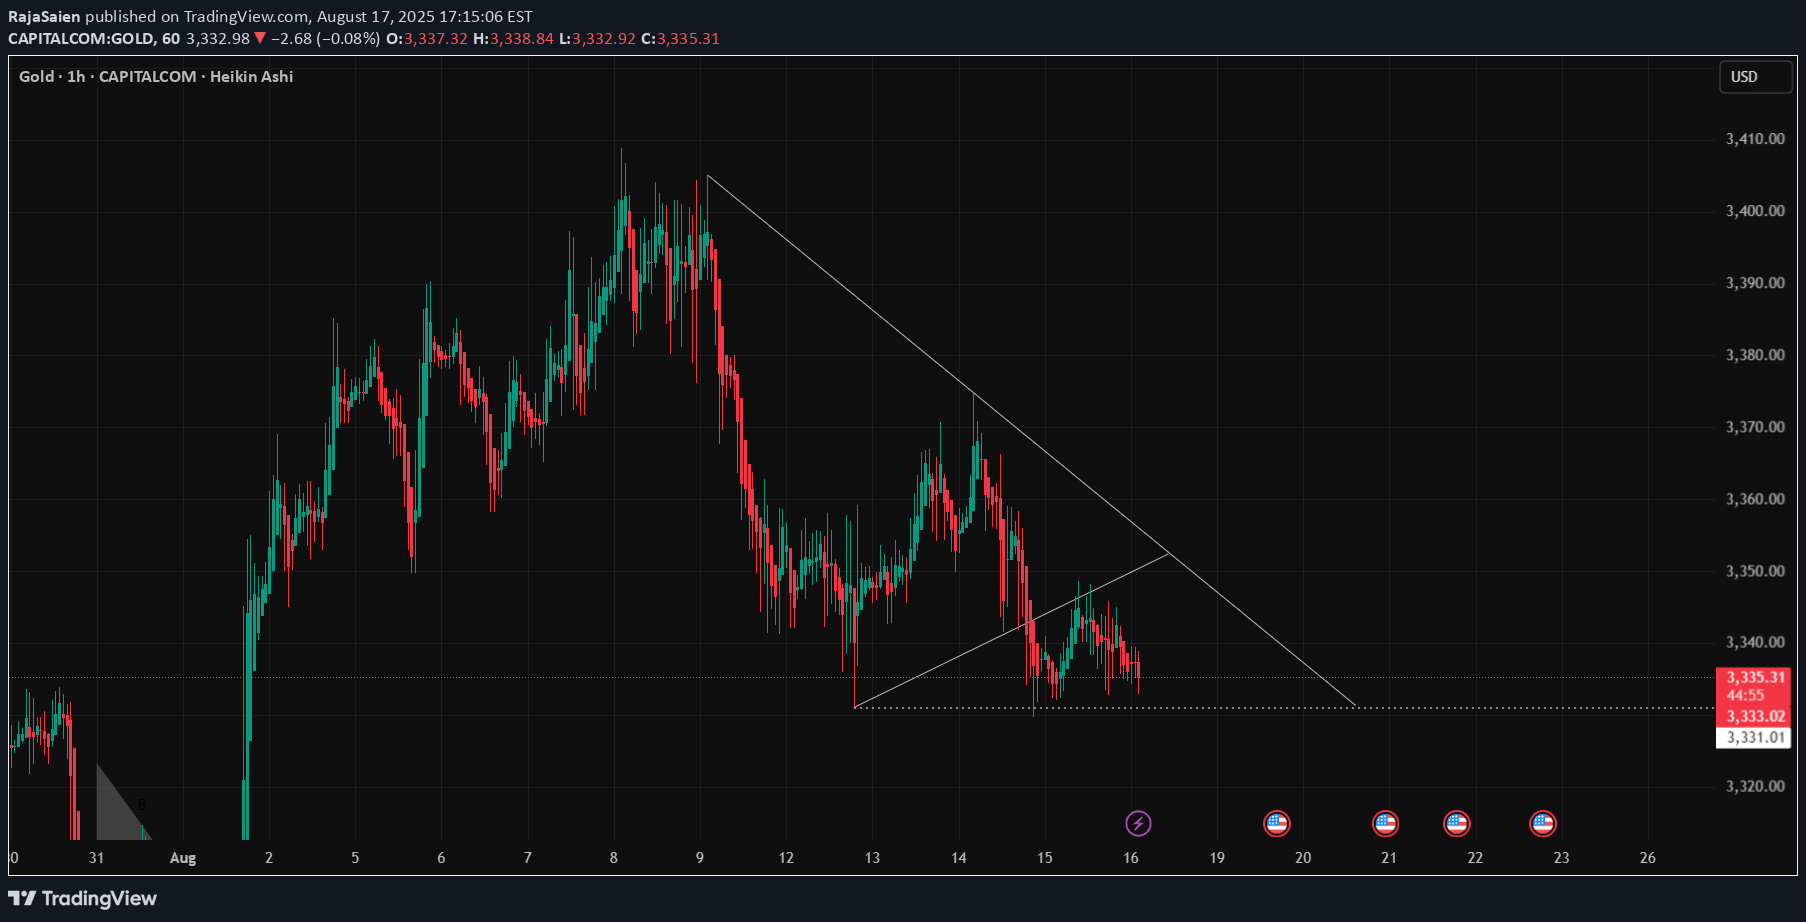
✅ Gold Analysis Update 🏆✨ 📉 Gold is currently squeezing inside a descending triangle 🔺⬇️ — showing that sellers are building pressure. The price is holding below the 200 EMA (orange line), which confirms the bearish sentiment. 👉 If price closes below 3331, we can expect further downside. 🚨 👉 But if price breaks back above 3355–3360, a short-term relief bounce is possible. 📈 ⚡️ In such squeeze setups, patience is the real strategy. Breakouts are always explosive — we just need to wait for the direction! 💯 🔑 Key Levels Resistance: 3355 – 3360 Support: 3331 – 3325 📊 Let’s see which way the market decides to move — stay ready for both sides! 🚀🔥
RajaSaien
Gold Tightening for a Big Move!
🚀 Gold Tightening for a Big Move! 🔥 Look closely, friends — the chart is clearly forming a symmetrical triangle 📈. This means the market is gathering energy, like an arrow being pulled back, ready to be released! 🏹 ⚡ Key Point: The more the price squeezes, the more powerful the breakout will be — whether up or down, the move can be explosive! 💥 📊 Trading Mindset: Patience = Profit 💎 The market is testing you — those who wait will gain the most. Manage your risk, because breakouts from triangles can be extremely fast. 💡 Lesson: “Big money in the market is made not from signals, but from discipline.” 💛 Gold lovers, get ready — the next move could make history! 🏆
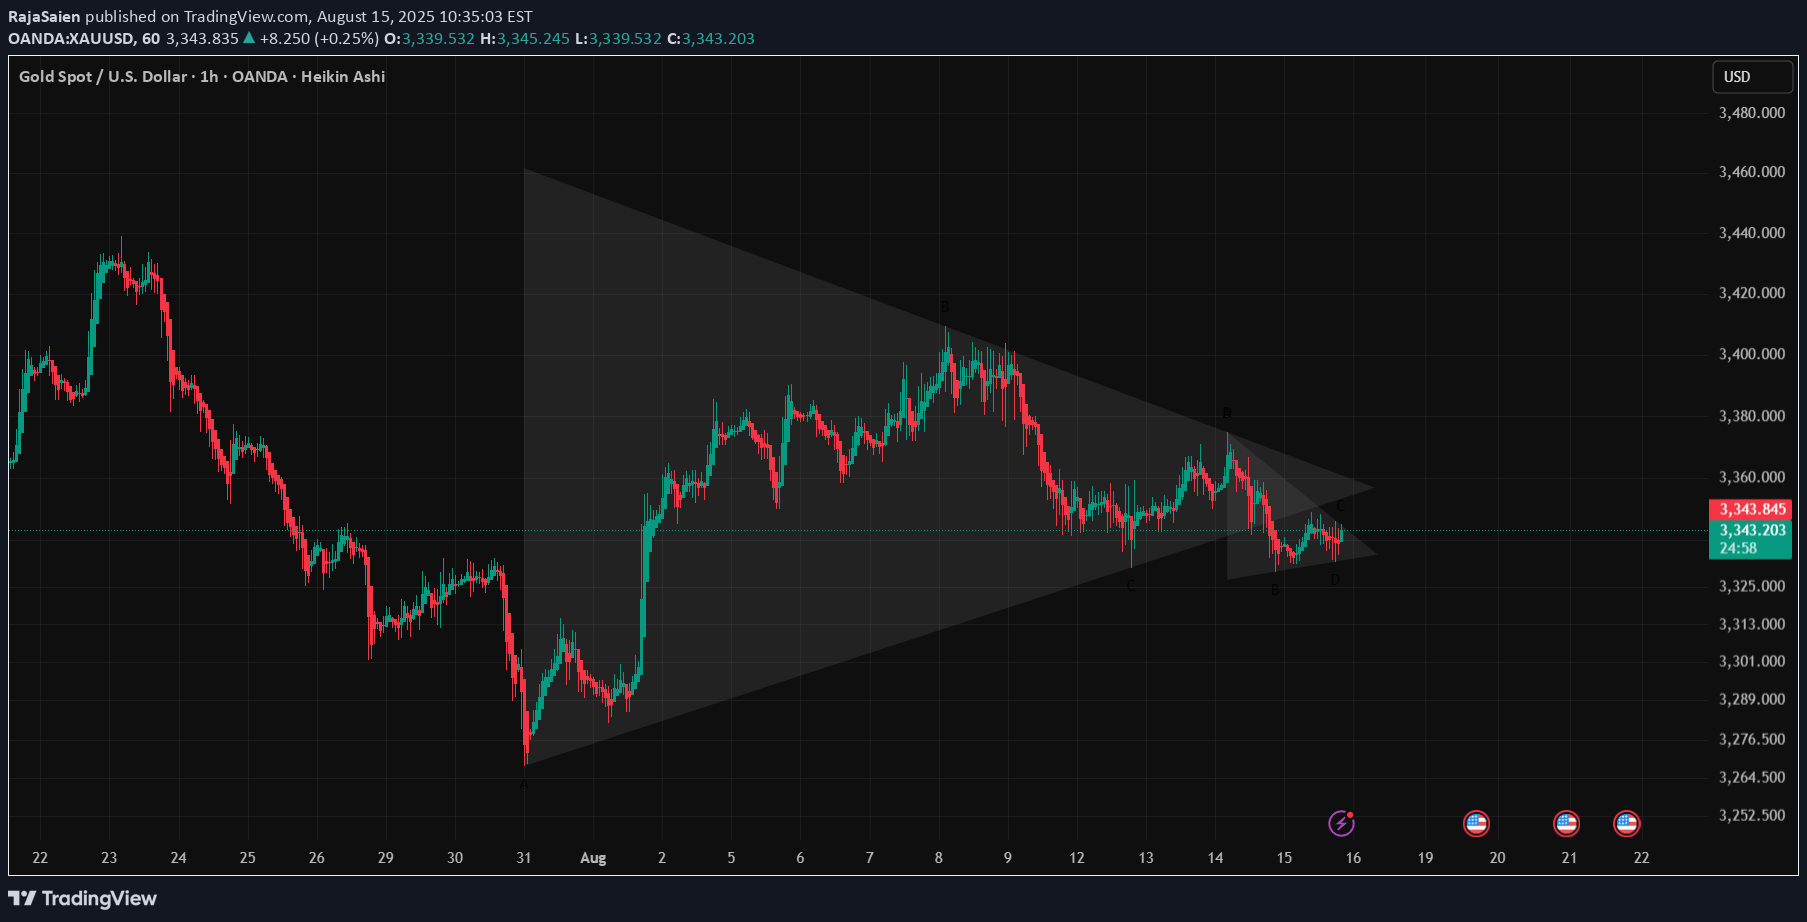
RajaSaien
Gold Breakout + Global News Alert
Gold has just broken out of a falling channel, pushing up to the 3337 level — a clear bullish move! ✅But this isn't just technical... the news is backing it too 🔥📢 The US has imposed a 30% tariff on South Africa and 25% on Malaysia and Kazakhstan 🇺🇸Since South Africa is one of the world’s biggest gold producers, these tariffs could tighten global supply.➡️ That means: Gold prices may rise further due to increased demand and reduced supply.🔍 Technical View:Resistance levels to watch: 3385 and 3437Break above these could take gold towards 3540+📊 This is a perfect example of how Technical + Fundamental = Powerful setupTrade smart. Don’t just follow price — follow the reason behind it too! 💹#GoldBreakout #MarketUpdate #SmartTrading #GoldNews #TariffImpact #RajasTrading
RajaSaien
sol usdt pattern identified inverse head and shoulders with chan
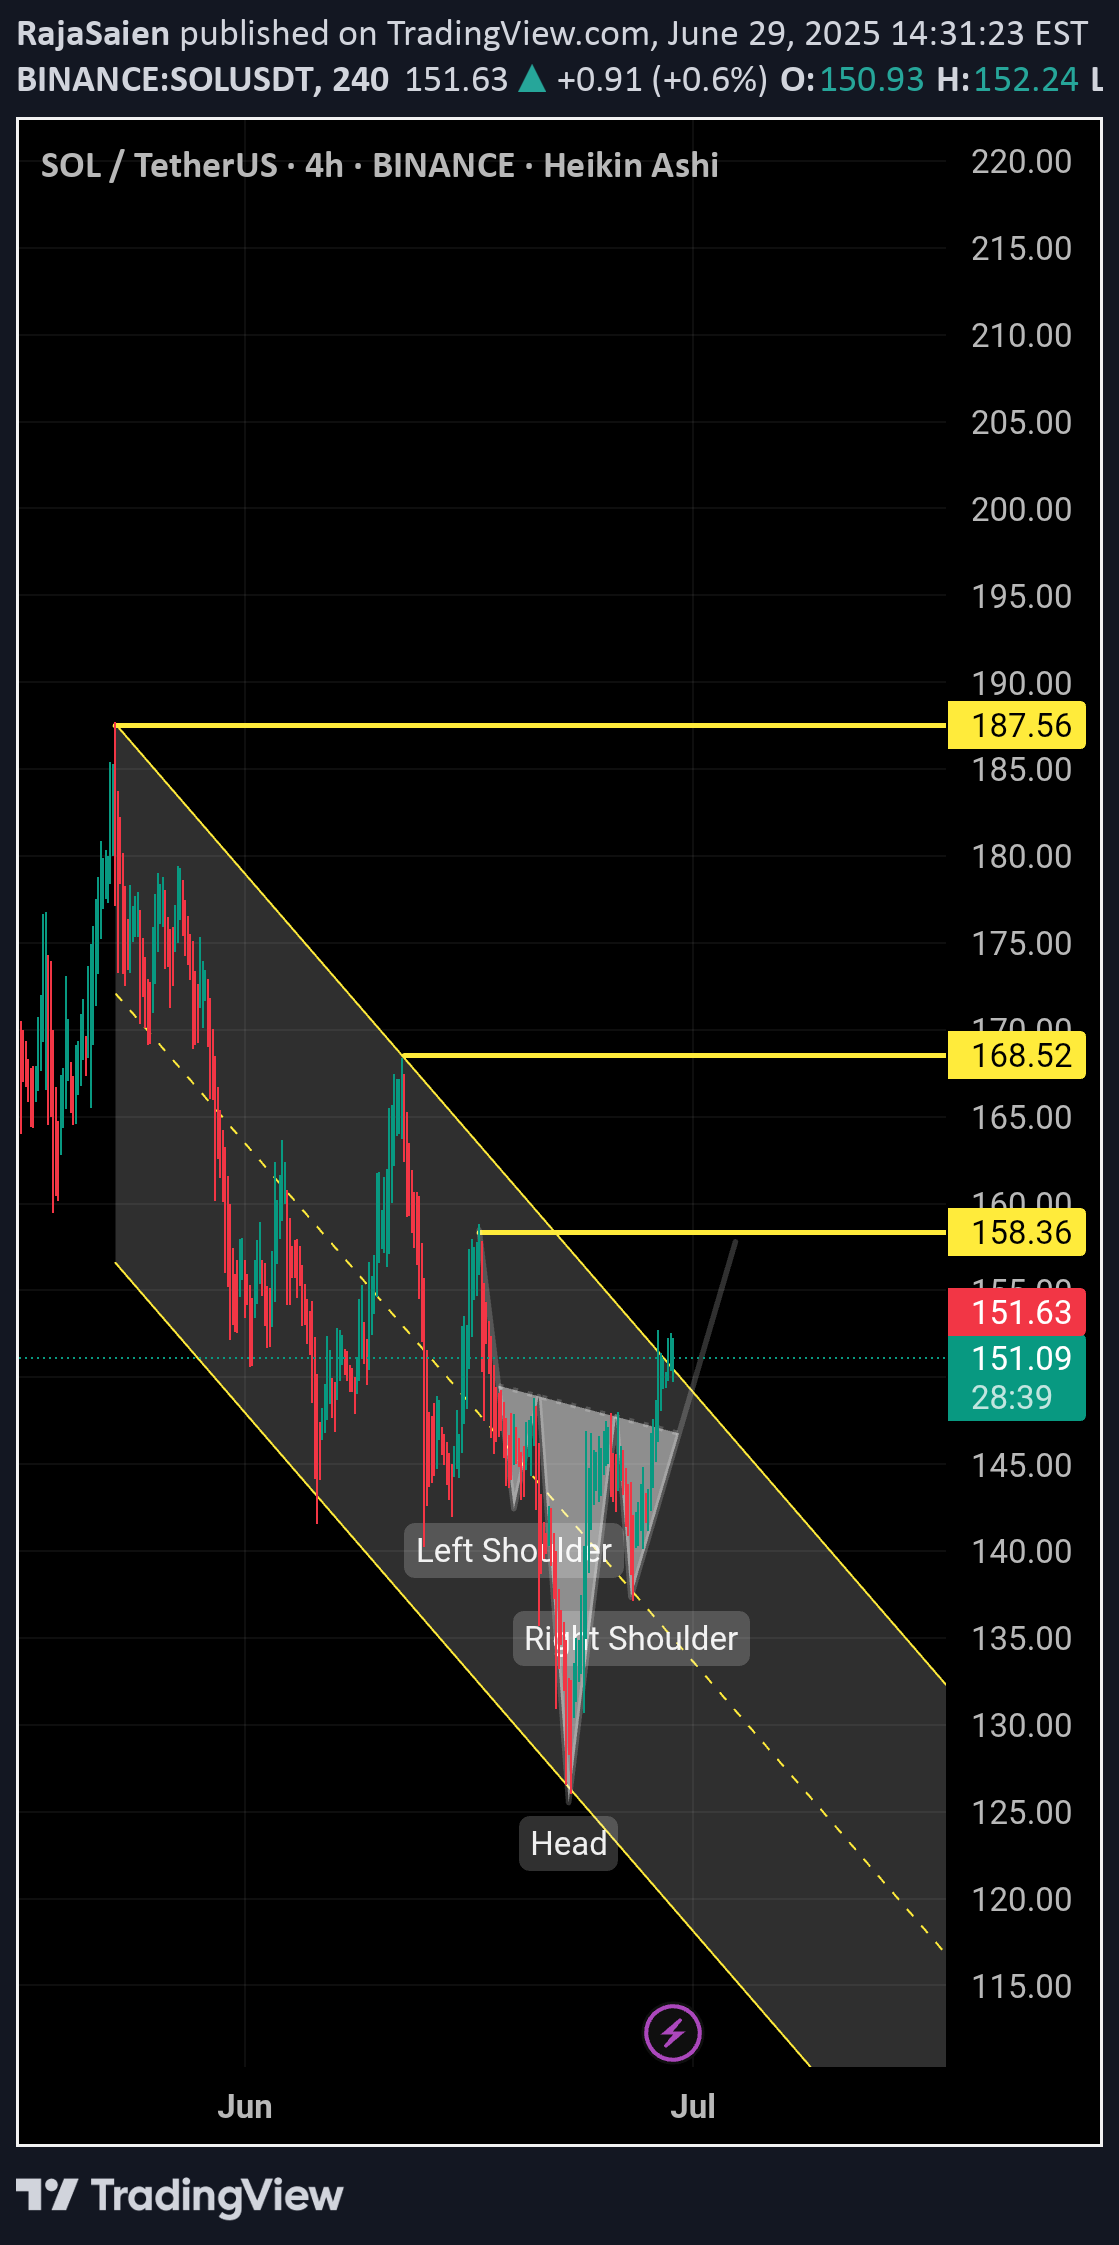
🧠 Technical Analysis (SOL/USDT – 4H Timeframe) 🔍 Pattern Identified: Inverse Head & Shoulders Left Shoulder: Around $137 Head: Dipped to ~$126 Right Shoulder: Formed around $135 Neckline Breakout: Successfully broken near $148–$150 zone This classic bullish reversal pattern indicates a potential trend shift from bearish to bullish. 📈 Trend & Channel The price was previously trading inside a descending parallel channel (marked in yellow). The breakout from the upper channel boundary confirms strength and momentum shift. 🚀 Price Targets (Resistance Levels Ahead): $158.36 – First resistance level (short-term target) $168.52 – Mid-level resistance (medium-term) $187.56 – Key resistance (long-term target area) ✅ Bullish Confirmation: Breakout with volume from both descending channel and head & shoulders neckline Price holding above neckline now acting as support ⚠️ Risk Note: A retest of the breakout zone ($148–$150) can occur before moving higher Invalid if SOL drops back below neckline and fails to hold above $145 support zone
RajaSaien
MEME/USDT Analysis — Symmetrical Triangle Breakout + Golden Cros

MEME/USDT Analysis — Symmetrical Triangle Breakout + Golden Cross! 🚀Timeframe: 4HExchange: Binance (Perpetual Contract)Chart Type: Heikin Ashi📊 Technical Analysis:A Symmetrical Triangle formation is visible, suggesting a potential strong breakout.Golden Cross observed: EMA 50 (yellow) is crossing above EMA 200 (red), a strong bullish signal.Price currently consolidating near the triangle apex — a breakout is expected soon.⚡ Trading Plan:📌 Bullish Scenario:✅ Entry: Above 0.002200 (candle close confirmation)🎯 Targets: 0.002400 — 0.002600🛡️ Stop Loss: 0.002041 (below 50% Fibonacci level)📌 Bearish Scenario:✅ Entry: Below 0.002041 (candle close confirmation)🎯 Targets: 0.001887 — 0.001675🛡️ Stop Loss: 0.002166 (previous consolidation zone)📰 Fundamental Catalysts:Market Sentiment: Meme coins seeing increased social media attention (Reddit, Twitter).Binance Update: Funding rate adjustments may trigger volatility.Hype Cycle: Growing interest towards MEME tokens as April ends.📢 Summary:MEME/USDT is at a critical breakout point with Golden Cross support. Watch for volume confirmation and manage risk properly.Risk Management is Key! ⚠️#Crypto #MEME #TradingView #Altcoins #TechnicalAnalysisNot a financial advise #DYOR
RajaSaien
Bitcoin Analysis – Inverse Head & Shoulders Breakout

📊 Bitcoin Analysis – Inverse Head & Shoulders Breakout 🚀BTC/USD (1H, Binance) is showing a textbook Inverse Head & Shoulders pattern, signaling a potential bullish breakout! 🎯🔹 Left Shoulder: Around $78,000🔹 Head: Around $74,000🔹 Right Shoulder: Around $78,000🔹 Neckline Breakout: $84,000 (Confirmed ✅)If BTC holds above this neckline, we could see a strong push toward $92,000+ in the coming sessions! 📈🔥 Trade Idea: Long positions above $84,000 with SL below $82,000 and TP near $92,000.📢 DYOR – This is not financial advice! Always manage risk properly. ✅
RajaSaien

Key Points:Current Situation: According to the chart, the price is in Wave 4, which is a corrective phase. If it holds the support zone (white box), Wave 5 may start.Support Level: The price is currently testing a key support level. Holding this level could push the price upward.Target: The next strong resistance is expected between 0.8451 – 0.8877, aligning with Fibonacci retracement levels.Risk: If the price breaks below the support level, it could drop further, invalidating Wave 5.Conclusion:If support holds, a bullish Wave 5 move is expected, aiming for higher resistance levels. However, if support breaks, a further decline is possible.
Disclaimer
Any content and materials included in Sahmeto's website and official communication channels are a compilation of personal opinions and analyses and are not binding. They do not constitute any recommendation for buying, selling, entering or exiting the stock market and cryptocurrency market. Also, all news and analyses included in the website and channels are merely republished information from official and unofficial domestic and foreign sources, and it is obvious that users of the said content are responsible for following up and ensuring the authenticity and accuracy of the materials. Therefore, while disclaiming responsibility, it is declared that the responsibility for any decision-making, action, and potential profit and loss in the capital market and cryptocurrency market lies with the trader.