Technical analysis by RajaSaien about Symbol SSV: Buy recommendation (9/3/2025)

RajaSaien
Technical Analysis (SSV/USDT – 4H)
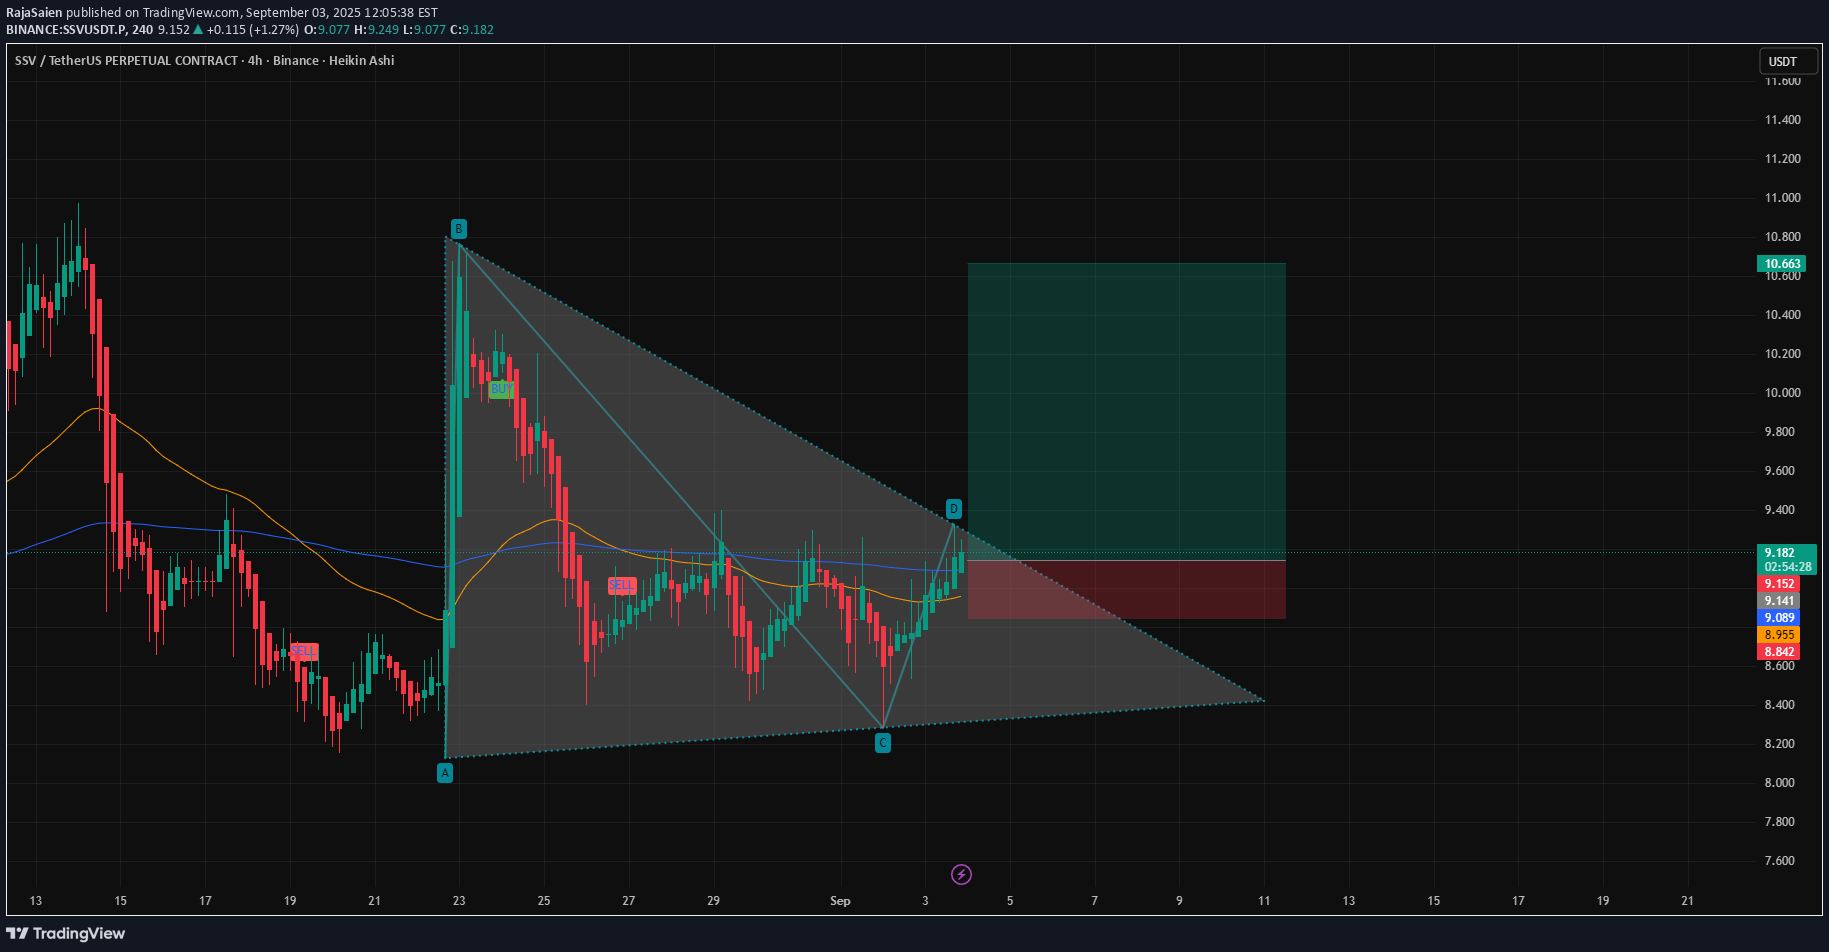
1. Pattern The chart is showing a descending triangle / falling wedge structure (A–B–C–D). Price has moved up strongly from point C → D, now testing the upper trendline resistance. If breakout happens above 9.20–9.30, bullish momentum can accelerate. 2. Key Levels Immediate Resistance: 9.20 – 9.30 (trendline + supply zone). Next Targets: TP1 → 9.60 TP2 → 10.20 TP3 → 11.00 (extended breakout target). Support Levels: 9.00 (short-term EMA + round number). 8.95 (200 EMA). 8.60 (lower wedge support). 3. Indicators EMA Structure: Price is trading just above 50 EMA (orange) and 200 EMA (blue) → early bullish signal. If 50 EMA crosses 200 EMA, trend confirmation will strengthen. Momentum: Recent bullish candles show strength; watch for volume confirmation. 4. Scenarios Bullish (High Probability): Break and close above 9.30 → opens the way to 9.60 → 10.20 → 11.00. Bearish (Low Probability): If rejection occurs, price may retest 9.00 → 8.95 support, possibly even 8.60. 📌 Trading Plan Entry (Aggressive): Current zone (9.15–9.20), anticipating breakout. Entry (Conservative): Wait for 4H candle close above 9.30. Stop Loss: Below 8.85 (safe zone under support). Targets: 🎯 TP1: 9.60 🎯 TP2: 10.20 🎯 TP3: 11.00 ✅ Summary: SSV/USDT is at a decisive point near resistance. A breakout above 9.30 will likely confirm a bullish move toward 10+. Until then, caution advised with a stop below 8.85 to manage risk.