Technical analysis by RajaSaien about Symbol MANA: Buy recommendation (9/3/2025)

RajaSaien
Technical Analysis Of Manausdt 4H
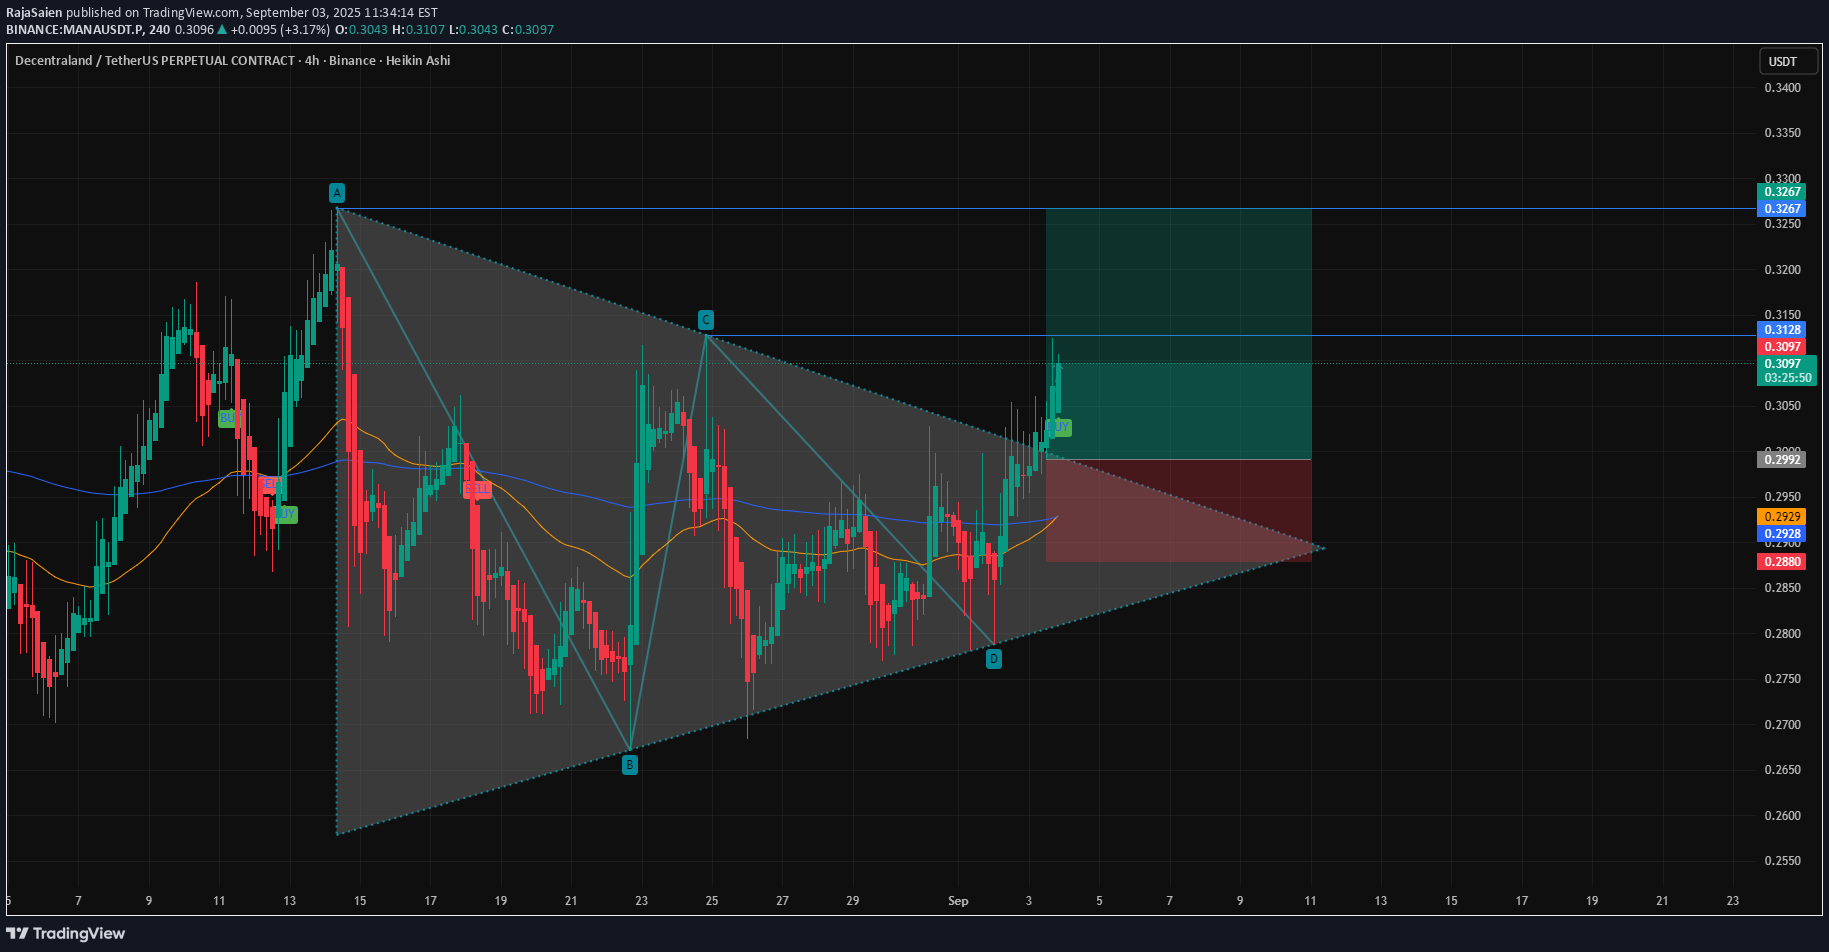
🔎 Technical Analysis 1. Chart Pattern Price has been trading inside a symmetrical triangle (A–B–C–D formation). Recently, it broke out to the upside, signaling a possible bullish continuation. Breakout candles are supported by green Heikin Ashi momentum, confirming buying pressure. 2. Key Levels Immediate Support: 0.2950 – 0.2920 (200 EMA + triangle base support). Current Price Zone: 0.3090 – 0.3100 (post-breakout). Resistance Levels: 0.3128 → First hurdle (just tested). 0.3267 → Next upside target. 0.3400+ → Extended bullish target if momentum continues. 3. Indicators EMA Trend: 50 EMA (yellow) crossing above 200 EMA (blue) → Golden Cross setup, bullish bias. Volume (not shown but inferred): Breakouts from triangles usually need volume; if confirmed, breakout has strength. 4. Potential Scenarios Bullish Case (High Probability): Price sustains above 0.3128, pushes toward 0.3267, and possibly 0.3400. Bearish Case (Low Probability): If price fails to hold 0.3000–0.2950, it could fall back into the triangle and retest 0.2920. 5. Trading Plan Entry (Aggressive): Current levels (0.3090–0.3100) on pullbacks. Entry (Conservative): Wait for 4H candle close above 0.3128. Stop Loss: Below 0.2950 (triangle support + 200 EMA). Targets: TP1 → 0.3128 TP2 → 0.3267 TP3 → 0.3400 ✅ Summary: MANA/USDT has broken out of a symmetrical triangle on the 4H chart with bullish EMA structure. As long as price stays above 0.2950, bias remains bullish with targets at 0.3128 → 0.3267 → 0.3400. Failure to hold above 0.2950 would invalidate the breakout.