
NextElliott
@t_NextElliott

What symbols does the trader recommend buying?
Purchase History
پیام های تریدر
Filter
Signal Type
NextElliott
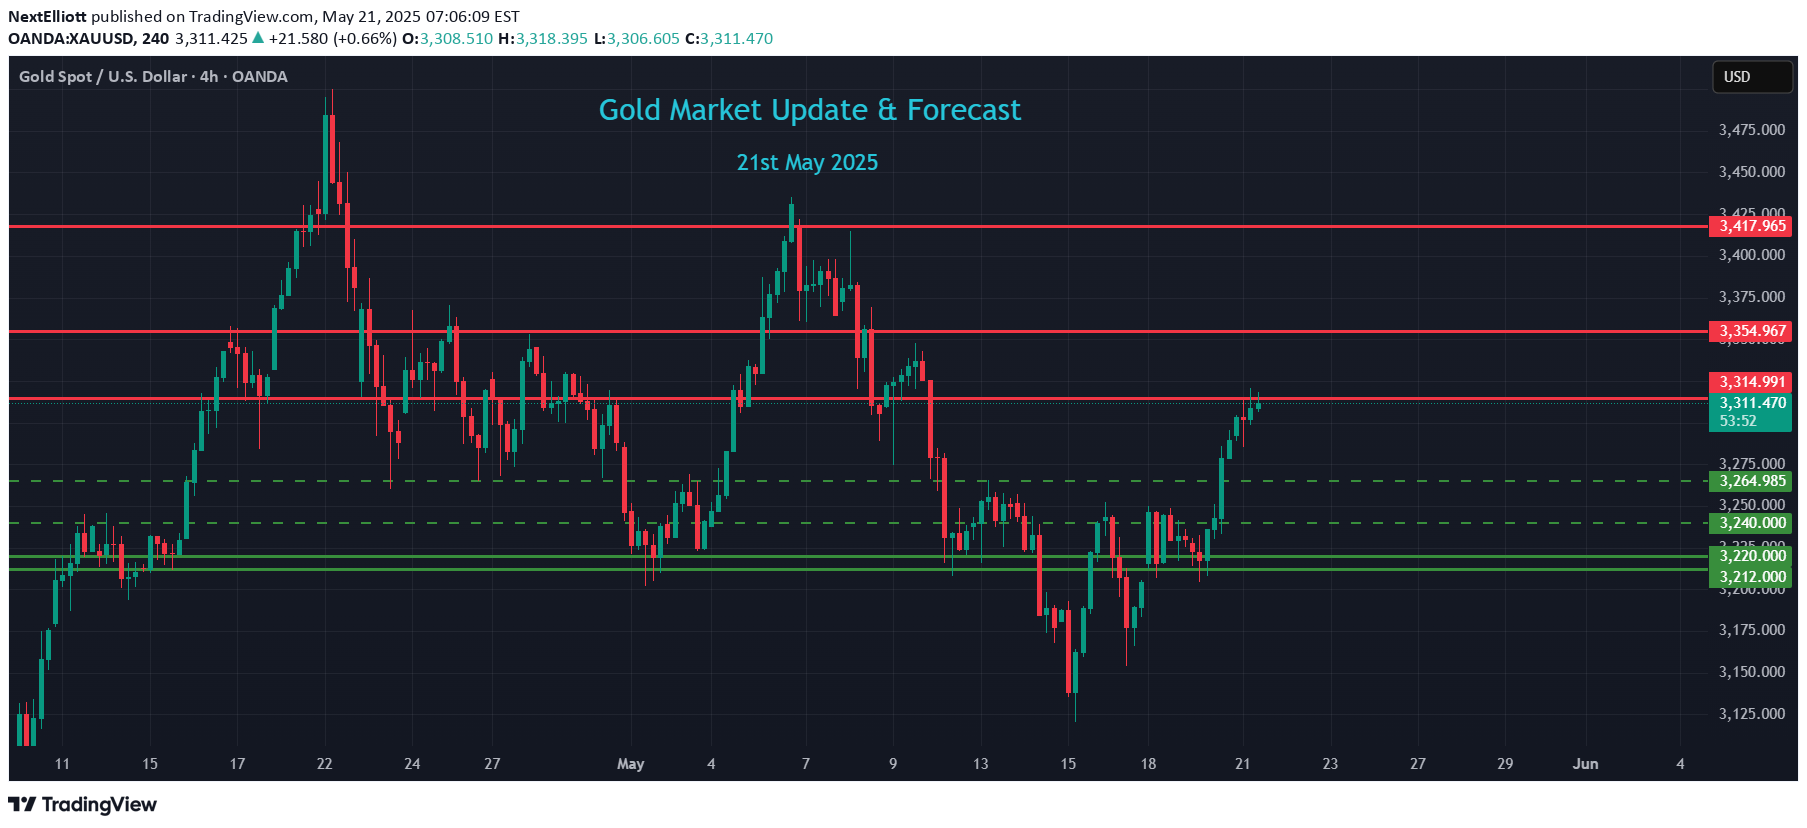
📉 XAUUSD Market Outlook – Potential Pullback AheadDate: May 21, 2025Analyst: NextElliottInstrument: XAUUSD (Gold)Current Price: $3,307Outlook: Short-Term Bearish BiasTrade Horizon: 1–4 DaysTimeframes Observed: 4H / Daily🔍 Market OverviewGold (XAUUSD) recently extended its rally, reaching a high near $3,310 after a strong bullish leg that began earlier this month. However, current price action indicates signs of momentum exhaustion near this region—aligning with a confluence of technical resistance levels and psychological barriers.As Gold consolidates below recent highs, we anticipate a corrective pullback toward the $3,240 area, offering potential for short-term bearish trades or long-term re-entry opportunities.📐 Key Technical Levels🔻 Resistance Zone (Recently Tested)$3,305 – $3,320:Fib extension from prior swingPrevious intraday rejection levelsOverbought RSI on 4H🔻 Expected Support / Target Zone$3,240 – $3,220:Previous breakout zone38.2%–50% Fibonacci retracement of latest rally20EMA & volume shelf on 4H🔄 Trend & Structure AnalysisGold remains in a bullish macro structure, but current price is extended short-term.Price appears to be forming a corrective Wave 4 or descending channel, likely targeting $3,240–$3,220 before another leg up.A confirmed break below $3,290 could act as a trigger for downside momentum.📊 Momentum & VolumeRSI Divergence observed on 4H and Daily, signaling weakening buying pressure.Volume tapering on recent highs suggests distribution rather than accumulation.MACD histogram beginning to roll over on 4H—early signal of trend shift.🧭 Trade Scenario Outlook🔴 Bearish Scenario (Active Bias)Trigger: Break and 1H/4H close below $3,290Target Zones:TP1: $3,260TP2: $3,240TP3: $3,220Stop Loss (Short Entries): Above $3,320Invalidation: 4H close above $3,330 (would suggest continuation)🛠️ Strategic Notes & Risk ManagementIdeal for short-term traders looking to capitalize on retracement before trend resumes.Long-term bulls may monitor $3,240–$3,220 for potential re-entry after consolidation.Use volatility-adjusted stop losses and consider scaling out partial profits on approach to support levels.📌 ConclusionWith Gold trading near its short-term peak at $3,307, a pullback toward $3,240 is becoming increasingly probable as overextended conditions begin to unwind. This retracement is expected to be corrective, not reversal-based, within the broader uptrend. Traders should watch for bearish confirmations below $3,290 and act accordingly, while positioning for renewed bullish opportunities near major support.
NextElliott
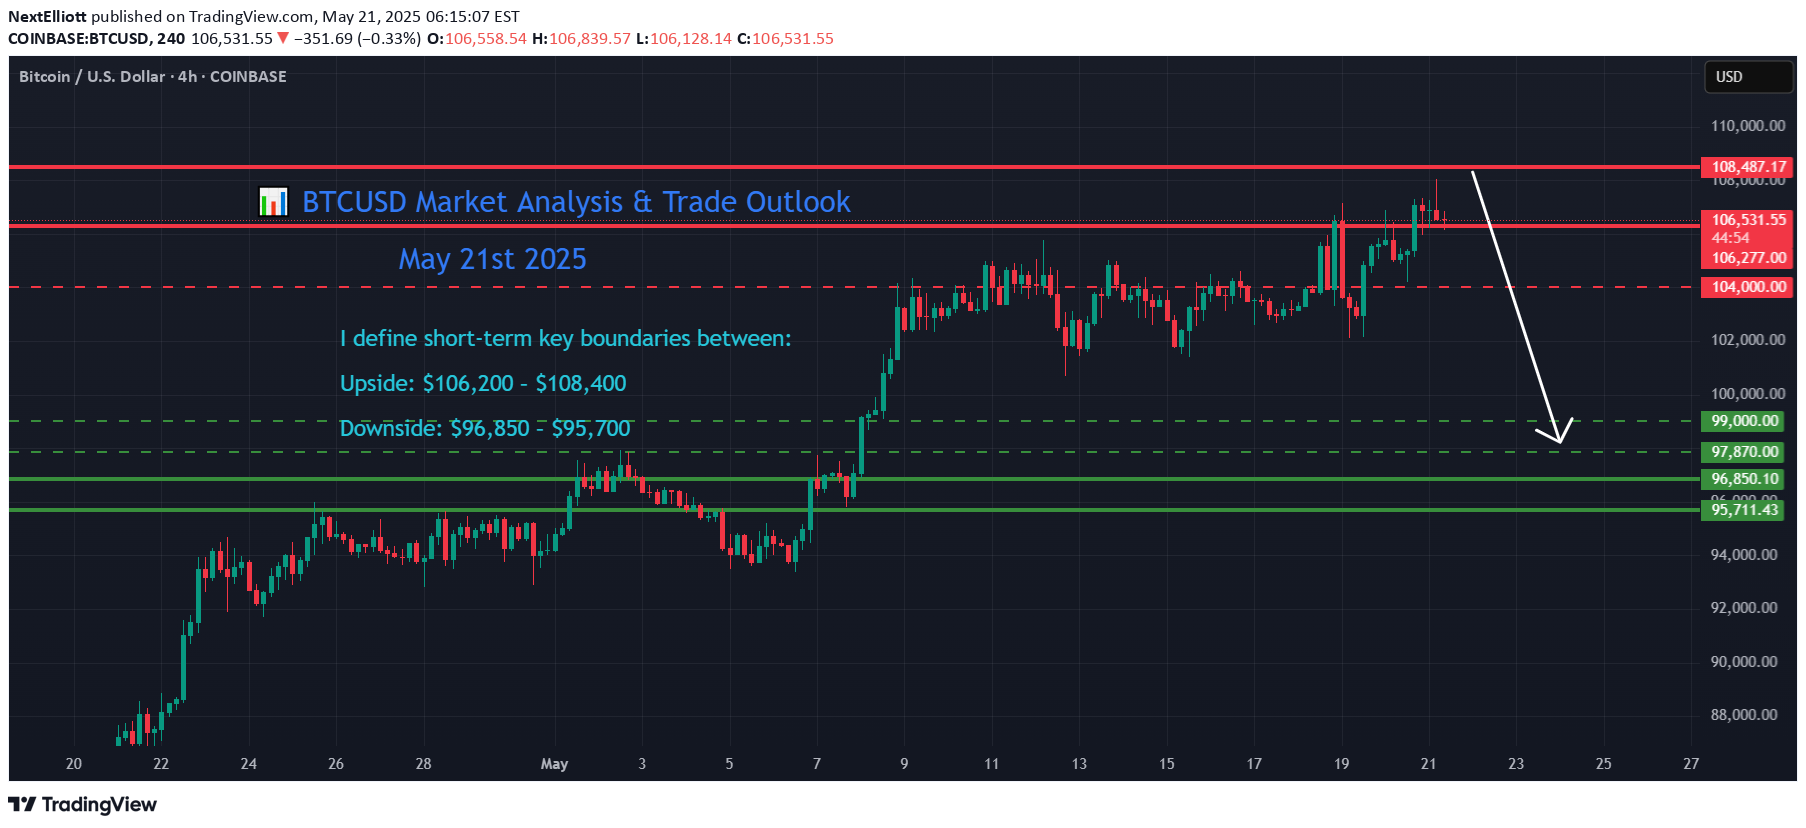
# 📉 **BTCUSD Market Update & Forecast ( 21st May 2025 )****Date:** May 21, 2025**Analyst:** NextElliott**Instrument:** BTCUSD**Current Price:** \$106,376**Strategy Type:** Elliott Wave, Gann Confluence, Probabilistic Reversal**Trade Horizon:** 2–7 Days**Timeframes Observed:** 4H / Daily---## 🔍 **Market Context & Price Behavior**BTCUSD has successfully reached my **upper resistance target zone of \$106,200–\$108,400**, topping out near \$106,400. This zone was previously identified as a **potential exhaustion area**—a Fibonacci cluster and Gann resistance confluence, marking the final stage of a **Wave (3) advance**.https://www.tradingview.com/chart/BTCUSD/H5ATTh4r-BTCUSD-Market-Analysis-Trade-Outlook-May-9th-2025/Price is now reacting to this resistance, and early signs of distribution or momentum loss are appearing in the 4H structure. This suggests a high-probability setup for a **corrective pullback** before any potential continuation of the larger trend.---## 📐 **Technical Breakdown**### 🔻 Resistance Confluence Zone (Hit)* **\$106,200–\$108,400** * 1.618 extension from prior impulse * Gann 120°–135° resistance arcs * Measured wave projection from \$94,500 low### 🔻 Immediate Support Zones (Pullback Targets)* **TP1:** \$97,870 – High-volume node + sub-wave 4 base* **TP2:** \$96,850 – Structure base and Gann 45° angle* **TP3:** \$95,700 – Final fib/gap support### 🔄 Elliott Wave Interpretation* Current price action likely marks the top of **sub-wave 5 of Wave (3)**.* A corrective **Wave (4)** is anticipated next, typically retracing to the prior Wave 4 of lesser degree: * **Target range:** \$99,000 → \$97,870 → \$96,850* Once this retracement completes, a final **Wave (5)** toward new highs may initiate—**provided** structural support holds above \$95,700.---## 🧭 **Gann Angle Analysis*** The recent high aligns with the 120° arc from the March low—commonly a **cycle reversal marker**.* Gann support lies near: * **\$97,870** → 45° harmonic * **\$96,850–\$95,700** → 60°–75° clusterTimewise, BTC is exiting the minor **May 10–11 Gann window**, entering a possible correction window lasting until **May 24–26**.---## 🎯 **Trade Scenario Outlook**### 🔴 **Bearish Retracement Scenario (Active)*** **Trigger:** Reaction failure below \$106,200 confirms reversal* **Targets:** * TP1: **\$97,870** * TP2: **\$96,850** * TP3: **\$95,700*** **Invalidation:** 4H close above \$108,400### 🛠️ Risk Management* Consider short entries on breakdowns below \$104,800 (support break)* Use stop-losses above \$107,000 (recent high)* Take partial profits near each retracement target* Monitor RSI/Volume divergence for early reversal signs near \$97,870---## 🧠 **Strategic Commentary**BTCUSD has met all pre-defined bullish objectives, aligning with the end of a 5-wave advance. The next **logical market move** is a correction to refresh bullish momentum and reset trader positioning. Expect volatility and potential range-based behavior before the next impulsive rally.This zone offers **ideal conditions for tactical shorts or long re-entries** upon support confirmation.---## 📌 **Conclusion**BTCUSD has tagged its upper resistance zone and now shows signs of topping within a mature wave structure. The anticipated pullback toward **\$97,870** is part of a healthy macro trend and should be monitored for possible long-term re-entry opportunities.Traders should shift focus to downside targets, apply disciplined risk management, and stay adaptive to emerging price signals.
NextElliott
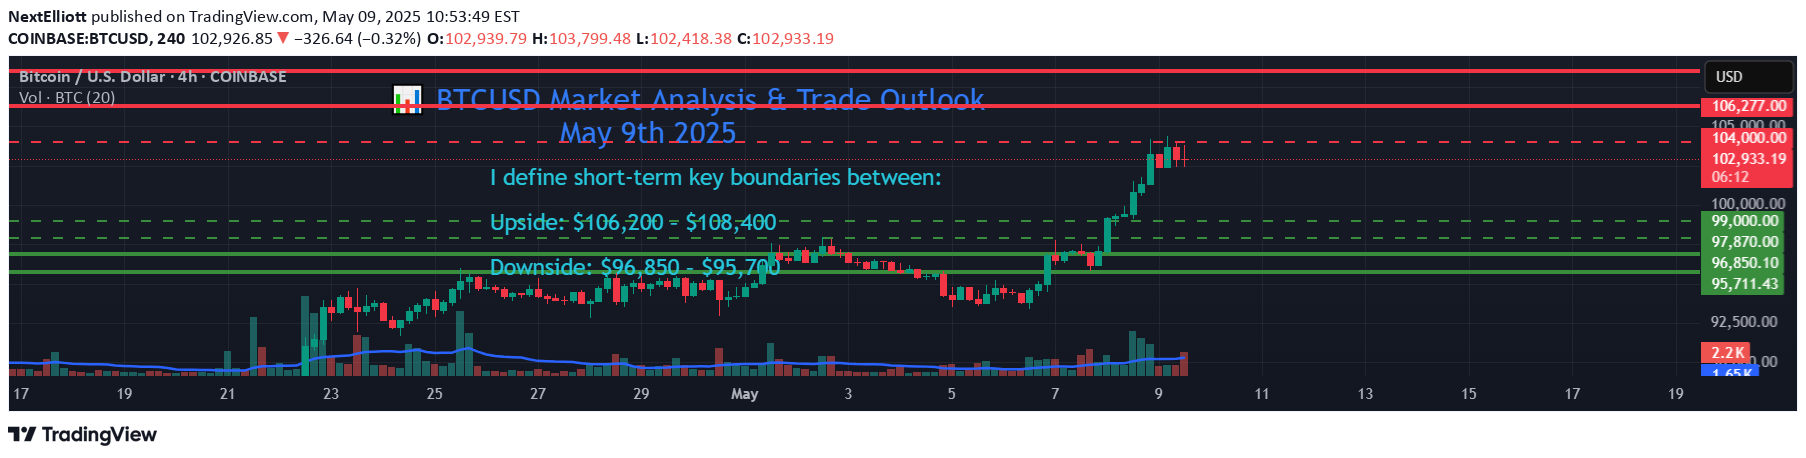
📊 BTCUSD Market Analysis & Trade Outlook (Post $103,500 Target)Instrument: BTCUSDStrategy Type: Probabilistic Breakout with Elliott & Gann ConfluenceCurrent Price: $102,600Trade Horizon: 2–5 DaysTimeframes Observed: 4H / Daily🔍 Market OverviewBTCUSD has successfully completed the prior trend continuation target of $103,500, respecting the bullish structure on 4H and Daily timeframes. As of now, price is consolidating just below key resistance, printing a high of $103,800 and retracing slightly to $102,600. This signals a potential decision zone where BTC may either continue its advance or initiate a deeper pullback.I define short-term key boundaries between:Upside: $106,200 – $108,400Downside: $96,850 – $95,700📐 Technical Structure & Key ZonesSupport Zone: $ 97870 , $96,850–$95,700 (Previous consolidation + high volume node)Resistance Zone: $106,200–$108,400 (Measured move & fib cluster area)Structure Bias: Bullish above $99,000; bearish pressure increases below $96,850🔄 Elliott Wave Count (Short-Term, 4H)BTC appears to be in a Wave (3) of a higher-degree Wave 3, following a Wave (2) retracement toward $94,500.Current price movement is within a sub-wave 3 of (3), with the recent high at $103,800 potentially marking a sub-wave 3 top.A brief corrective Wave 4 could develop toward $100,500–$99,000, before a final Wave 5 drives price into the $106,200–$108,400 zone.If price fails to hold above $96,850, the structure may morph into a larger corrective Wave (4), targeting the lower boundary.📊 Gann AnalysisThe Gann 1/1 angle from the March swing low is currently intersecting near $102,500–$103,000, offering resistance.Next key Gann levels:Above: $106,200 (120°) and $108,400 (135°) resistance arcsBelow: $96,850 and $95,700 align with 45° and 60° support anglesTimewise, entering a minor Gann cycle window on May 10–11, often associated with inflection points. Watch for breakout or reversal signals near this period.🎯 Trade Scenario Outlook🟢 Bullish Scenario (Breakout)Trigger: 4H close above $104,000Target Zones:TP1: $106,200TP2: $108,400Invalidation: 4H close below $99,000 (consider tightening SL)🔴 Bearish Scenario (Pullback)Trigger: Break below $99,000, especially on strong volumeTarget Zones:TP1: $97870 or $96,850TP2: $95,700Invalidation: Close above $104,000 invalidates pullback thesis⚙️ Strategic Trade NotesScalping & Swinging Options:Consider range scalps within $102,000–$99,000, but prepare for trend breakout.Swing traders may build positions on retracement (Wave 4) with invalidation below $97870, $96,850.Risk Management:Use volatility-adjusted stop losses under key Gann levels or 50EMA on 4H.Consider tightening stops or taking partials near $106,200 to protect gains if price extends.📌 ConclusionBTCUSD remains in a bullish macro structure but approaches a key inflection zone. A break and hold above $104,000 could launch the next impulsive leg toward $108,400. Conversely, failure to hold above $99,000 opens the door for a deeper retracement to $ 97870, $96,850–$95,700. Traders should remain flexible, aligning with the prevailing momentum while respecting structural boundaries.Bullish Scenario (Breakout)Trigger: 4H close above $104,000Target Zones:TP1: $106,200TP2: $108,400Invalidation: 4H close below $99,000 (consider tightening SL)Finally 106000 Hit... Target achieved
NextElliott

📈 BTCUSD Chart Analysis & Trade PlanInstrument: BTCUSDTrade Setup: LongEntry Price: $96,900Take Profit (TP): $103,500Stop Loss (SL): $93,830Risk-Reward Ratio (RRR): 2.15Timeframe Observed: 4H / DailyTime Horizon: 2–4 daysStrategy Type: Trend Continuation🔍 Technical OverviewTrend: BTCUSD is exhibiting a bullish continuation pattern, forming higher lows and higher highs on both 4H and Daily charts.Support Levels:Primary: $96,500–$96,900 (current entry zone, previous breakout retest zone)Secondary: $94,800 (key horizontal + Fibonacci retracement support)Resistance Levels:Short-term: $100,800Medium-term: $103,500 (aligned with Gann and Elliott targets)🌀 Elliott Wave AnalysisPrimary Wave Count (4H chart):BTCUSD appears to be in Wave 3 of (3) of a bullish impulse cycle.Wave (2) retracement completed near $96,000 with a sharp ABC correction.Wave (3) projection gives a Fibonacci extension target:100% of Wave 1 = ~$103,500 — aligning with our TP zone.Subwaves inside Wave 3:Wave i and ii completed.Currently progressing through Wave iii — often the strongest, highest momentum wave.Implication: If Wave iii holds, BTCUSD could accelerate toward $103,500 within the next 48–72 hours.📐 W.D. Gann AnalysisGann Fan (drawn from $60,000 low):Price has reclaimed the 1x1 line (balance of time and price) around $96,000.Next resistance lies near the 1x2 Gann angle at ~$103,300–$103,500.Gann Square of 9 levels:$96,800 is a key Gann pivot price.The next natural harmonic level on the Square of 9 lies at $103,500, affirming this zone as a major Gann target.Implication: Gann time/price analysis supports a rally to $103,500 before the next cycle pause.📝 Trade Plan SummaryParameterValueEntry$96,900Take Profit$103,500Stop Loss$93,830RRR2.15Timeframe2–4 DaysJustification:Entry aligns with Elliott Wave corrective low (Wave 2).Gann angle breakout confirms time/price balance in favor of bulls.Confluence of Fibonacci projections, harmonic levels, and structural support.⚠️ Risk NotesIf BTCUSD fails to hold above the $96,500–$96,000 zone, reevaluation is needed.Global macro factors and ETF flows should be monitored, as they could cause volatility.Adjust your Stop loss if you want or if market demand... Happy Trading!Just try your best to survive from Stop Hunt...📌 Note on Dynamic Market ConditionsDear Traders,As many of you are aware, the cryptocurrency market — particularly BTCUSD — is inherently dynamic and ever-evolving. Price action is influenced by a wide range of factors, including liquidity shifts, macroeconomic data, order book behavior, institutional flows, and evolving sentiment. Therefore, it's essential to understand that no analysis or trade plan is set in stone.While I provide a well-reasoned trade setup with clearly defined entries, stop loss, and take profit levels based on current market structure, these parameters are not static. Instead, they are subject to refinement in response to real-time developments.🔄 Why Adjustments Happen:Volatility Expansion: Increased volatility may warrant a wider stop loss or an extended profit target.Structure Shifts: If market structure (e.g., support/resistance or trendline integrity) changes, I recalibrate key levels accordingly.News Events: Unexpected macroeconomic or geopolitical events can invalidate a previous outlook.Confirmation Logic: Sometimes I wait for candlestick confirmations or trend continuations to adjust SL/TP zones for better probability setups.🛠️ Adaptive Risk ManagementAdjusting stop loss and take profit is not a sign of weakness or inconsistency — it's a sign of strategic adaptability. Preserving capital and capturing optimal reward-to-risk scenarios requires an active approach. I always prioritize:Minimizing drawdownMaximizing favorable risk-reward opportunitiesResponding in sync with current momentum and market psychologyRest assured, every modification I make is grounded in objective market behavior, not emotional reaction. All updates are transparently communicated to help you understand the evolving rationale.Stay flexible. Stay informed. Stay profitable.— NextElliottExpecting price reversal for Btc soon.. After few hours. Present price 93800Target 103500 achieved ...
NextElliott
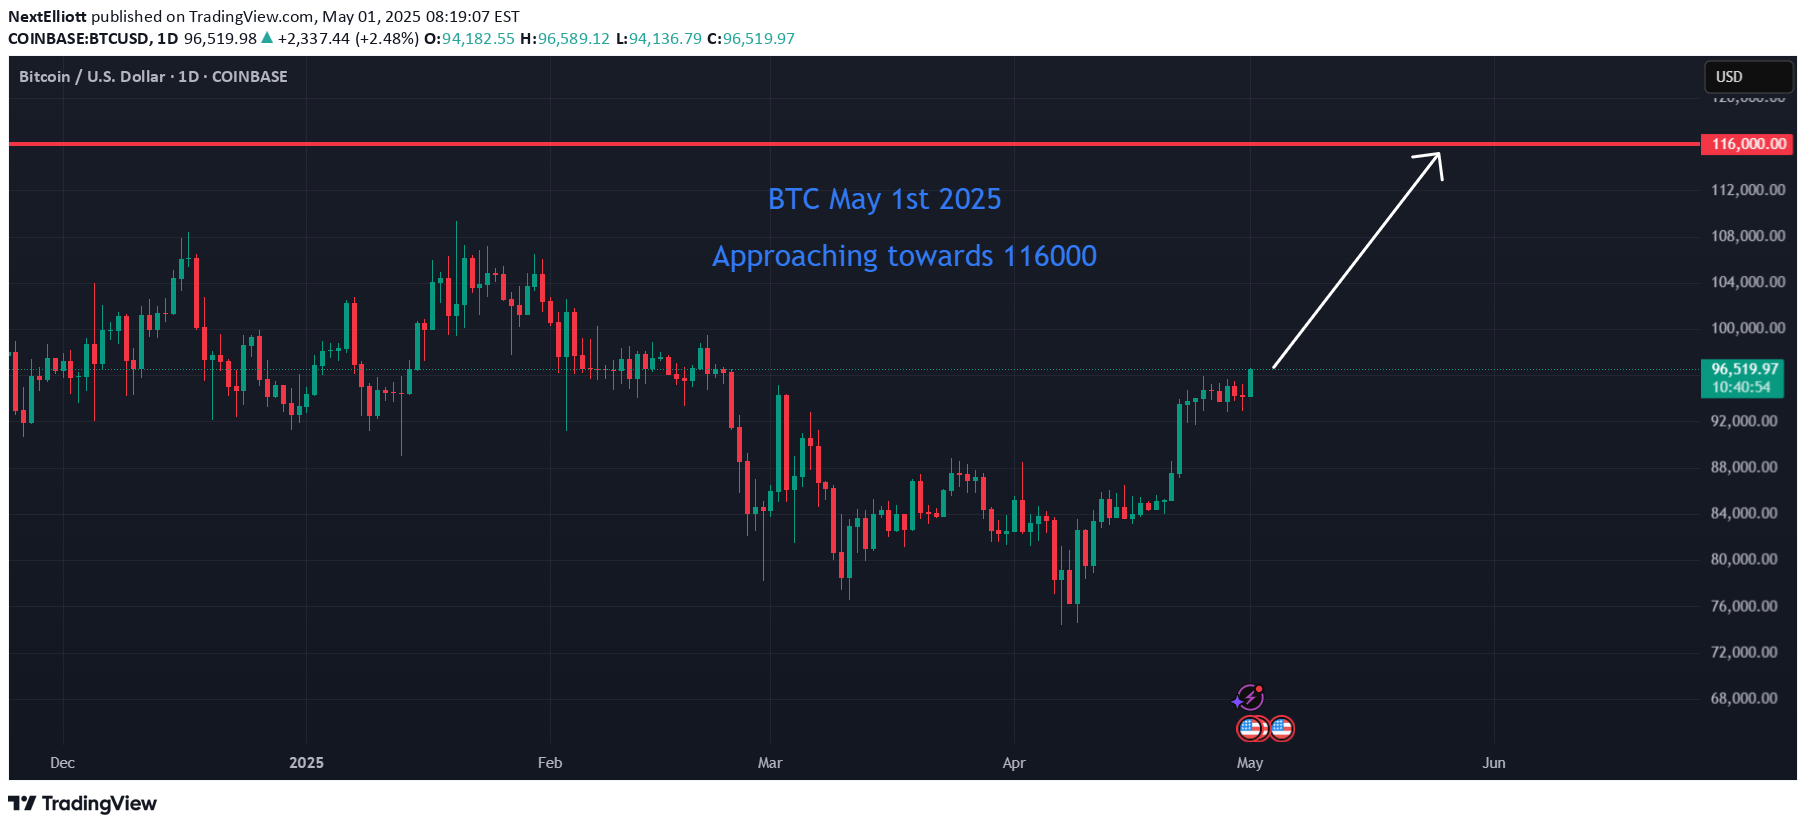
Bitcoin (BTC) is currently trading at approximately $96,390, approaching the $116,000 mark. Here's a short-term analysis using Cycle Analysis, Elliott Wave Theory, and Gann Analysis to inform potential trading strategies. ________________________________________ 📈 Cycle Analysis: Mid-2025 Surge Historical patterns suggest that Bitcoin tends to reach its peak between 518 and 546 days after a halving event. Given the most recent halving in April 2024, analysts anticipate a potential price peak around mid-2025, approximately 1.5 years post-halving. Notably, Bitcoin is currently about 35 days ahead of its typical cycle, indicating a possible acceleration in price growth. ________________________________________ 📊 Elliott Wave Analysis: Wave 3 in Progress Elliott Wave Theory suggests that Bitcoin is currently in the third wave of its bullish cycle, which is typically the most powerful and extended wave. Recent analyses indicate that the third wave is unfolding, with potential targets ranging from $114,500 to $120,500. A conservative estimate places the peak of this wave between $127,000 and $150,000 ________________________________________ 📐 Gann Analysis: Price-Time Equilibrium Gann Analysis utilizes geometric angles to predict price movements. The "2×1 Fan" line, representing a 45-degree angle, is considered a fair value line. Historically, Bitcoin's price has peaked near this line during parabolic run-ups. Currently, Bitcoin's price is approaching this level, suggesting a potential peak. ________________________________________ 🧭 Short-Term Trade Setup ✅ Entry Points: •Accumulation Zone: $85,000 to $90,000 •Current Price: $96,390 🎯 Target Levels: •Short-Term Peak: $116,000 to $135,000 •Medium-Term Peak: $150,000 ⚠️ Risk Management: •Potential Correction: After reaching the peak, anticipate a significant pullback, possibly 30–50%. •Exit Strategy: Consider taking profits as Bitcoin approaches upper resistance zones. ________________________________________ 🧾 Conclusion Bitcoin is in the final stages of its current bullish cycle, with projections indicating a potential peak between $150,000 and $278,000. However, caution is warranted as market corrections are typical following such surges. Investors should consider taking profits as Bitcoin approaches upper resistance levels and prepare for potential pullbacks.Expecting price reversal for Btc soon.. After few hours. Present price 93800Short term target 103500 achieved .Finally target 116,000 achieved !!
NextElliott
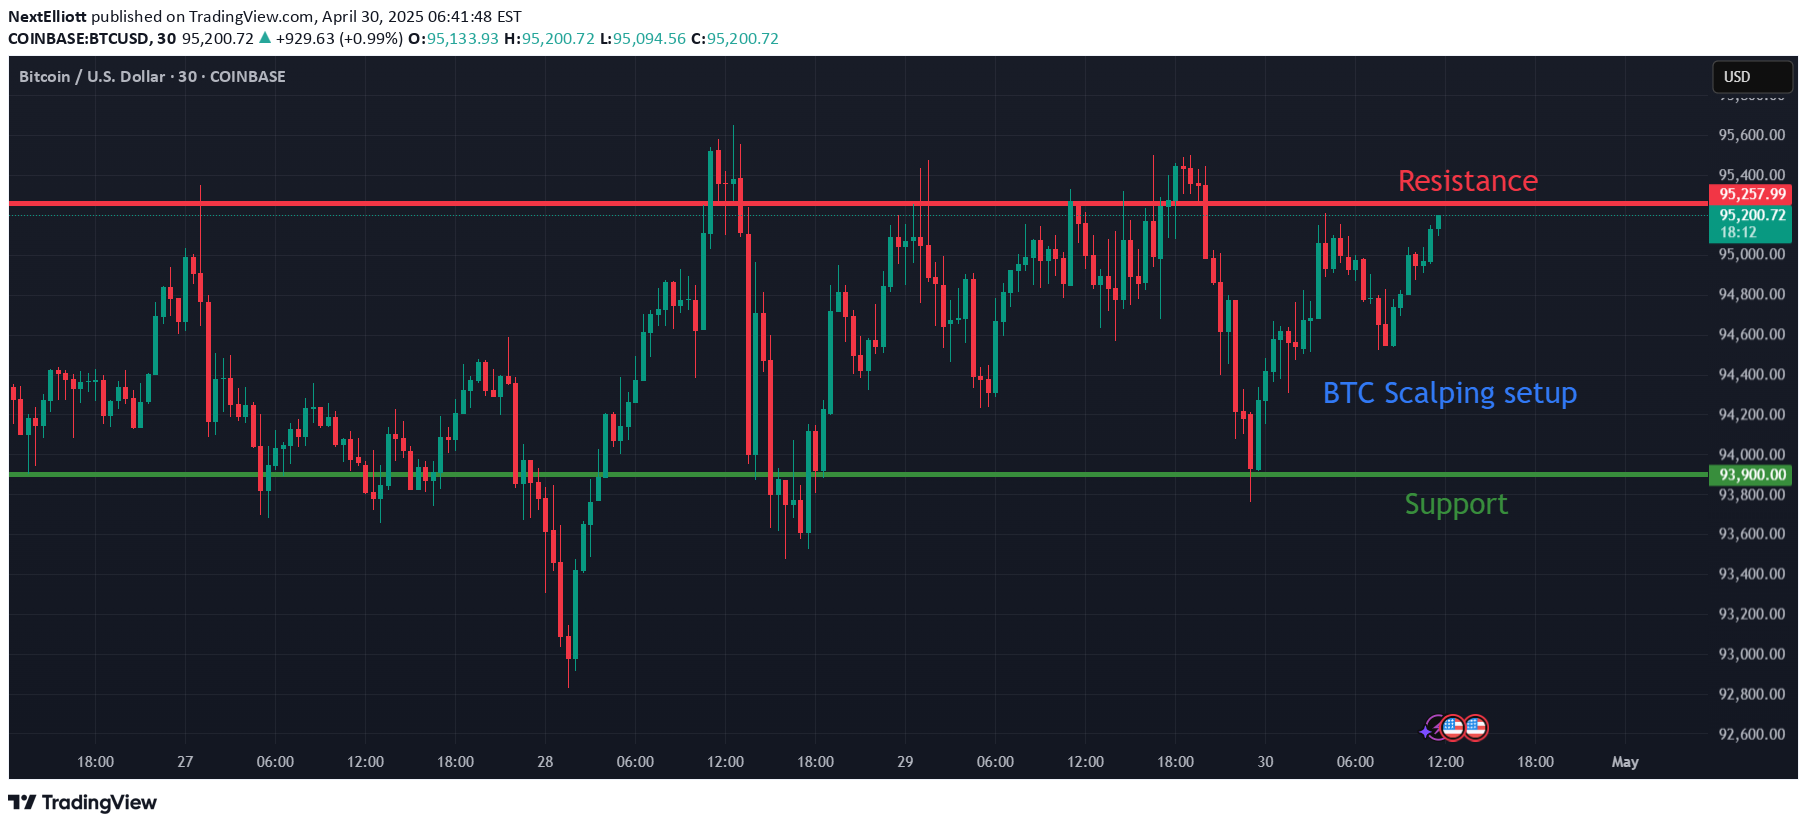
Bitcoin (BTC) Scalping Setup: Technical AnalysisKey Levels:Support: $93,900Resistance: $95,257Time Frame: Intraday Scalping (5-minute or 15-minute charts or 30-minute charts )Market Overview:Bitcoin (BTC) is currently consolidating in a relatively tight range between support at $93,900 and resistance at $95,257. This market structure is ideal for scalping, as the price tends to make short, quick moves between these levels, providing multiple opportunities for small, yet consistent, profits.Support Level ($93,900):Significance: This is a critical support zone that has held strong in recent price action. If the price continues to test this area and holds, it suggests that buyers are stepping in at this level, potentially looking for an upward reversal.Technical Indicators:RSI (Relative Strength Index): Watch for the RSI near or below 30 (indicating oversold conditions). A rebound off the support level combined with an RSI divergence would signal strong buying pressure.Volume: Volume spikes near this level could signal that demand is increasing as the price approaches support. A higher-than-average volume at support could confirm the potential for a bounce.Resistance Level ($95,257):Significance: Resistance at $95,257 has proven to be a tough barrier, with the price failing to break above this level in recent tests. Scalpers should be aware of short-term rejection at this point, as it may provide an opportunity to enter a short position.Technical Indicators:MACD: Look for a bearish MACD crossover near this resistance level. A MACD divergence can signal weakening bullish momentum, hinting at a potential reversal or consolidation.Candlestick Patterns: Candlestick formations such as Doji, Shooting Star, or Engulfing Patterns near this resistance would signal exhaustion in the uptrend and a higher probability of a pullback.Trade Setup:Scalping Long (Buy) Setup:Entry: Enter long near $93,900 support if the price holds and shows signs of a rebound (e.g., candlestick reversal patterns, RSI divergence).Stop Loss: Place the stop just below $93,500 to protect against a deeper breakdown.Target: Set an initial target at $94,800 (near the middle of the range) and a final target near $95,000, keeping a risk-to-reward ratio of at least 1:2.Scalping Short (Sell) Setup:Entry: Enter short near $95,257 resistance if the price fails to break higher and starts to show signs of rejection (e.g., a bearish candlestick formation or RSI divergence).Stop Loss: Place the stop slightly above $95,500 to account for any potential false breakouts.Target: Set the first target at $94,500 and the second at $93,900, aligning with support.Additional Insights:Volume Analysis: Scalpers should always monitor volume to confirm the strength of price moves. A break above resistance with declining volume would be a cautionary signal, as it suggests the move might be unsustainable.Intraday Sentiment: Keep an eye on broader market sentiment (especially in crypto-related news or macroeconomic events) as it can affect the short-term price action.Conclusion:This scalping setup offers multiple opportunities within a clear range. As the price fluctuates between $93,900 (support) and $95,257 (resistance), traders can use technical indicators to manage entry and exit points effectively. Tight stop-losses and quick, targeted gains are crucial for success in this type of strategy, as Bitcoin can be highly volatile in these intraday moves.Happy trading, and always manage risk effectively!Bitcoin's Meteoric Rise: A Precision Forecast Fulfilled! 🚀The markets have spoken, and as predicted, Bitcoin (BTC) has soared to meet the target of $93,900, validating the accuracy of my resistance and support zones. The analysis was spot on—both in terms of timing and price action—proving that technical analysis, when done right, can be an incredibly powerful tool.From carefully plotted support zones to the crucial resistance levels, every indicator pointed to this very moment. The precise targeting of $93,900 was a culmination of in-depth market observation, trend analysis, and a deep understanding of BTC’s price action. As Bitcoin surged to meet my forecast, it wasn’t just a triumph of numbers, but a celebration of strategy, experience, and patience.The path leading to this target wasn’t always linear, but every pivot, every retracement, and every candlestick pattern worked in perfect harmony to bring us to this remarkable milestone. For those who followed my analysis, this is a true testament to the art and science of predicting market movements.Here’s to accurate forecasting, profitable gains, and more targets ahead. 🔥 Let's keep the momentum going!
NextElliott

Gold Price Update & Buy Entry OpportunityThe price of gold couldn't sustain at the 3435 level and has recently dropped to the 3372 area. This provides a potential buying opportunity in the range of 3375 to 3350.Strategy:Look for Buy Entries: Watch for any signs of stabilization or reversal within the 3375 to 3350 area.Target: Consider aiming for a recovery towards previous resistance levels around 3435 or higher like 3484, depending on market momentum.Stop Loss: Set a stop loss below 3335 to manage risk in case of further downside movement.Reminder: Always confirm with your preferred technical indicators or chart patterns before entering a trade.
NextElliott
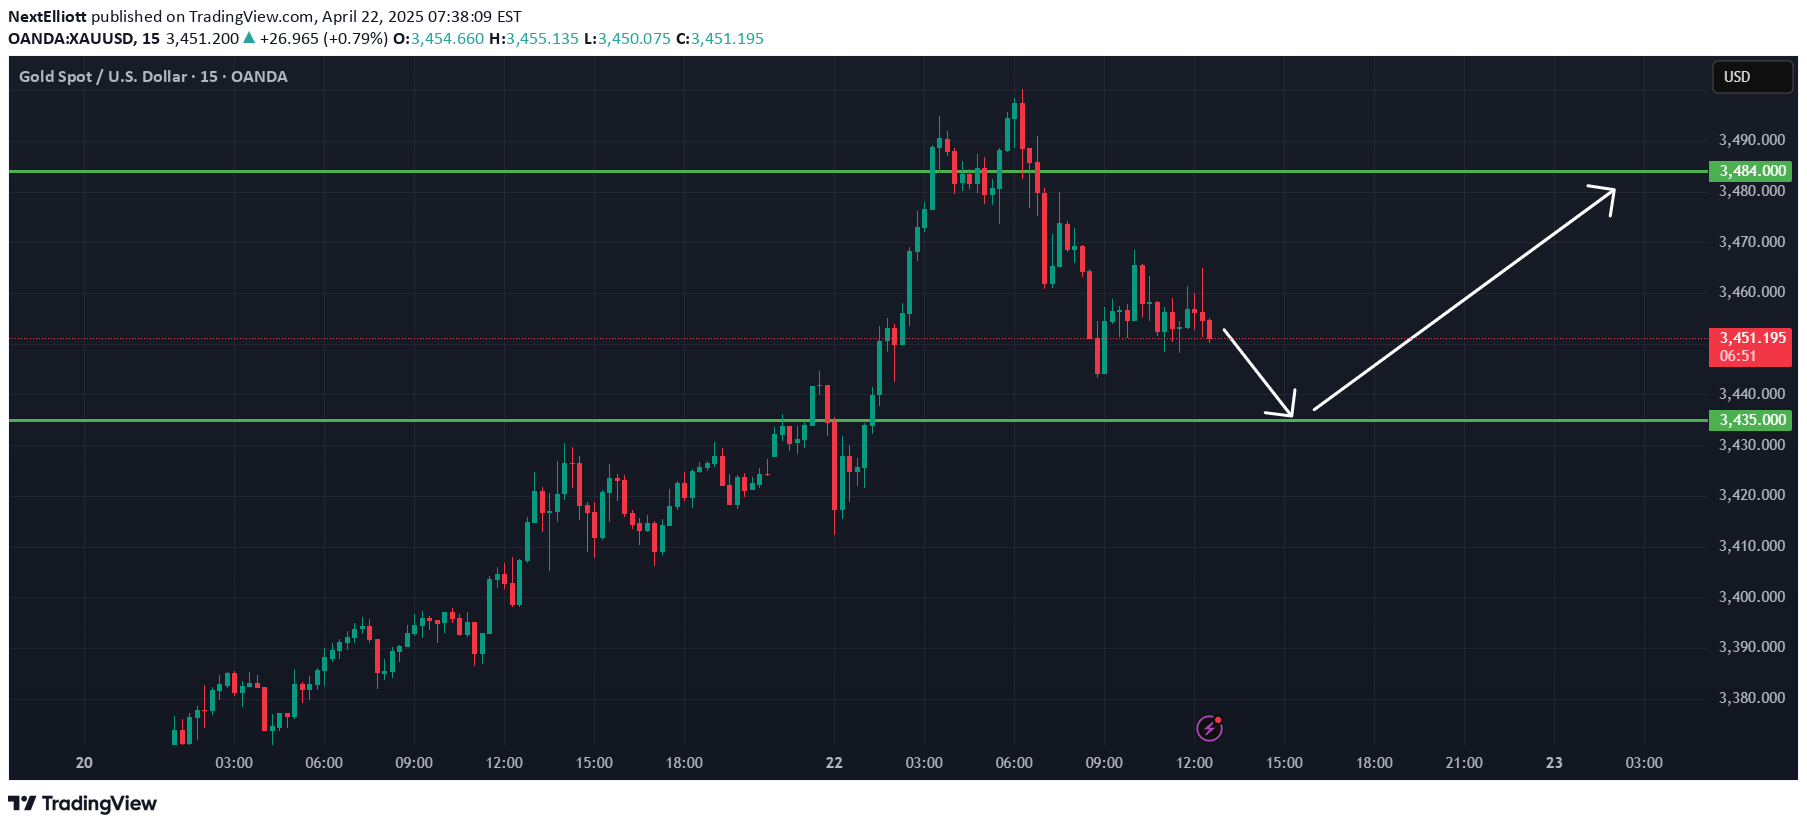
📉 Gold Price Outlook – Short-Term Move ExpectedGold is currently trading around $3452. We're anticipating a dip towards the $3435 area in the short term as part of a corrective move. This zone could act as a potential support level, where buyers may step in.Following this expected pullback, we’re looking for a bounce back up toward the $3484 area, targeting a short-term bullish recovery.📊 Key Levels to Watch:Support Zone: $3435Resistance Target: $3484As always, manage your risk accordingly and watch for price action confirmation at these levels.🚨 Target Hit! What's Next for Gold? 🟡💥Boom! 🎯 Gold just tagged my $3435 target spot-on — a perfect move as anticipated. Now, all eyes are on the next big level: $3484 📈Momentum is building, and if the bulls take control from here, we could see a strong push toward my next target. Stay sharp — the market’s heating up! 🔥📍 Current Price: $3434🎯 Next Watch Level: $3484Let’s see if the rally kicks off from here — buckle up! 🚀Gold Price Update & Buy Entry OpportunityThe price of gold couldn't sustain at the 3435 level and has recently dropped to the 3372 area. This provides a potential buying opportunity in the range of 3375 to 3350.Strategy:Look for Buy Entries: Watch for any signs of stabilization or reversal within the 3375 to 3350 area.Target: Consider aiming for a recovery towards previous resistance levels around 3435 or higher like 3484, depending on market momentum.Stop Loss: Set a stop loss below 3335 to manage risk in case of further downside movement.Reminder: Always confirm with your preferred technical indicators or chart patterns before entering a trade.
NextElliott
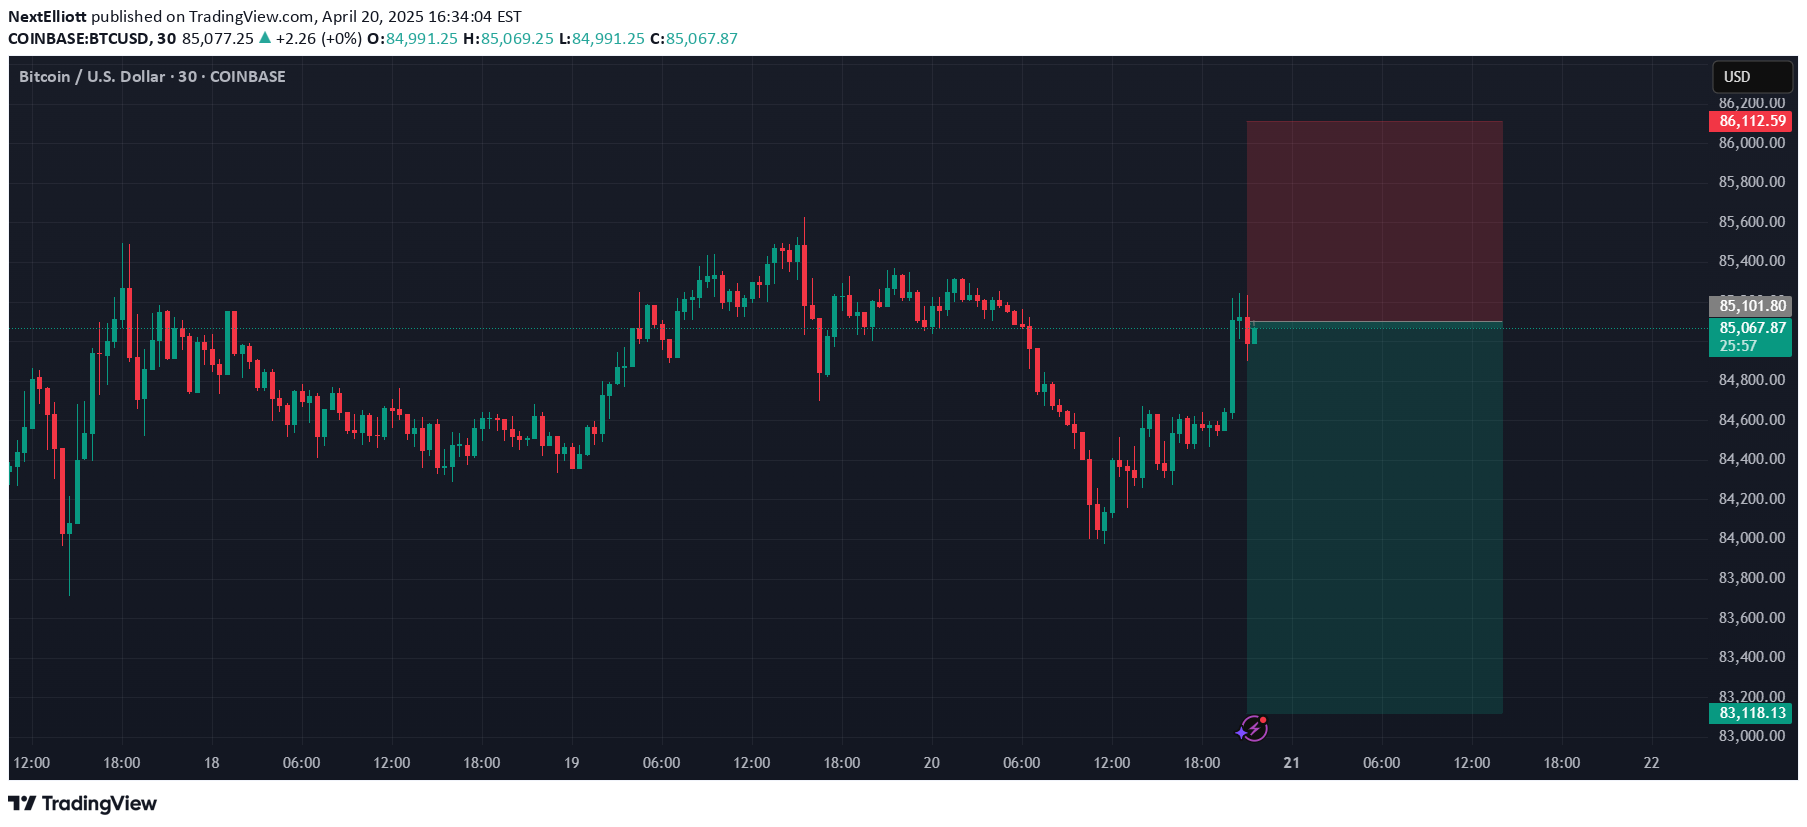
A bearish signal has been triggered for Bitcoin against the US Dollar at the 85,100 level. This indicates a potential trend reversal or correction from recent highs, suggesting sellers may be stepping in at this price point. Traders might consider this an opportunity to short BTCUSD or take profits on long positions. As always, proper risk management and confirmation from additional technical indicators (e.g., RSI, MACD, trendlines) are recommended before taking action.I will take profit @ 83100 or At next M30 or H1 RSI bullish divergence when it will occur..
Disclaimer
Any content and materials included in Sahmeto's website and official communication channels are a compilation of personal opinions and analyses and are not binding. They do not constitute any recommendation for buying, selling, entering or exiting the stock market and cryptocurrency market. Also, all news and analyses included in the website and channels are merely republished information from official and unofficial domestic and foreign sources, and it is obvious that users of the said content are responsible for following up and ensuring the authenticity and accuracy of the materials. Therefore, while disclaiming responsibility, it is declared that the responsibility for any decision-making, action, and potential profit and loss in the capital market and cryptocurrency market lies with the trader.