Technical analysis by NextElliott about Symbol BTC on 4/30/2025

NextElliott
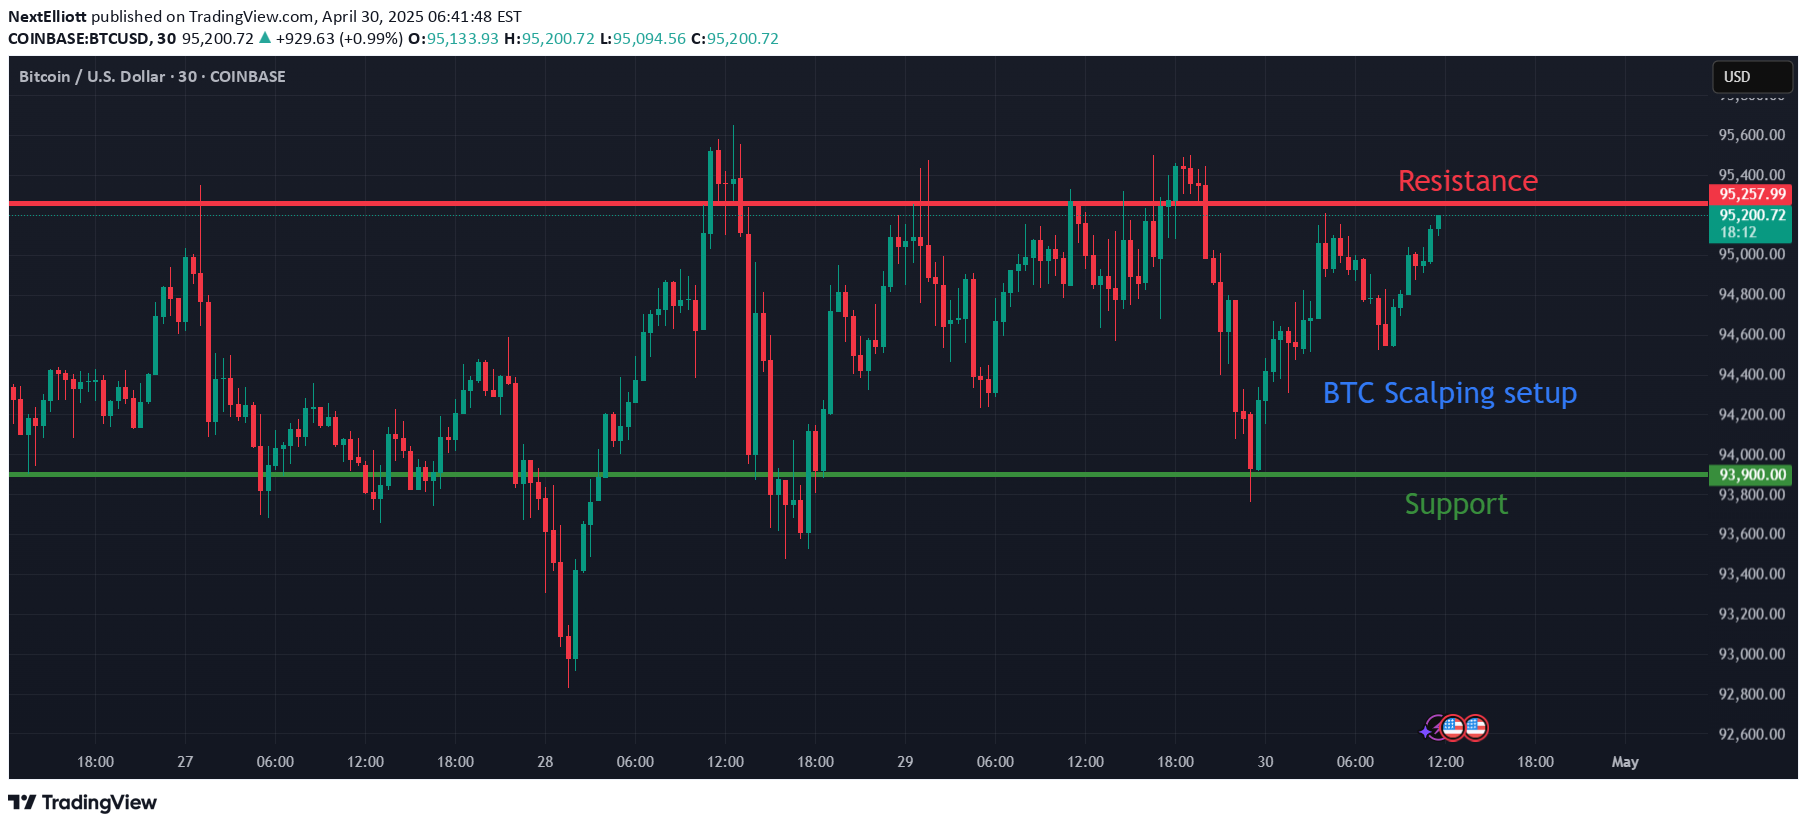
Bitcoin (BTC) Scalping Setup: Technical AnalysisKey Levels:Support: $93,900Resistance: $95,257Time Frame: Intraday Scalping (5-minute or 15-minute charts or 30-minute charts )Market Overview:Bitcoin (BTC) is currently consolidating in a relatively tight range between support at $93,900 and resistance at $95,257. This market structure is ideal for scalping, as the price tends to make short, quick moves between these levels, providing multiple opportunities for small, yet consistent, profits.Support Level ($93,900):Significance: This is a critical support zone that has held strong in recent price action. If the price continues to test this area and holds, it suggests that buyers are stepping in at this level, potentially looking for an upward reversal.Technical Indicators:RSI (Relative Strength Index): Watch for the RSI near or below 30 (indicating oversold conditions). A rebound off the support level combined with an RSI divergence would signal strong buying pressure.Volume: Volume spikes near this level could signal that demand is increasing as the price approaches support. A higher-than-average volume at support could confirm the potential for a bounce.Resistance Level ($95,257):Significance: Resistance at $95,257 has proven to be a tough barrier, with the price failing to break above this level in recent tests. Scalpers should be aware of short-term rejection at this point, as it may provide an opportunity to enter a short position.Technical Indicators:MACD: Look for a bearish MACD crossover near this resistance level. A MACD divergence can signal weakening bullish momentum, hinting at a potential reversal or consolidation.Candlestick Patterns: Candlestick formations such as Doji, Shooting Star, or Engulfing Patterns near this resistance would signal exhaustion in the uptrend and a higher probability of a pullback.Trade Setup:Scalping Long (Buy) Setup:Entry: Enter long near $93,900 support if the price holds and shows signs of a rebound (e.g., candlestick reversal patterns, RSI divergence).Stop Loss: Place the stop just below $93,500 to protect against a deeper breakdown.Target: Set an initial target at $94,800 (near the middle of the range) and a final target near $95,000, keeping a risk-to-reward ratio of at least 1:2.Scalping Short (Sell) Setup:Entry: Enter short near $95,257 resistance if the price fails to break higher and starts to show signs of rejection (e.g., a bearish candlestick formation or RSI divergence).Stop Loss: Place the stop slightly above $95,500 to account for any potential false breakouts.Target: Set the first target at $94,500 and the second at $93,900, aligning with support.Additional Insights:Volume Analysis: Scalpers should always monitor volume to confirm the strength of price moves. A break above resistance with declining volume would be a cautionary signal, as it suggests the move might be unsustainable.Intraday Sentiment: Keep an eye on broader market sentiment (especially in crypto-related news or macroeconomic events) as it can affect the short-term price action.Conclusion:This scalping setup offers multiple opportunities within a clear range. As the price fluctuates between $93,900 (support) and $95,257 (resistance), traders can use technical indicators to manage entry and exit points effectively. Tight stop-losses and quick, targeted gains are crucial for success in this type of strategy, as Bitcoin can be highly volatile in these intraday moves.Happy trading, and always manage risk effectively!Bitcoin's Meteoric Rise: A Precision Forecast Fulfilled! 🚀The markets have spoken, and as predicted, Bitcoin (BTC) has soared to meet the target of $93,900, validating the accuracy of my resistance and support zones. The analysis was spot on—both in terms of timing and price action—proving that technical analysis, when done right, can be an incredibly powerful tool.From carefully plotted support zones to the crucial resistance levels, every indicator pointed to this very moment. The precise targeting of $93,900 was a culmination of in-depth market observation, trend analysis, and a deep understanding of BTC’s price action. As Bitcoin surged to meet my forecast, it wasn’t just a triumph of numbers, but a celebration of strategy, experience, and patience.The path leading to this target wasn’t always linear, but every pivot, every retracement, and every candlestick pattern worked in perfect harmony to bring us to this remarkable milestone. For those who followed my analysis, this is a true testament to the art and science of predicting market movements.Here’s to accurate forecasting, profitable gains, and more targets ahead. 🔥 Let's keep the momentum going!
