Technical analysis by NextElliott about Symbol BTC on 5/9/2025

NextElliott
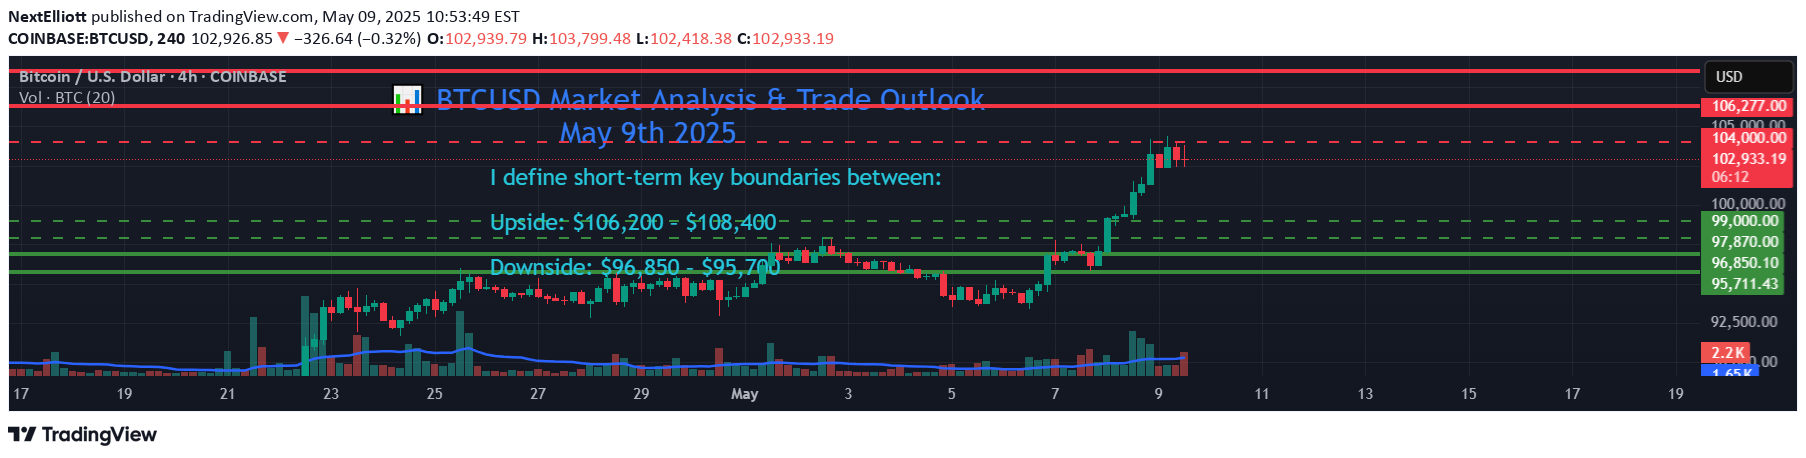
📊 BTCUSD Market Analysis & Trade Outlook (Post $103,500 Target)Instrument: BTCUSDStrategy Type: Probabilistic Breakout with Elliott & Gann ConfluenceCurrent Price: $102,600Trade Horizon: 2–5 DaysTimeframes Observed: 4H / Daily🔍 Market OverviewBTCUSD has successfully completed the prior trend continuation target of $103,500, respecting the bullish structure on 4H and Daily timeframes. As of now, price is consolidating just below key resistance, printing a high of $103,800 and retracing slightly to $102,600. This signals a potential decision zone where BTC may either continue its advance or initiate a deeper pullback.I define short-term key boundaries between:Upside: $106,200 – $108,400Downside: $96,850 – $95,700📐 Technical Structure & Key ZonesSupport Zone: $ 97870 , $96,850–$95,700 (Previous consolidation + high volume node)Resistance Zone: $106,200–$108,400 (Measured move & fib cluster area)Structure Bias: Bullish above $99,000; bearish pressure increases below $96,850🔄 Elliott Wave Count (Short-Term, 4H)BTC appears to be in a Wave (3) of a higher-degree Wave 3, following a Wave (2) retracement toward $94,500.Current price movement is within a sub-wave 3 of (3), with the recent high at $103,800 potentially marking a sub-wave 3 top.A brief corrective Wave 4 could develop toward $100,500–$99,000, before a final Wave 5 drives price into the $106,200–$108,400 zone.If price fails to hold above $96,850, the structure may morph into a larger corrective Wave (4), targeting the lower boundary.📊 Gann AnalysisThe Gann 1/1 angle from the March swing low is currently intersecting near $102,500–$103,000, offering resistance.Next key Gann levels:Above: $106,200 (120°) and $108,400 (135°) resistance arcsBelow: $96,850 and $95,700 align with 45° and 60° support anglesTimewise, entering a minor Gann cycle window on May 10–11, often associated with inflection points. Watch for breakout or reversal signals near this period.🎯 Trade Scenario Outlook🟢 Bullish Scenario (Breakout)Trigger: 4H close above $104,000Target Zones:TP1: $106,200TP2: $108,400Invalidation: 4H close below $99,000 (consider tightening SL)🔴 Bearish Scenario (Pullback)Trigger: Break below $99,000, especially on strong volumeTarget Zones:TP1: $97870 or $96,850TP2: $95,700Invalidation: Close above $104,000 invalidates pullback thesis⚙️ Strategic Trade NotesScalping & Swinging Options:Consider range scalps within $102,000–$99,000, but prepare for trend breakout.Swing traders may build positions on retracement (Wave 4) with invalidation below $97870, $96,850.Risk Management:Use volatility-adjusted stop losses under key Gann levels or 50EMA on 4H.Consider tightening stops or taking partials near $106,200 to protect gains if price extends.📌 ConclusionBTCUSD remains in a bullish macro structure but approaches a key inflection zone. A break and hold above $104,000 could launch the next impulsive leg toward $108,400. Conversely, failure to hold above $99,000 opens the door for a deeper retracement to $ 97870, $96,850–$95,700. Traders should remain flexible, aligning with the prevailing momentum while respecting structural boundaries.Bullish Scenario (Breakout)Trigger: 4H close above $104,000Target Zones:TP1: $106,200TP2: $108,400Invalidation: 4H close below $99,000 (consider tightening SL)Finally 106000 Hit... Target achieved
