
MonoCoinSignal
@t_MonoCoinSignal

What symbols does the trader recommend buying?
Purchase History
پیام های تریدر
Filter
MonoCoinSignal
BTC: The Premium Zone Trap (4H vs 1H)

Bitcoin is at a decisive junction. We are trading in the Premium Zone ($93,700+) with a clear conflict between timeframes. The 4H screams exhaustion (RSI 70.7 + Low Volume), while the 1H structure remains stubbornly bullish, holding above the $92,102 demand zone. The structure is intact, but the conviction is missing. 1. THE TECHNICAL REALITY (4H + 1H) 📉 We are seeing a divergence between price action and momentum: • The Trap (4H): Price is in the Premium sell zone. RSI is overbought (70.7) and volume is down 41% at these highs. This is classic "divergence" behavior, price grinding up while participation drops. • The Floor (1H): Despite the macro exhaustion, the 1H timeframe has cooled off (RSI 42.9) and is respecting the Ascending Support Trendline ($92,306). • The Magnet: We have a bearish OB supply overhead at $94,760, but a juicy unfilled FVG sitting below at $90,189. Price hates leaving these gaps open. 2. THE CONFLICT: MOMENTUM VS. STRUCTURE ⚖️ Bearish Case (The Exhaustion): • Volume has collapsed 66% on the 1H timeframe. • MACD is printing bearish divergence on the 4H. • 14.1% wick rejection at the $94,760 local top suggests sellers are active. Bullish Case (The Trend): • CHoCH and BOS are both confirmed bullish. • Price is holding above all major EMAs (20/50/200). • Buyers are defending the $92,102 Order Block. 3. THE TRADE SETUP 🎯 We play the reaction, not the prediction. Here are the two probability paths: 🔴 Scenario A: The Premium Rejection (Higher Probability) If volume fails to return, gravity takes over. • Trigger: Loss of the 1H support trendline ($92,300) • Target 1: $90,189 (Filling the 4H FVG) • Target 2: $86,760 (Major Swing Low) • Invalidation: 4H Close above $94,760 🟢 Scenario B: The Demand Reclaim If the 1H structure holds, we squeeze the shorts. • Trigger: Bounce from $92,102 (Bullish OB) with increasing volume • Target: $94,760 (Range High) → $96,000 Extension • Stop: Tight below $91,900 MY VERDICT Short-term structure is bullish, but the "fuel" (volume) is empty. I am leaning 68% bearish (expecting a sweep of the $90k FVG) unless we see a massive volume injection above $94k. Patience is the play, let the $92,100 level dictate the next move. MARKET ROTATION WATCHLIST 📋 While Bitcoin consolidates in this premium zone, liquidity often rotates into specific altcoin setups that are lagging behind. I am updating my watchlist today for coins that are showing cleaner structure than BTC.
MonoCoinSignal
Gold: Oversold or Overdue?

Gold's grinding at a critical inflection point where EMA50 and EMA200 converge at $4,325.22, a confluence that's rejected price multiple times. We're trading below all major moving averages in a confirmed strong trend (ADX 46.8), but RSI at 30.4 and MFI at 100.0 are flashing conflicting exhaustion signals. The path of least resistance remains down, but the setup requires patience for directional confirmation. 1. THE TECHNICAL REALITY 📉 • Price trapped below EMA cluster ($4,325.22) acting as dynamic resistance • Trading beneath all major moving averages (EMA20 at $4,377.27) • Forming compression pattern with both higher lows AND lower highs • 35.8% lower wick shows buyers defended $4,317.13 but couldn't reclaim structure 2. THE INDICATORS ⚖️ Bearish Signals: • ADX 46.8 confirms strong downtrend environment • MACD -34.30 below signal -27.84 (bearish crossover active) • Price position below middle Bollinger Band • Multiple rejections at EMA50/200 confluence Bullish Signals: • RSI 30.4 flirting with oversold territory • MFI pegged at 100.0 suggesting potential exhaustion • Buyers stepped in at yesterday's lows The Conflict: Oversold indicators typically signal reversal potential, but in strong trends (ADX 46.8), oversold conditions can persist far longer than logic suggests. Price action confirmation is required, oscillators alone aren't enough. 3. THE TRADE SETUP 🎯 🔴 Scenario A: Rejection & Continuation • Trigger: Failure to reclaim $4,340.00 on 4H close • Entry: Break below $4,300.00 psychological support • Target 1: $4,274.20 swing low (0.6% move) • Target 2: $4,235.75 lower Bollinger Band (extended) • Stop: Close above $4,350.00 🟢 Scenario B: Exhaustion Reversal • Trigger: Reclaim and hold $4,340.00 on 4H close • Entry: Confirmed hold above $4,340.00 • Target 1: $4,377.27 EMA20 retest (1.2% upside) • Target 2: $4,392.60 middle Bollinger Band • Invalidation: Break below $4,300.00 MY VERDICT The higher probability scenario favors the bearish continuation, price structure, MACD positioning, and EMA rejection align for downside. But this isn't an aggressive short. WAIT for directional confirmation: either the $4,300 break or the $4,340 reclaim. Trading the compression before the break is a coin flip.
MonoCoinSignal
Bitcoin: Wedge That's About to Explode

As predicted in my previous analysis Bitcoin followed our roadmap to the dollar. We saw the exact flush to the $86k demand zone, followed by a surge back to $90,300 where price faced the rejection we anticipated. Now, the market has coiled into a tight wedge, setting the stage for the next decisive move. Bitcoin is coiled in a converging wedge with just $214 of breathing room between ascending support ($87,533) and descending resistance ($87,319). With 10 touches validating that support line and volume 68% below average, we're in the calm before the storm. Breakout expected within 10 bars, here's how to position for it. 1. THE TECHNICAL REALITY 📉 • Price trading below all three major EMAs (20/50/200) creating overhead resistance • Wedge compression to $214 width signals forced resolution imminent • 40.2% lower wick vs 40.9% upper wick = perfect equilibrium between bulls and bears • 10 touches on ascending support from $84,408 make this an exceptionally validated trendline 2. THE INDICATORS ⚖️ Bearish Signals: • MACD bearish with line at 84.29 below signal at 90.08 • Trading below entire EMA cluster creates natural resistance • Recent rejection at bearish order block ($90,599-$89,109) Bullish Signals: • Bullish order block at $87,555-$86,760 aligns with ascending support • RSI at 51 shows room to move either direction • Ascending trendline has held 10 consecutive tests The Conflict: MFI at 49.7 and volume 68% below average ($4,999 vs $15,693) reveal neither side has conviction. The market is waiting for a catalyst to commit capital. 3. THE TRADE SETUP 🎯 🔴 Scenario A: Wedge Breakdown (Higher Probability) • Trigger: 4H close below $87,533 with above-average volume • Entry: $87,400 on confirmed break • Target 1: $86,355 (1.4% move, recent swing low) • Target 2: $85,073 if selling accelerates • Stop: $88,200 (0.8% risk = 1.6:1 R/R to first target) 🟢 Scenario B: Wedge Breakout (Lower Probability) • Trigger: Reclaim $88,200 and break through EMA cluster • Entry: Break above $89,557 (immediate resistance) • Target: $90,599 (bearish OB), extended to $92,018 (premium zone) • Invalidation: Failure to hold $88,200 on retest CRITICAL LEVEL: 4H close above $90,599 invalidates the entire bearish thesis and signals Change of Character bullish. MY VERDICT The setup slightly favors bears at 72% confidence due to EMA structure and MACD momentum, but that ascending support has earned respect with 10 touches. I'm treating this as a patience game, waiting for the wedge to break with volume confirmation rather than front-running. The compression rate suggests resolution within 24-48 hours. When a trendline this validated breaks, stop losses cascade and accelerate the move.
MonoCoinSignal
SOL: The Equilibrium Standoff
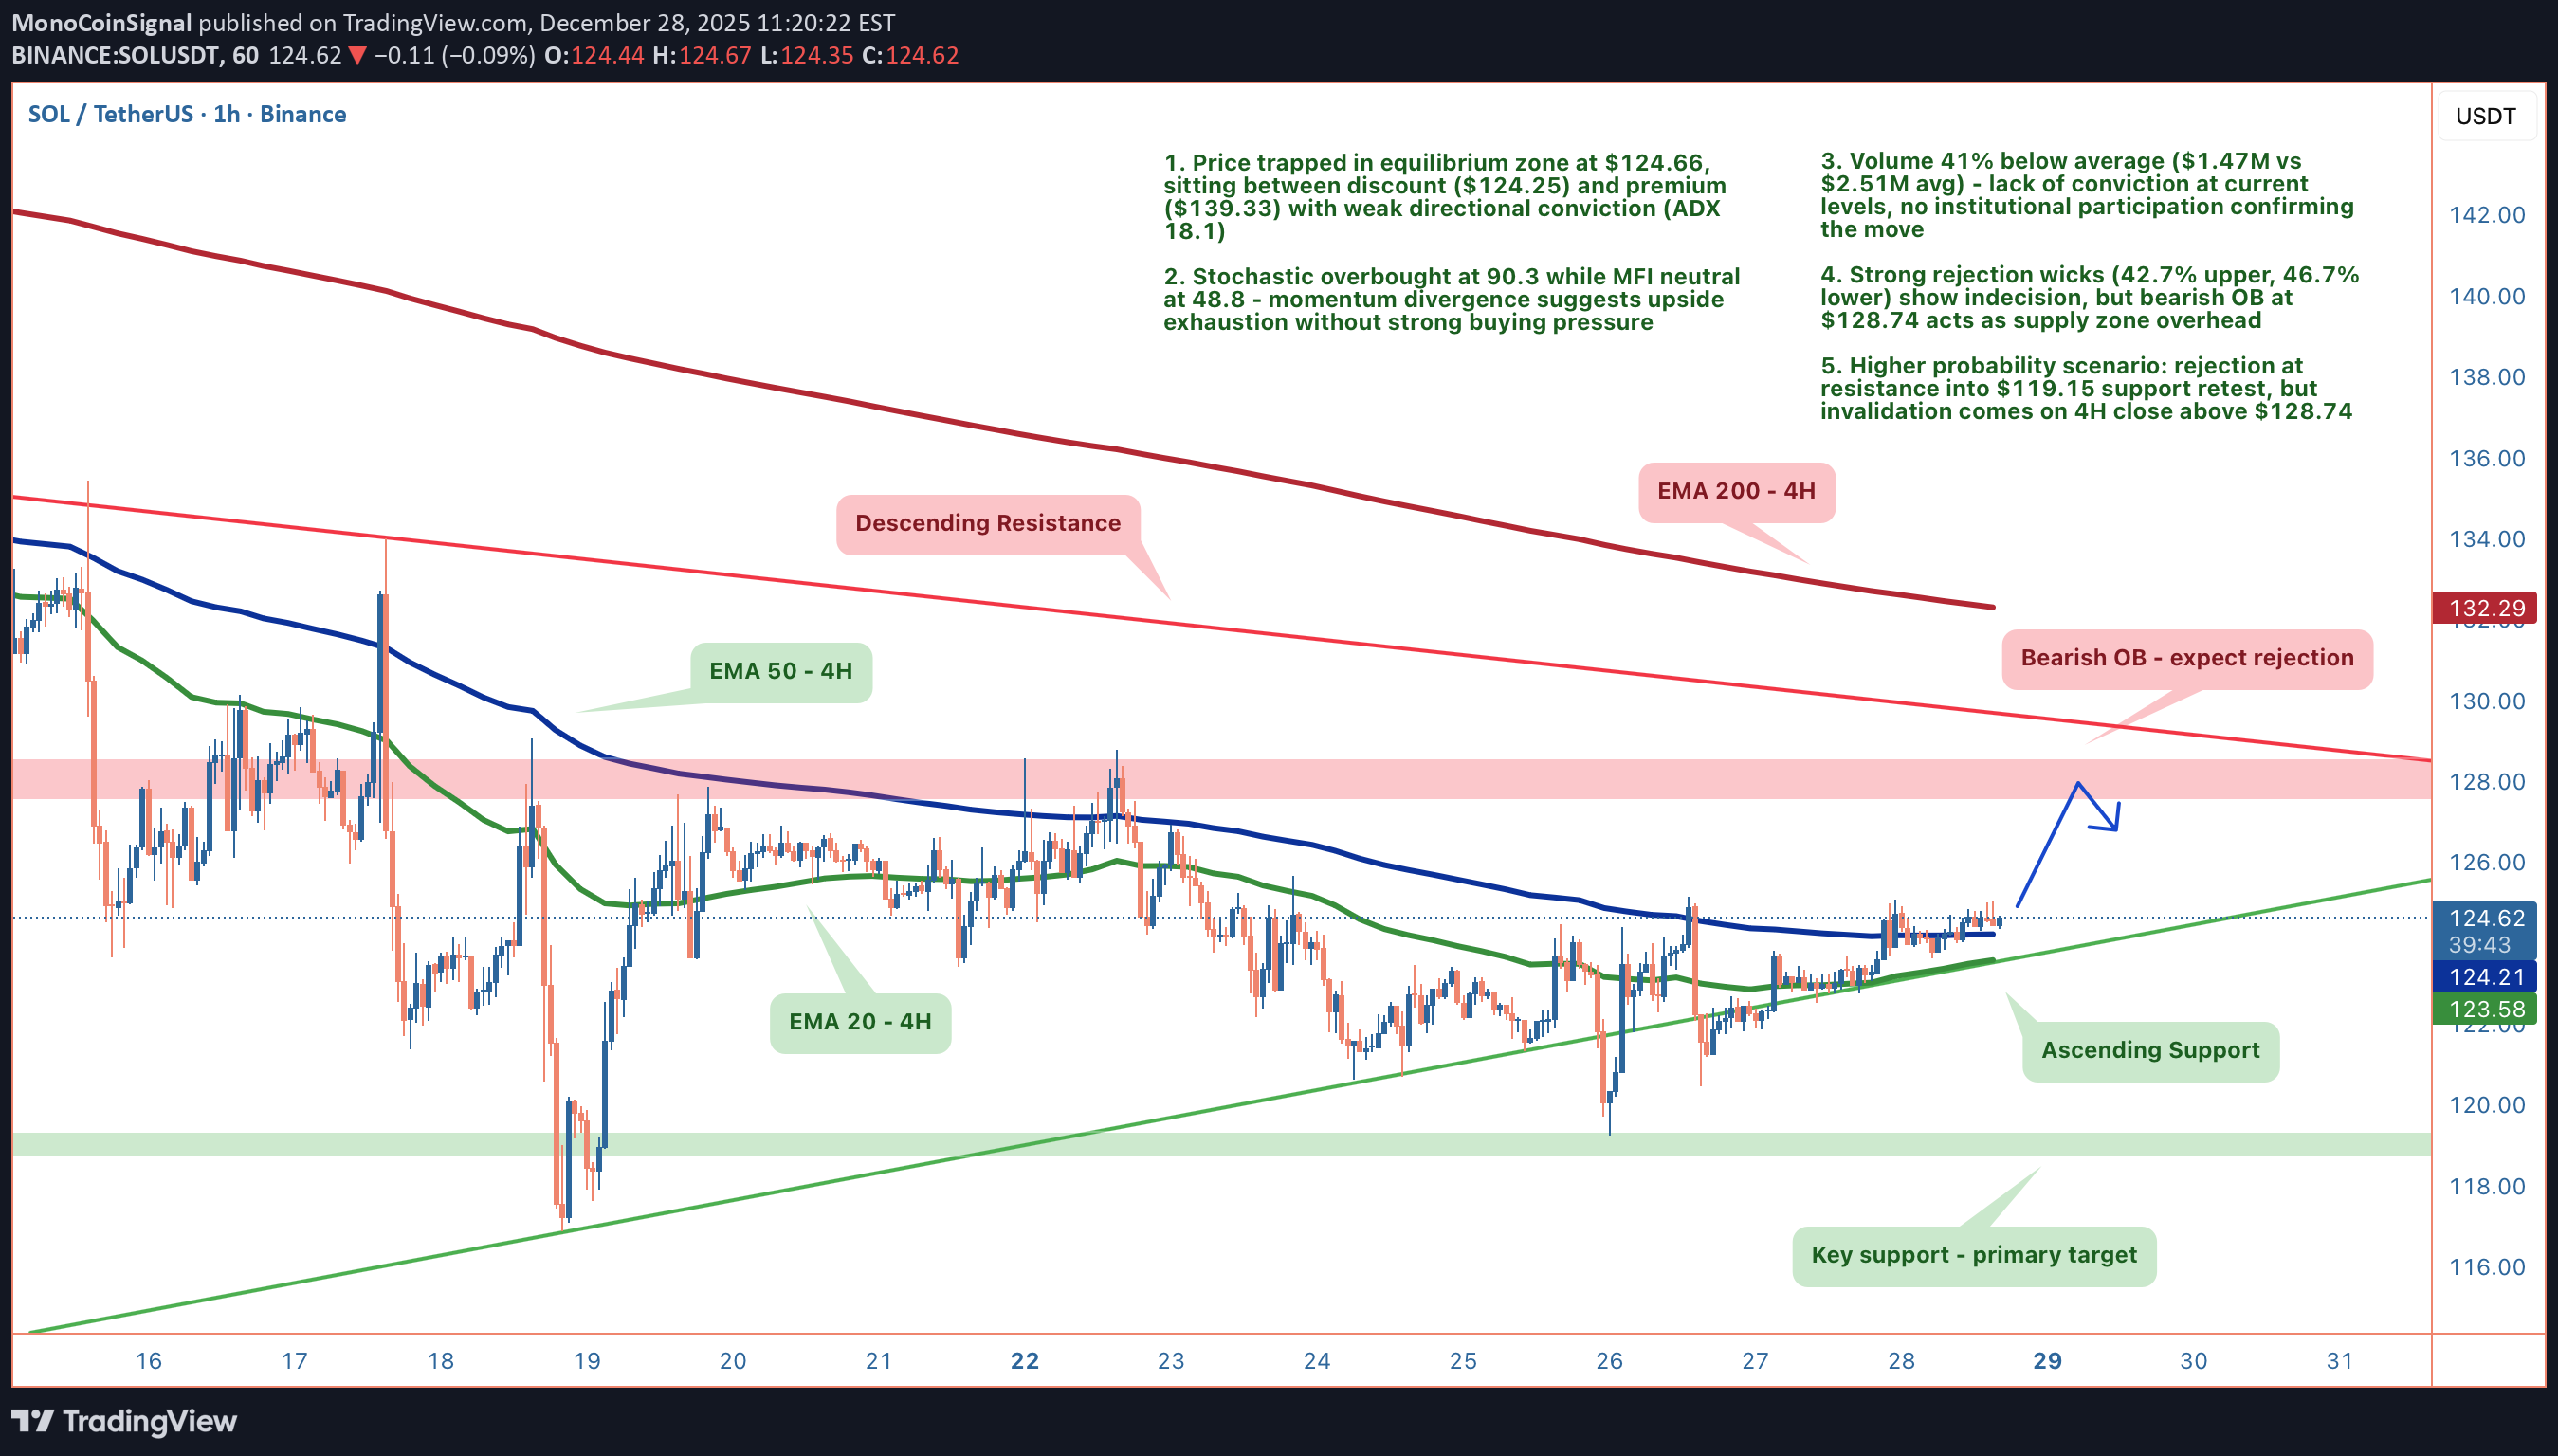
SOL sits at $124.66 in pure equilibrium, not discount, not premium, just stuck. The market structure isn't signaling a breakout; it's signaling a standoff. With volume 41% below average and momentum indicators in conflict, this is a wait-for-resolution setup, not a chase-the-move trade. 1. THE TECHNICAL REALITY 📉 • Price trapped between discount zone ($124.25) and premium ($139.33) • Bearish swing trend with weak conviction (ADX only 18.1) • Wick analysis shows war zone: 46.7% lower wick (support) vs 42.7% upper wick (rejection) • Volume at $1.47M vs $2.51M average, smart money isn't showing up 2. THE INDICATORS ⚖️ Bearish Signals: • Stochastic screaming overbought at 90.3 • Bearish order block overhead at $128.74 (key supply zone) • Volume 41% below normal, no institutional confirmation Bullish Signals: • MACD just flipped bullish (0.2262 vs -0.0791) • RSI neutral at 60.8 • MFI neutral at 48.8 The Conflict: Stochastic overbought while MFI stays neutral, that's momentum divergence. When indicators can't agree, the current move is running on fumes, not fuel. 3. THE TRADE SETUP 🎯 🔴 Scenario A: Rejection & Retest (Higher Probability) • Trigger: Rejection at $128.74 bearish OB • Entry: Breakdown below $123.42 (FVG fill) • Target: $119.15 swing low support • Stop: 4H close above $128.74 🟢 Scenario B: Structure Flip (Lower Probability) • Trigger: Reclaim of $139.33 premium zone • Entry: 4H close above $128.74 • Target: Change of Character (CHoCH) bullish • Invalidation: Rejection back below $128.74 MY VERDICT 62% confidence bearish lean. Setup favors rejection at resistance into support retest, but weak trend strength (ADX 18.1) means this could chop sideways before resolving. I'm not forcing trades in low-conviction environments, risk management is the difference between chess and checkers.
MonoCoinSignal
LINK: The Spring is About to Break
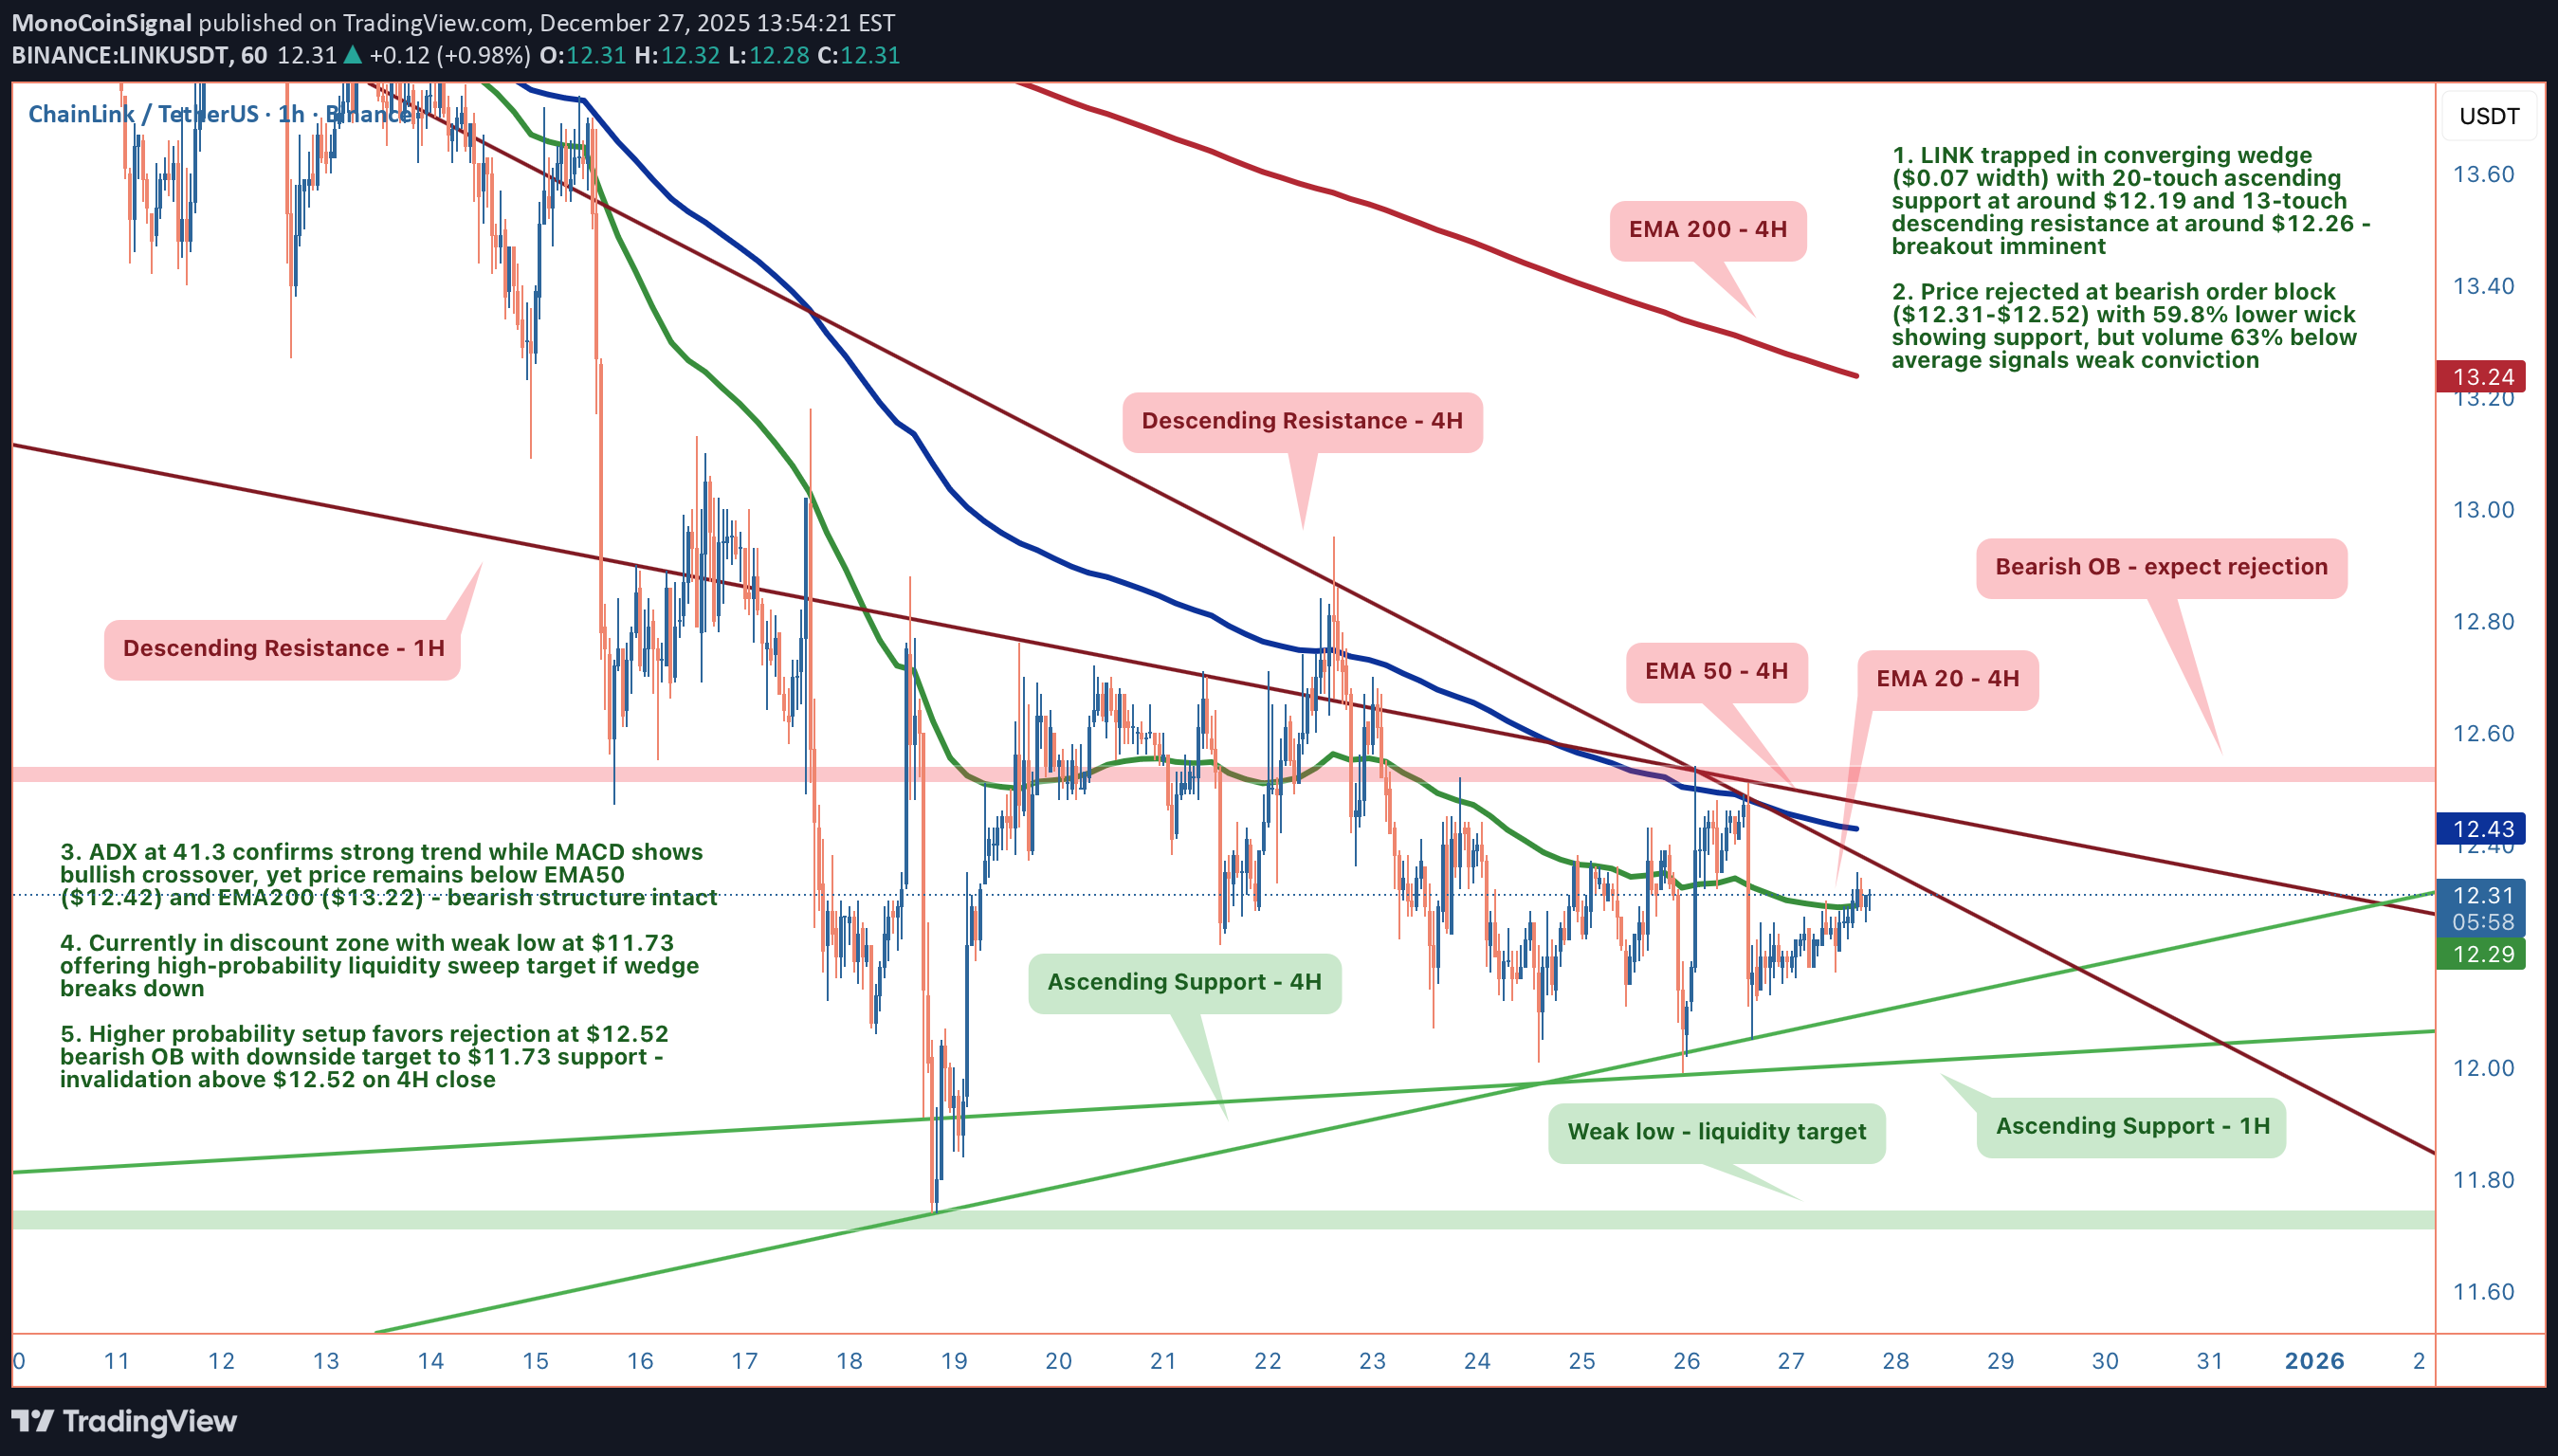
We're sitting at the apex of a textbook converging wedge with just $0.07 of room left. 20 touches on ascending support ($12.19), 13 touches on descending resistance ($12.26), and price currently at $12.30. The coiled spring scenario is here—something gives within the next few bars. 1. THE TECHNICAL REALITY 📉 • Wedge compression: Width contracted from $14.62 to $0.07 over 467 bars—apex reached • Macro structure: Price below EMA50 ($12.42) and EMA200 ($13.22)—bearish trend intact • Current position: Testing middle Bollinger Band ($12.27), just above EMA20 ($12.29) • ADX at 41.3: Strong trending environment confirmed 2. THE INDICATORS ⚖️ Bearish Signals: • Bearish order block overhead at $12.31-$12.52 acting as supply • Volume 63% below average ($622K vs $1.66M)—weak conviction on bounce • Swing trend bearish despite trading in discount zone • Upper wick 29.3% showing rejection at resistance Bullish Signals: • MACD bullish crossover (MACD -0.0311 above Signal -0.0451) • Lower wick 59.8% showing strong support attempts • Bullish order block below at $12.21-$12.63 providing demand • RSI neutral at 54.4, MFI at 67.3 (elevated but not extreme) The Conflict: MACD suggests momentum shift, but volume tells the opposite story. Without conviction behind this bounce, the 59.8% lower wick represents indecision rather than strength. Structure trumps oscillators here. 3. THE TRADE SETUP 🎯 🔴 Scenario A: Wedge Breakdown (Higher Probability - 68%) • Trigger: 4H close below $12.21 (bullish OB support break) • Entry: Confirmation below $12.21 with volume • Target: $11.73 (weak low liquidity sweep, 4.70% distance) • Stop: 4H close above $12.52 Logic: Price rejects at $12.52 bearish OB (aligns with descending resistance), breaks 20-touch ascending support at $12.19, sweeps equal lows at $11.73 where unprotected buy-side liquidity sits. Converging wedges typically break in direction of prior trend—which is down. 🟢 Scenario B: Breakout Reversal • Trigger: Decisive break above $12.52 with volume • Entry: 4H close above $12.52 (breaks bearish OB + descending resistance) • Target: $14.19 (premium zone threshold, triggers CHoCH bullish) • Invalidation: Rejection back below $12.52 Logic: Reclaiming $14.19 invalidates entire bearish structure and signals bulls have control. Given positioning below EMA50/200 and bearish swing trend, assigning lower probability to this outcome. MY VERDICT Risk-reward favors the breakdown. The 20-touch ascending support at $12.19 breaking on volume would be a significant technical event that accelerates selling. Wait for confirmation rather than front-running—the wedge apex doesn't care about your bias, it breaks based on order flow.The price reached the Bearish OB, rejected as expected. Waiting to see what is going to happen.
MonoCoinSignal
بیت کوین در آستانه صعود: منتظر اصلاح یا شکست قیمتی بمانیم؟
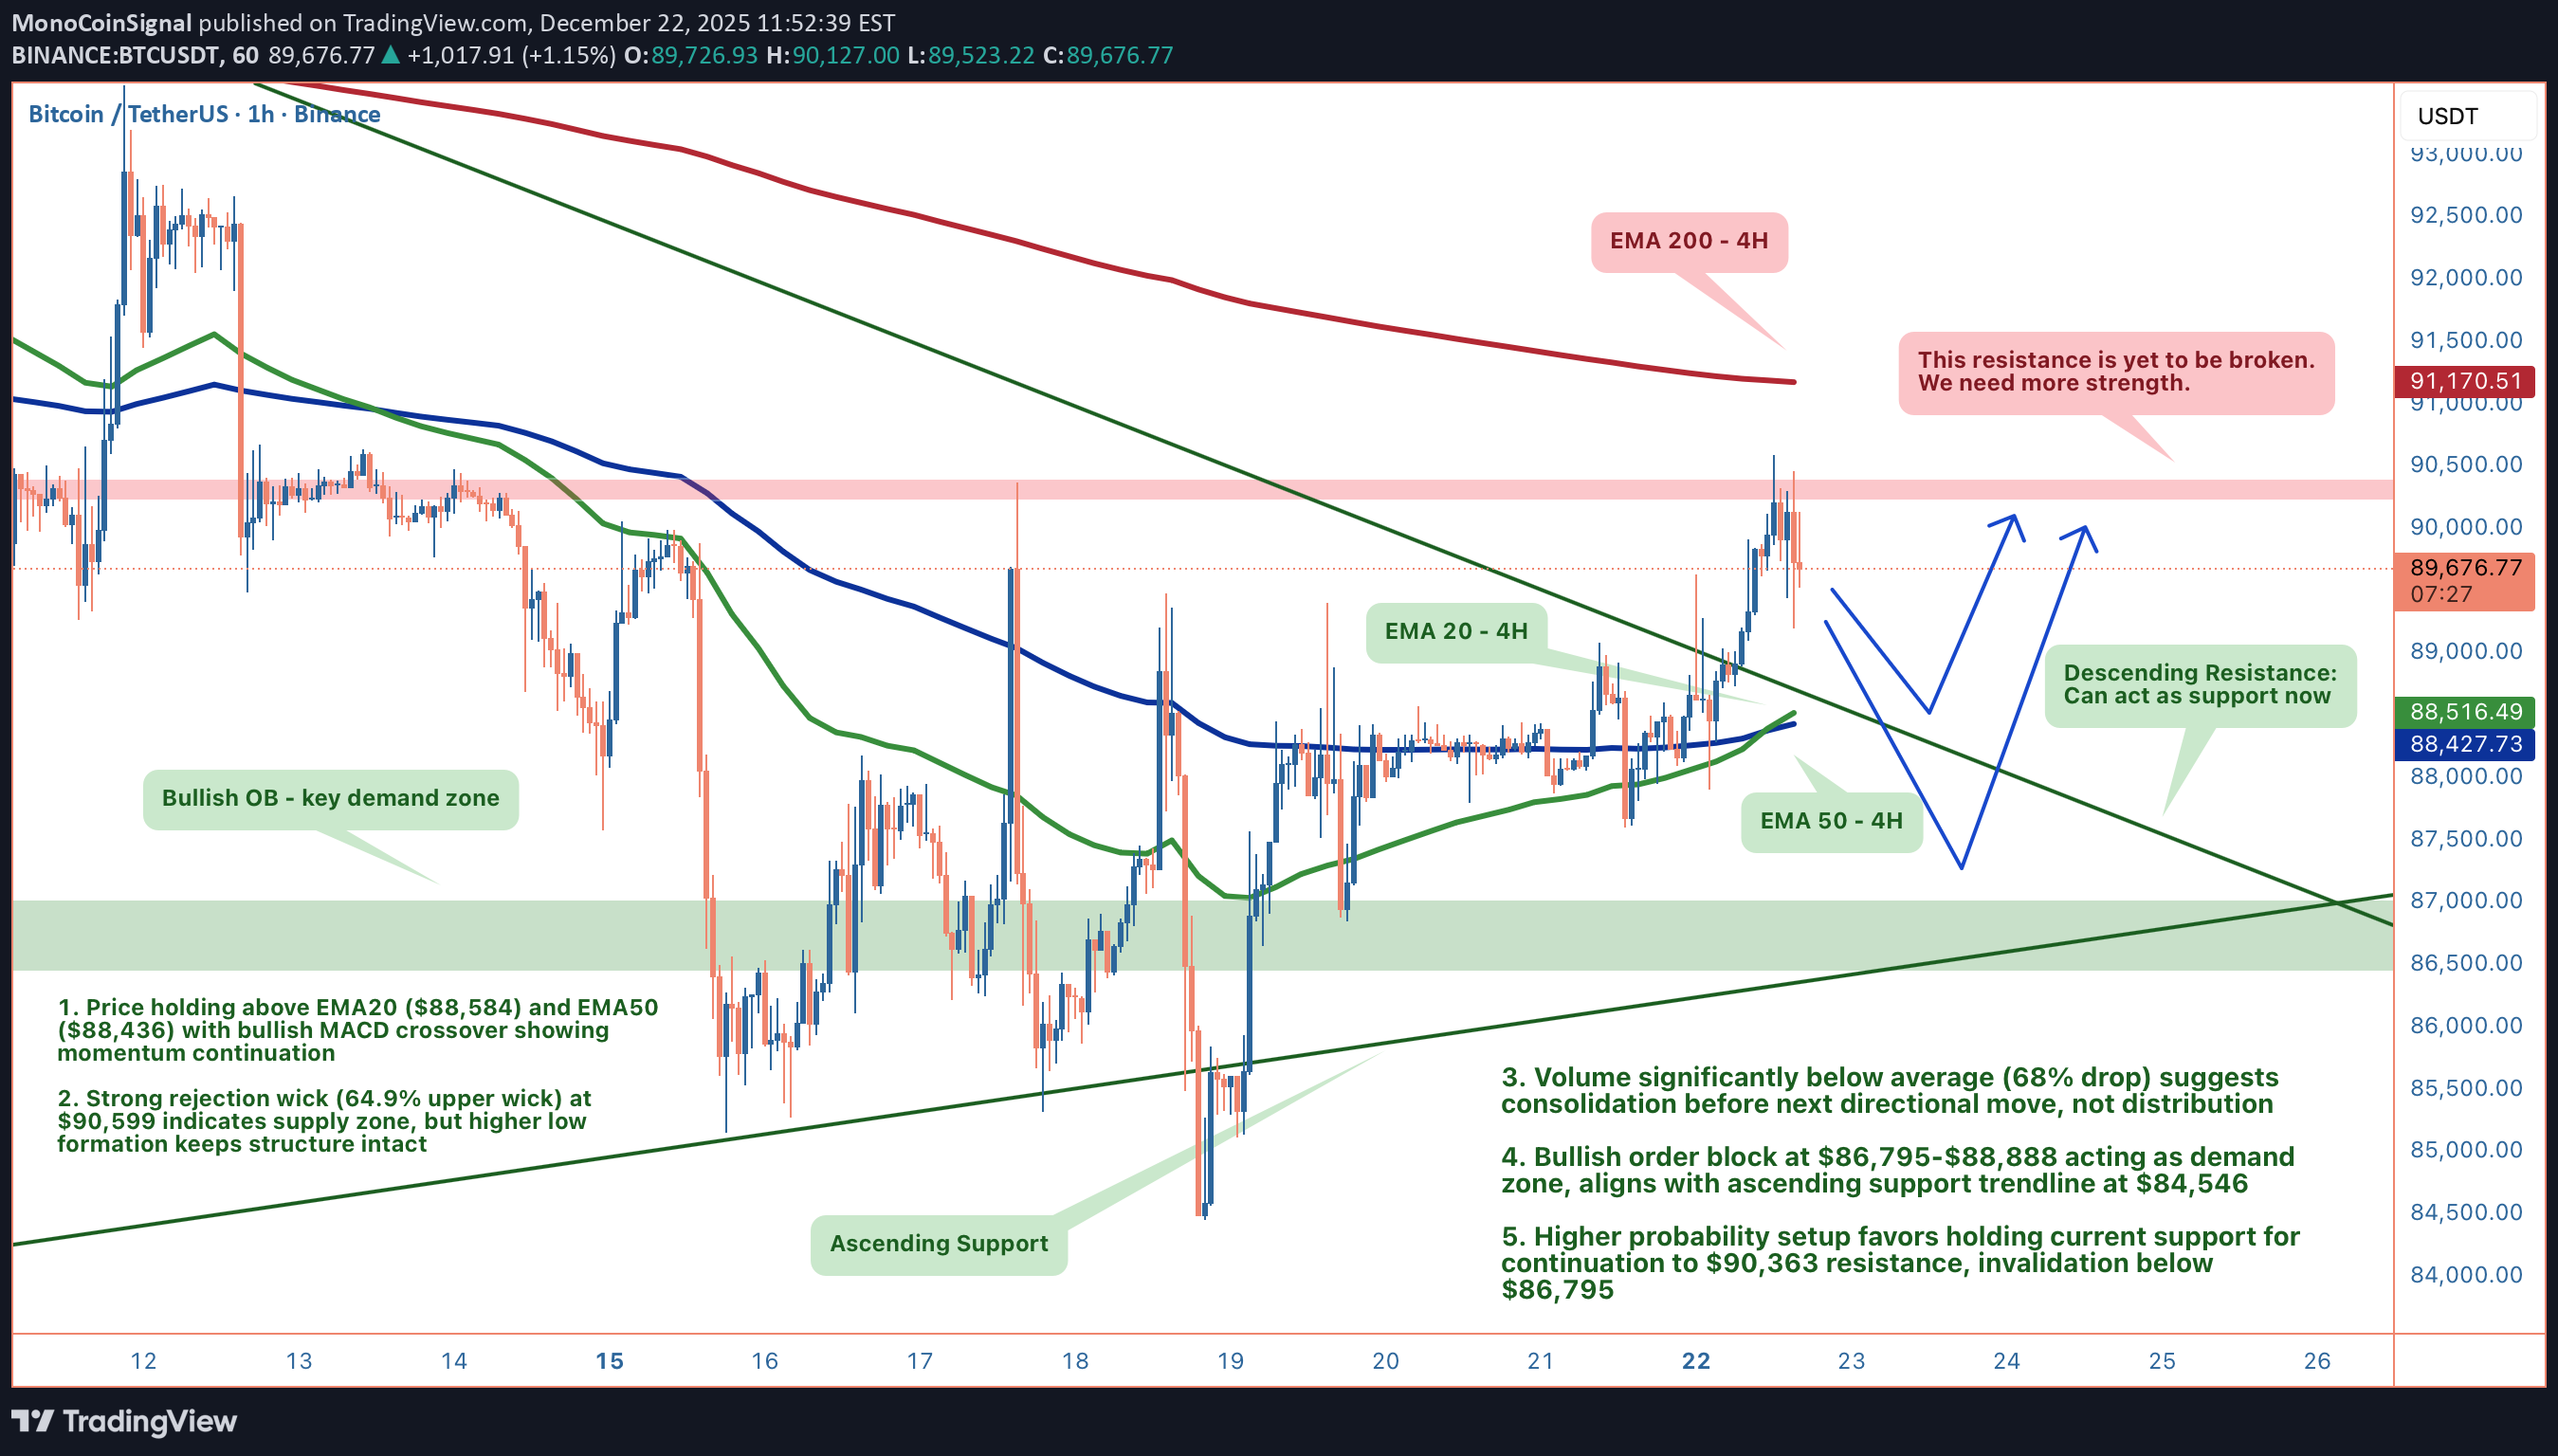
We're sitting at equilibrium ($89,619) with a clean higher low formation intact above both EMAs. The structure favors continuation, but the 64.9% rejection wick at $90,599 created a supply zone we need to respect. Volume is 68% below average—this is consolidation, not distribution. 1. THE TECHNICAL REALITY 📉 • Higher low formation holding above EMA20 ($88,584) and EMA50 ($88,436) • Bearish order block at $89,429-$90,617 acting as supply after aggressive rejection • Bullish order block at $86,795-$88,888 aligned with ascending trendline (4 touches, 127 bars validated) • Structure remains unbroken despite the upper wick—support at $89,200 held 2. THE INDICATORS ⚖️ Bullish Signals: • MACD crossover confirmed (476 vs 308) showing momentum build • MFI at 75.5 indicates strong money flow • ADX at 30.2 shows moderate directional conviction Bearish Signals: • RSI at 67.7 approaching overbought territory • Volume 68% below average suggests caution on immediate breakout The Conflict: Low volume typically signals accumulation at these levels, not distribution. The question is whether we get one more shakeout to the demand zone before the next leg. 3. THE TRADE SETUP 🎯 🟢 Scenario A: Pullback Entry (Higher Probability) • Trigger: Pullback to $89,200 or sweep to $86,795-$88,888 bullish OB • Entry: $86,795-$88,888 demand zone (confluence with ascending trendline at $84,546) • Target 1: $90,363 (immediate resistance) • Target 2: $91,066 (premium zone entry) • Target 3: $94,555 (weak high sweep) • Stop: Below $86,700 🟢 Scenario B: Breakout Acceleration • Trigger: Clean 4H close above $91,066 with volume confirmation • Entry: Flip of $91,066 to support (CHoCH bullish) • Target: $94,555 • Invalidation: 4H close below $86,795 (breaks bullish OB and trendline) MY VERDICT This is a 7/10 setup that favors patience. The structure is intact, indicators are aligned, but volume concerns and the overhead supply zone keep it from being perfect. If you're positioned, stop below $86,700. If you're waiting, the pullback to demand is your entry.Price did get rejected, and now it's sitting at support as show on chart.Price is sitting still at the support: $86,795-$88,888 The conflict we predicted is causing a delay: Low volume typically signals accumulation at these levels, not distribution. The question is whether we get one more shakeout to the demand zone before the next leg.Christmas didn't really do Bitcoin any favors. Price reached 3 support levels (support cluster) at the same time now: Static support, descending support, and ascending support. (Check the chart). Volume is way low now.As predicted, price swept our demand zone at $86k and rejected exactly at the $90.3k resistance. The market has now entered a new compression phase. I have published the full breakdown of the next move here:
MonoCoinSignal
ADA: سیگنالهای متضاد بازار؛ آیا ریزش در راه است؟
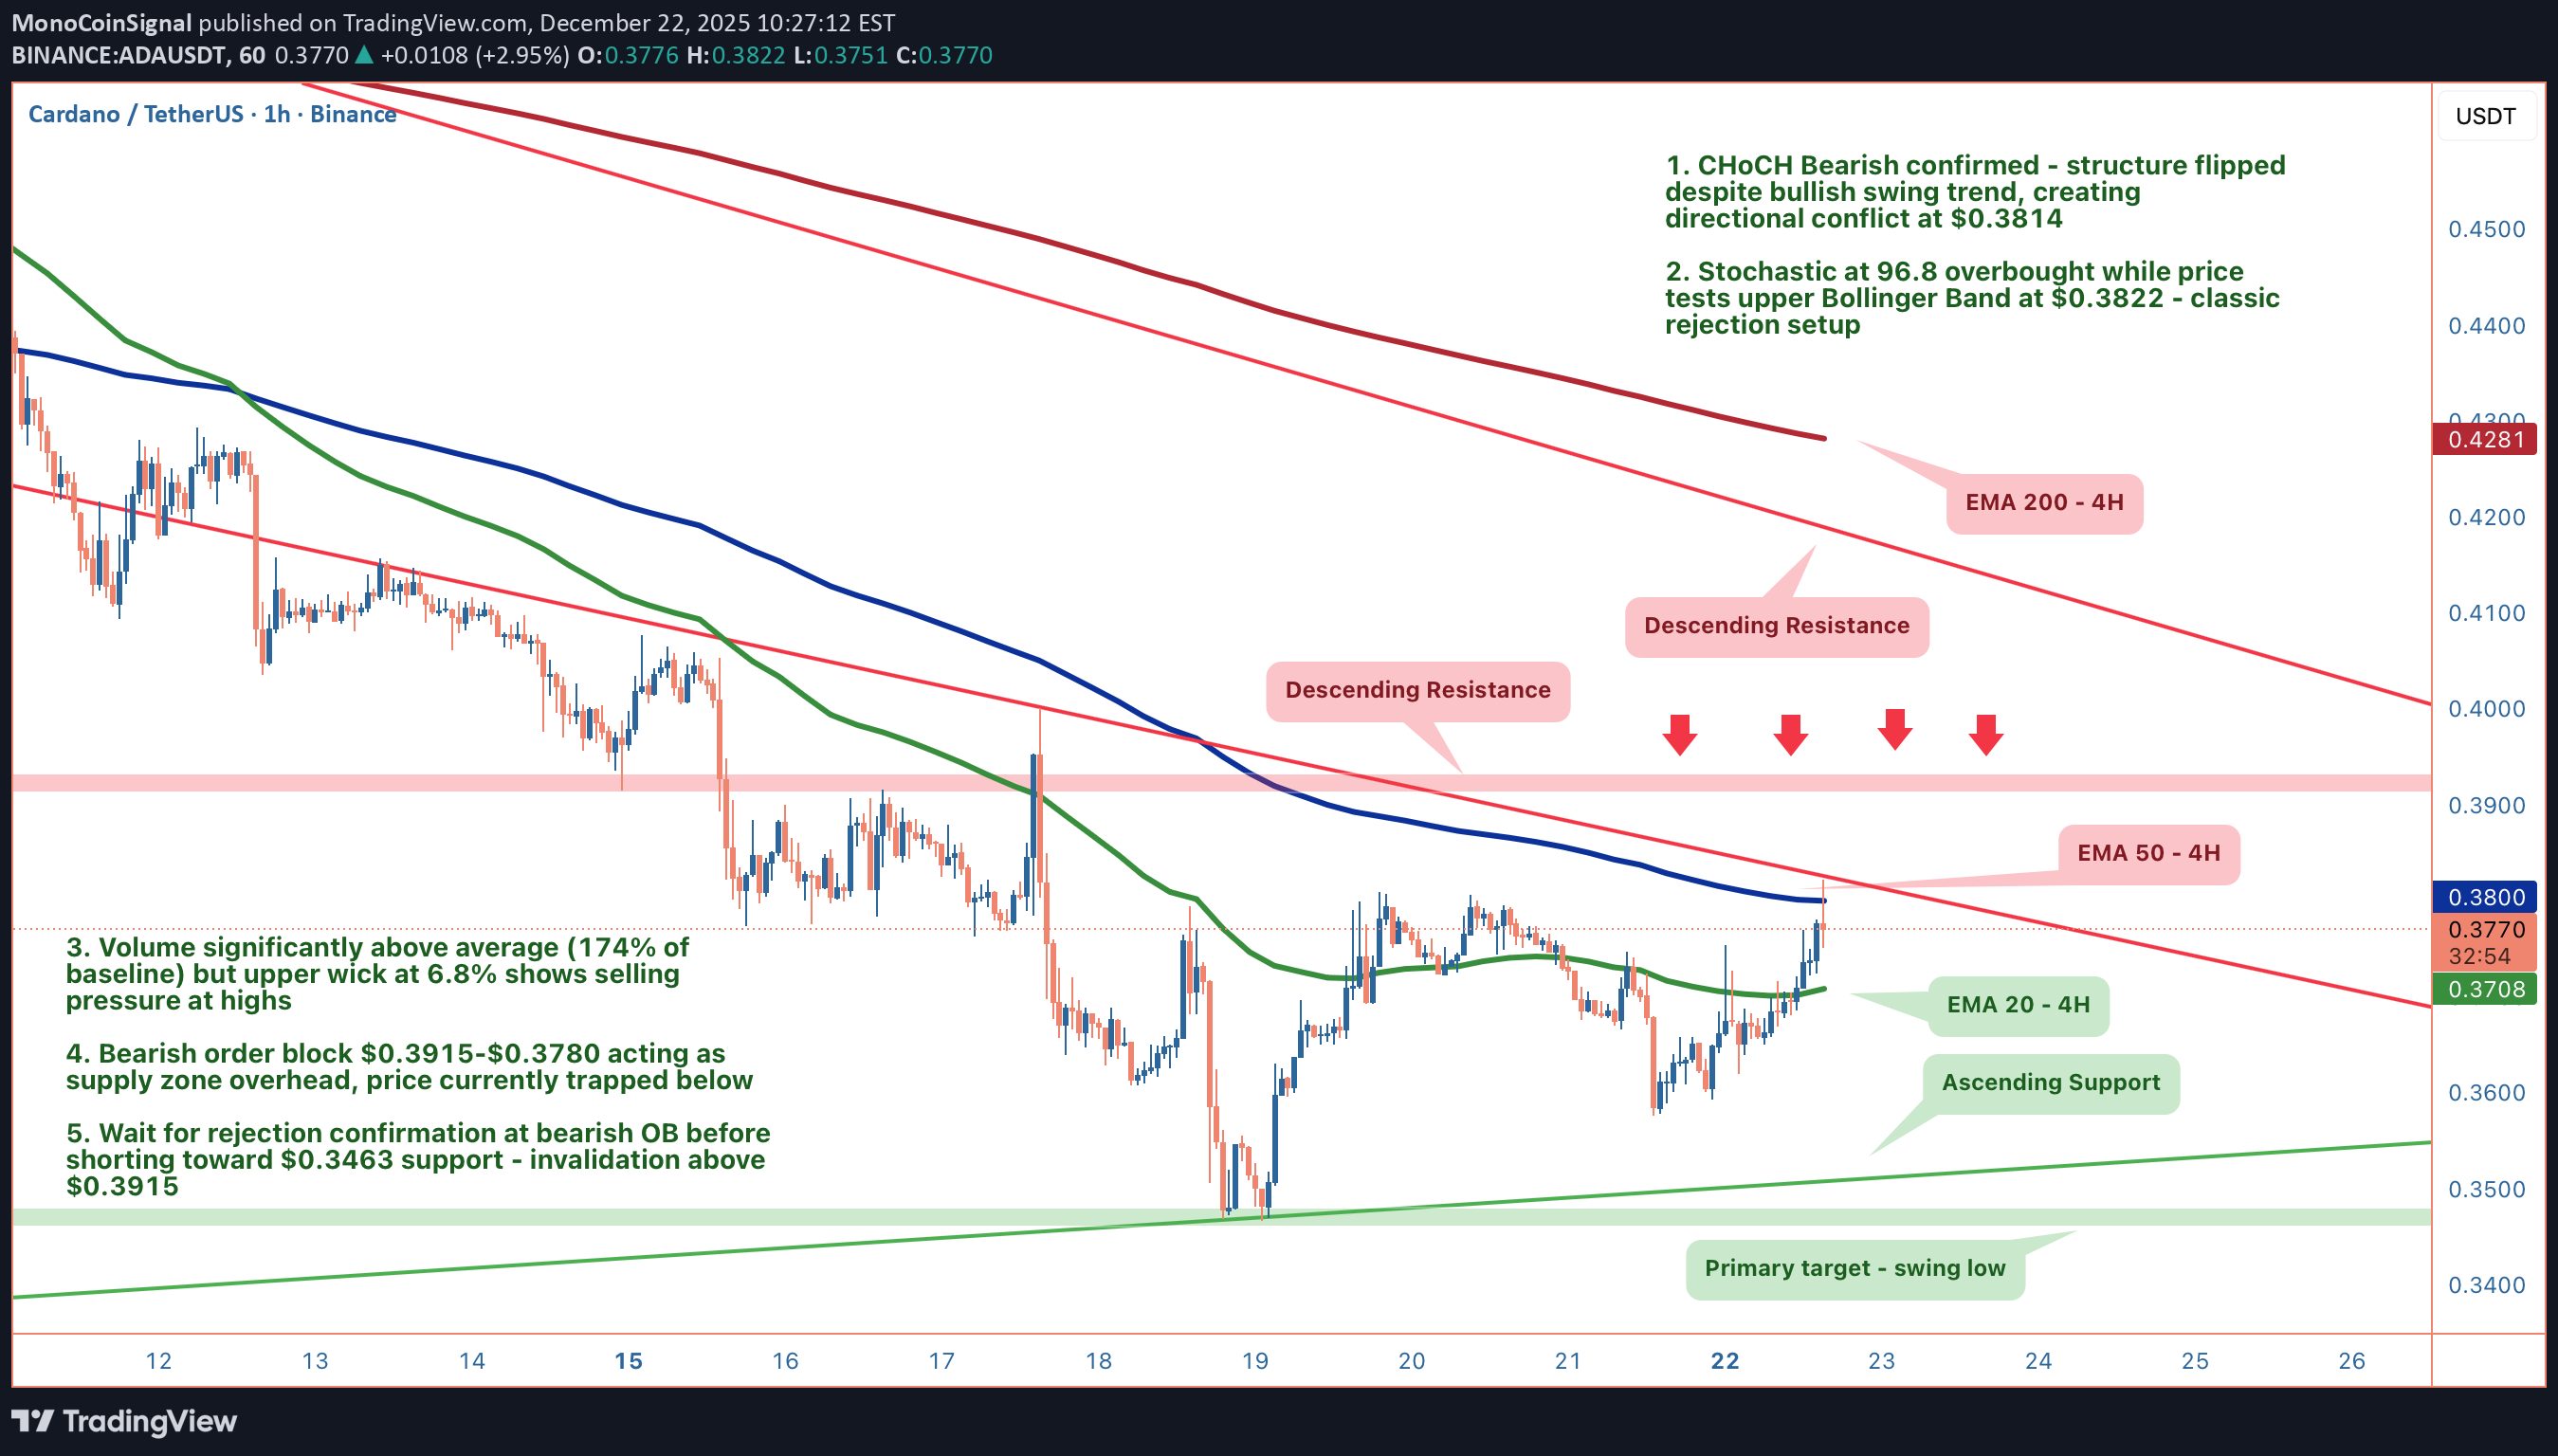
Price just rallied 5.89% to $0.3814, which looks bullish on the surface. But here's the conflict: we've got a confirmed CHoCH Bearish signal—structure just flipped downward despite the swing trend still reading bullish. When structure and trend disagree, I'm paying attention to structure. It's telling us what's happening right now, not what happened 20 bars ago. 1. THE TECHNICAL REALITY 📉 • Stochastic hit 96.8—deep overbought territory • Price kissing upper Bollinger Band at $0.3822 • 6.8% upper wick on current candle = sellers showed up at these highs • Volume 174% above average confirms participation, but the wick formation suggests distribution, not accumulation • Trading in discount zone below equilibrium ($0.4271), but that doesn't make this bullish—it just means we're in the lower half of a range that could become the upper half of a new, lower range 2. THE INDICATORS ⚖️ Bearish Signals: • CHoCH Bearish confirmed—market structure flipped downward • Stochastic 96.8 (extreme overbought) • Price rejected at upper Bollinger Band with 6.8% wick • Bearish order block overhead at $0.3915-$0.3780 (supply zone) Bullish Signals: • RSI 57.6 (neutral, not oversold) • MACD showing bullish momentum (weak but present) • Price above both EMA20 and EMA50 • Swing trend still technically bullish The Conflict: Structure says down, momentum says up. This is why my confidence is 68%, not 85%. The setup has edge, but it requires confirmation—don't front-run the rejection. 3. THE TRADE SETUP 🎯 🔴 Scenario A: Rejection & Continuation Lower • Trigger: Bearish rejection at $0.3915 bearish OB (watch for engulfing candles or strong wicks) • Entry: Confirmation of rejection in supply zone $0.3915-$0.3780 • Target: $0.3463 (swing low support) • Stop: 4H close above $0.3915 (thesis invalidated) • Secondary Support: Ascending trendline at $0.3500 if $0.3463 breaks 🟢 Scenario B: Bullish Reclaim • Trigger: 4H close above $0.4554 • Result: CHoCH Bullish confirmed—bearish setup off the table • Invalidation: Entire bearish thesis breaks above $0.3915 MY VERDICT The probability favors a rejection and move lower. We're trading the lower boundary of a descending channel with supply overhead and overbought readings at resistance. But this isn't a slam dunk—wait for price to show its hand at that bearish OB. Risk management is critical: your invalidation is crystal clear at $0.3915.
MonoCoinSignal
AAVE: The Squeeze Is On
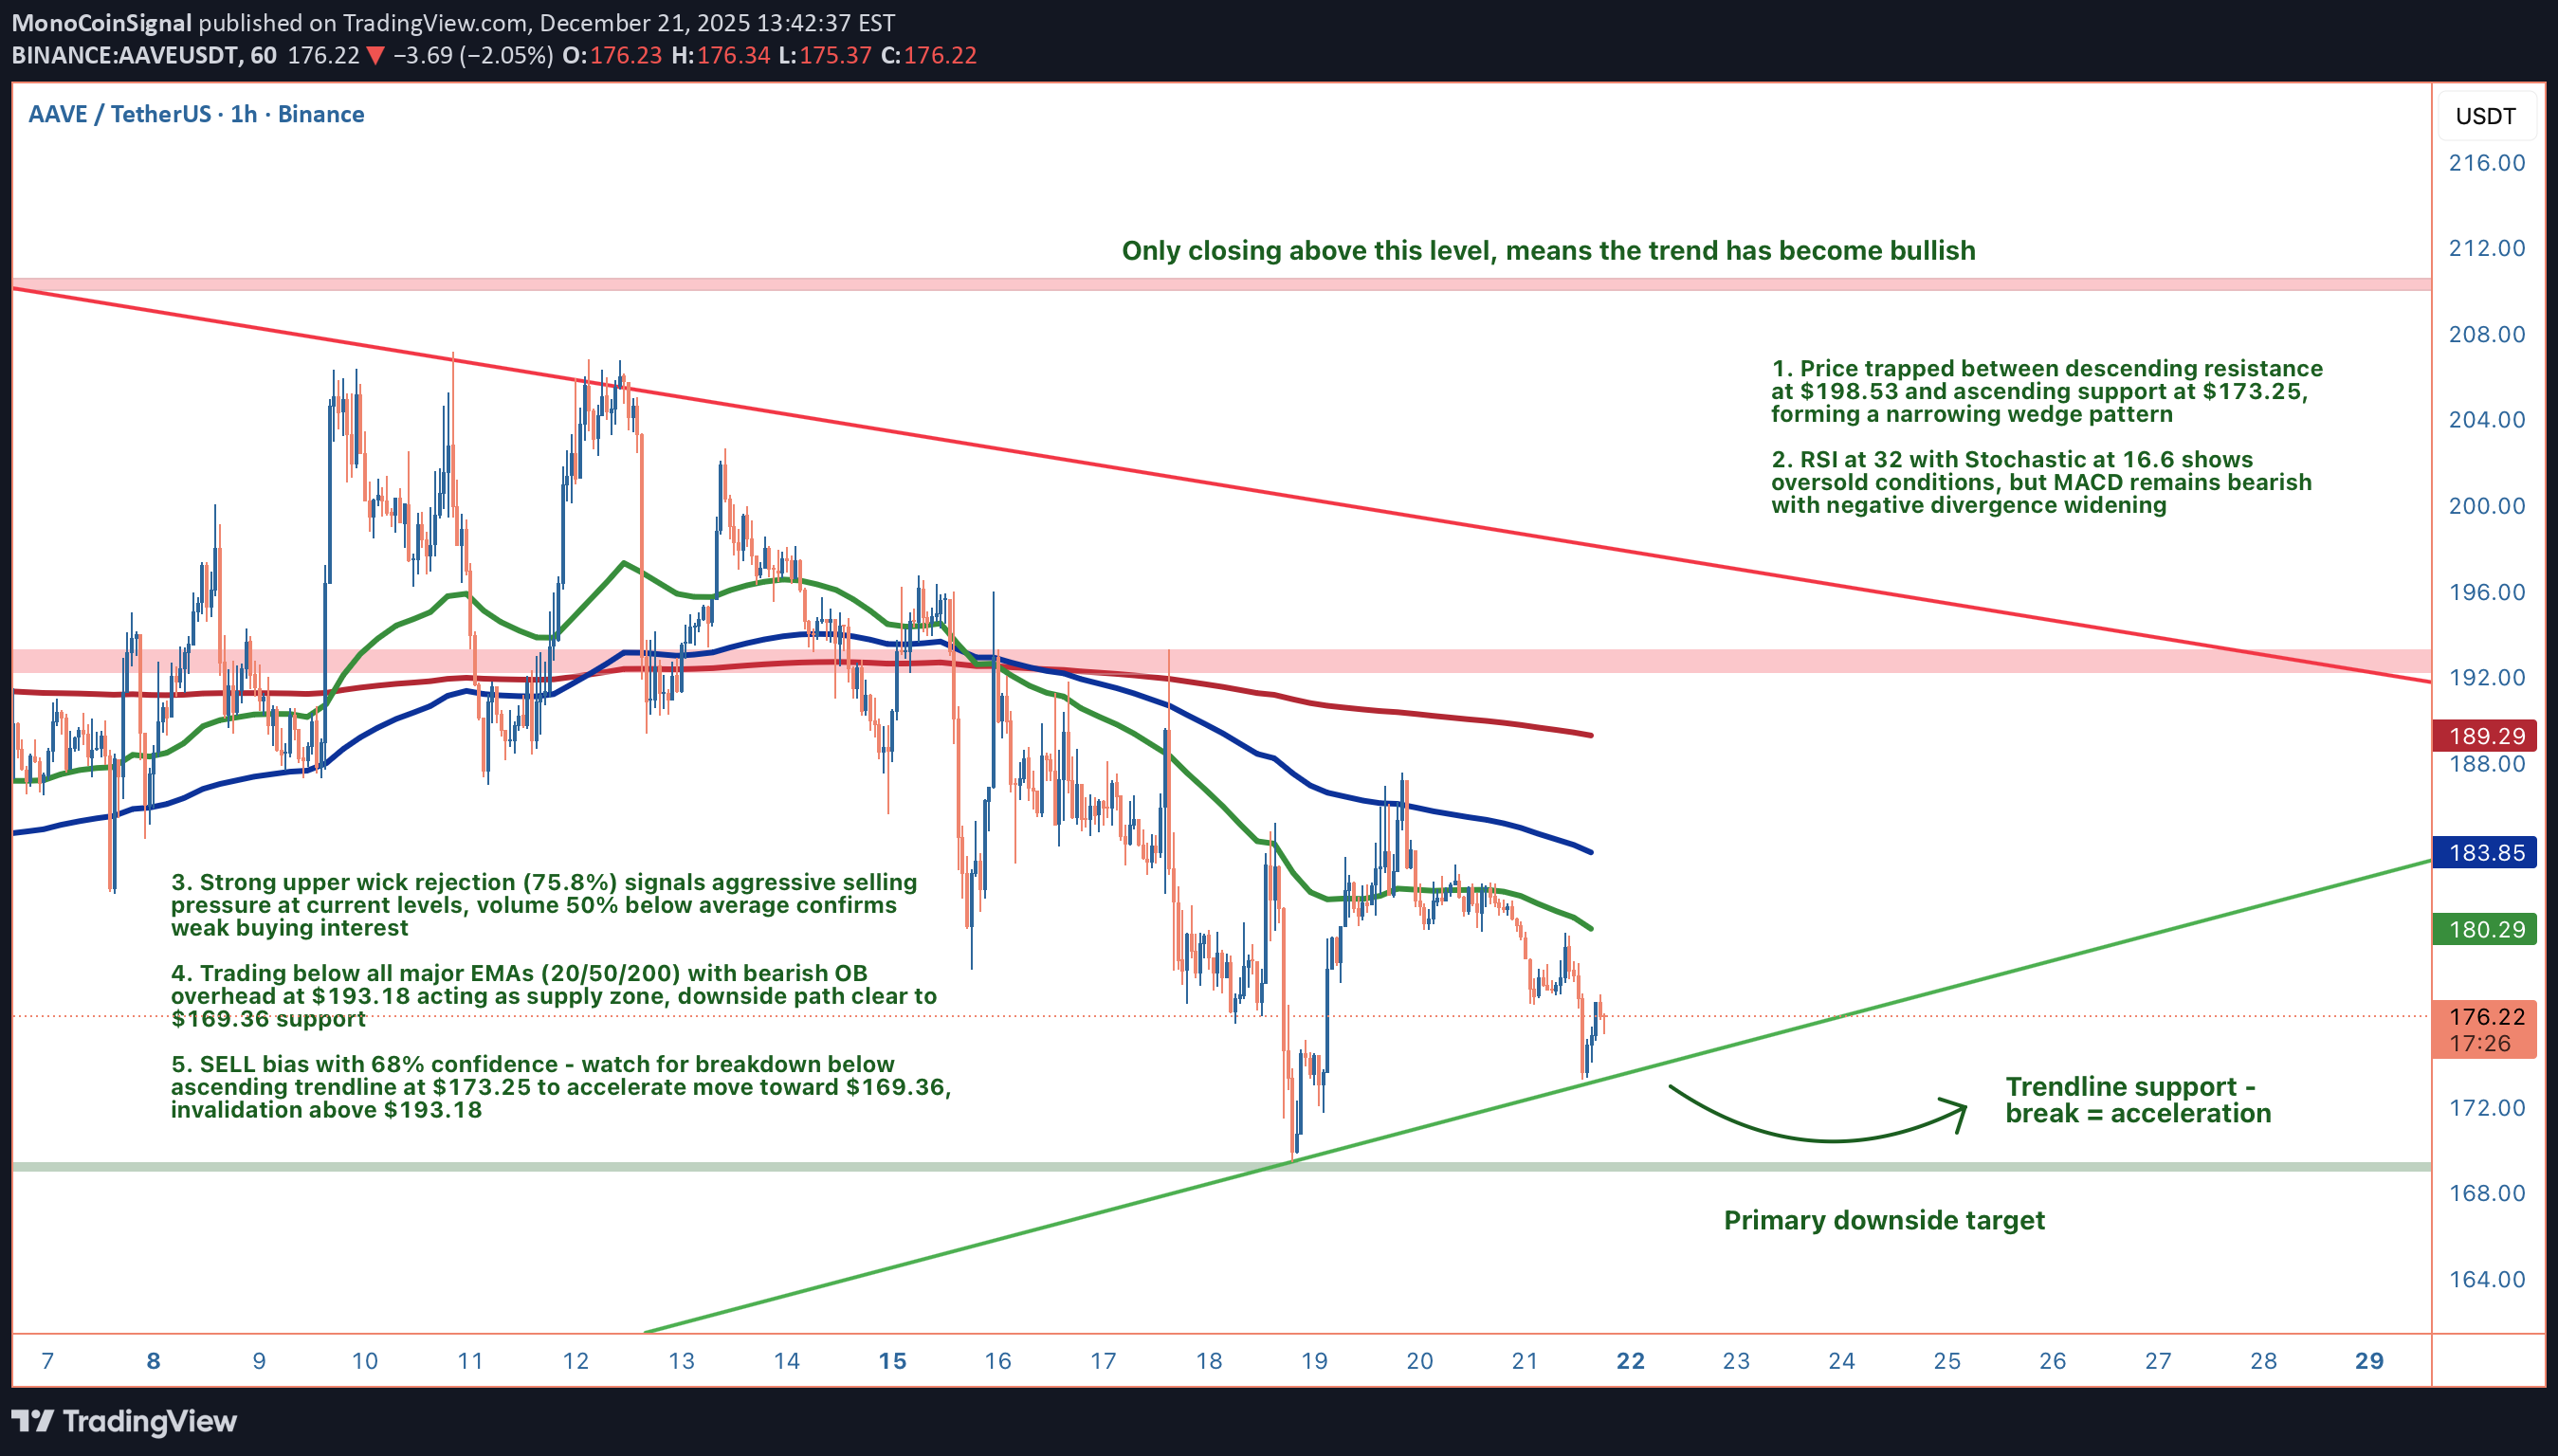
We're watching a textbook compression pattern on AAVE—price trapped between ascending support at $173.25 and descending resistance at $198.53. These narrowing wedges don't last forever. The question isn't if it breaks, it's which direction and how violently. Current price: $175.48. 1. THE TECHNICAL REALITY 📉 • Wedge Compression: Ascending support at $173.25 (4 touches from $80.01) vs descending resistance at $198.53 (8 touches from $237.08) • Trend Structure: Trading below all three major EMAs (20/50/200)—path of least resistance is down • Rejection Signal: Massive 75.8% upper wick shows aggressive selling pressure defending higher prices • Volume Context: 50% below average ($51k vs $101k)—no conviction behind bounce attempts 2. THE INDICATORS ⚖️ Bearish Signals: • MACD bearish and diverging further negative (-1.98 vs -1.70 signal) • ADX at 30.3 confirms moderate trend strength pointing south • Bearish order block overhead at $193.18-$186.41 acting as supply ceiling • Lower high structure with deteriorating momentum Bullish Signals: • RSI at 32 screaming oversold • Stochastic at 16.6 in extreme territory • Ascending trendline at $173.25 has held for months The Conflict: We're oversold, but oversold can stay oversold in a trending market. Weak volume means any bounce lacks conviction. The trendline is the last line of defense. 3. THE TRADE SETUP 🎯 🔴 Scenario A: Breakdown (Primary Path - 68% Confidence) • Trigger: Rejection at $177-$179 zone (EMA20 resistance) • Entry: Break below ascending trendline at $173.25 • Target 1: $169.36 (swing low + bullish OB top) • Target 2: $162.19 (strong support low) • Stop: 4H close above $193.18 • R/R: ~1:0.5 on first target, but probability-weighted favorable 🟢 Scenario B: Bullish Reversal (Alternative) • Trigger: 4H close above $193.18 (flips bearish OB to support) • Entry: Retest of $193.18 as support with volume confirmation • Target: $210.36 (bullish change of character) • Invalidation: Failure to hold $193.18 on retest MY VERDICT The higher probability play is watching for breakdown below $173.25 and riding it toward $169.36. We've got alignment—bearish structure, deteriorating momentum, weak volume, rejection wicks. But that ascending trendline is the make-or-break level. If it holds with a volume spike, I'd reassess quickly. Until then, the setup favors the downside. Are you fading this oversold condition or playing the breakdown? What's your read on that $173.25 trendline?Played out exactly as predicted.
MonoCoinSignal
DOGE: Wedge Squeeze Play
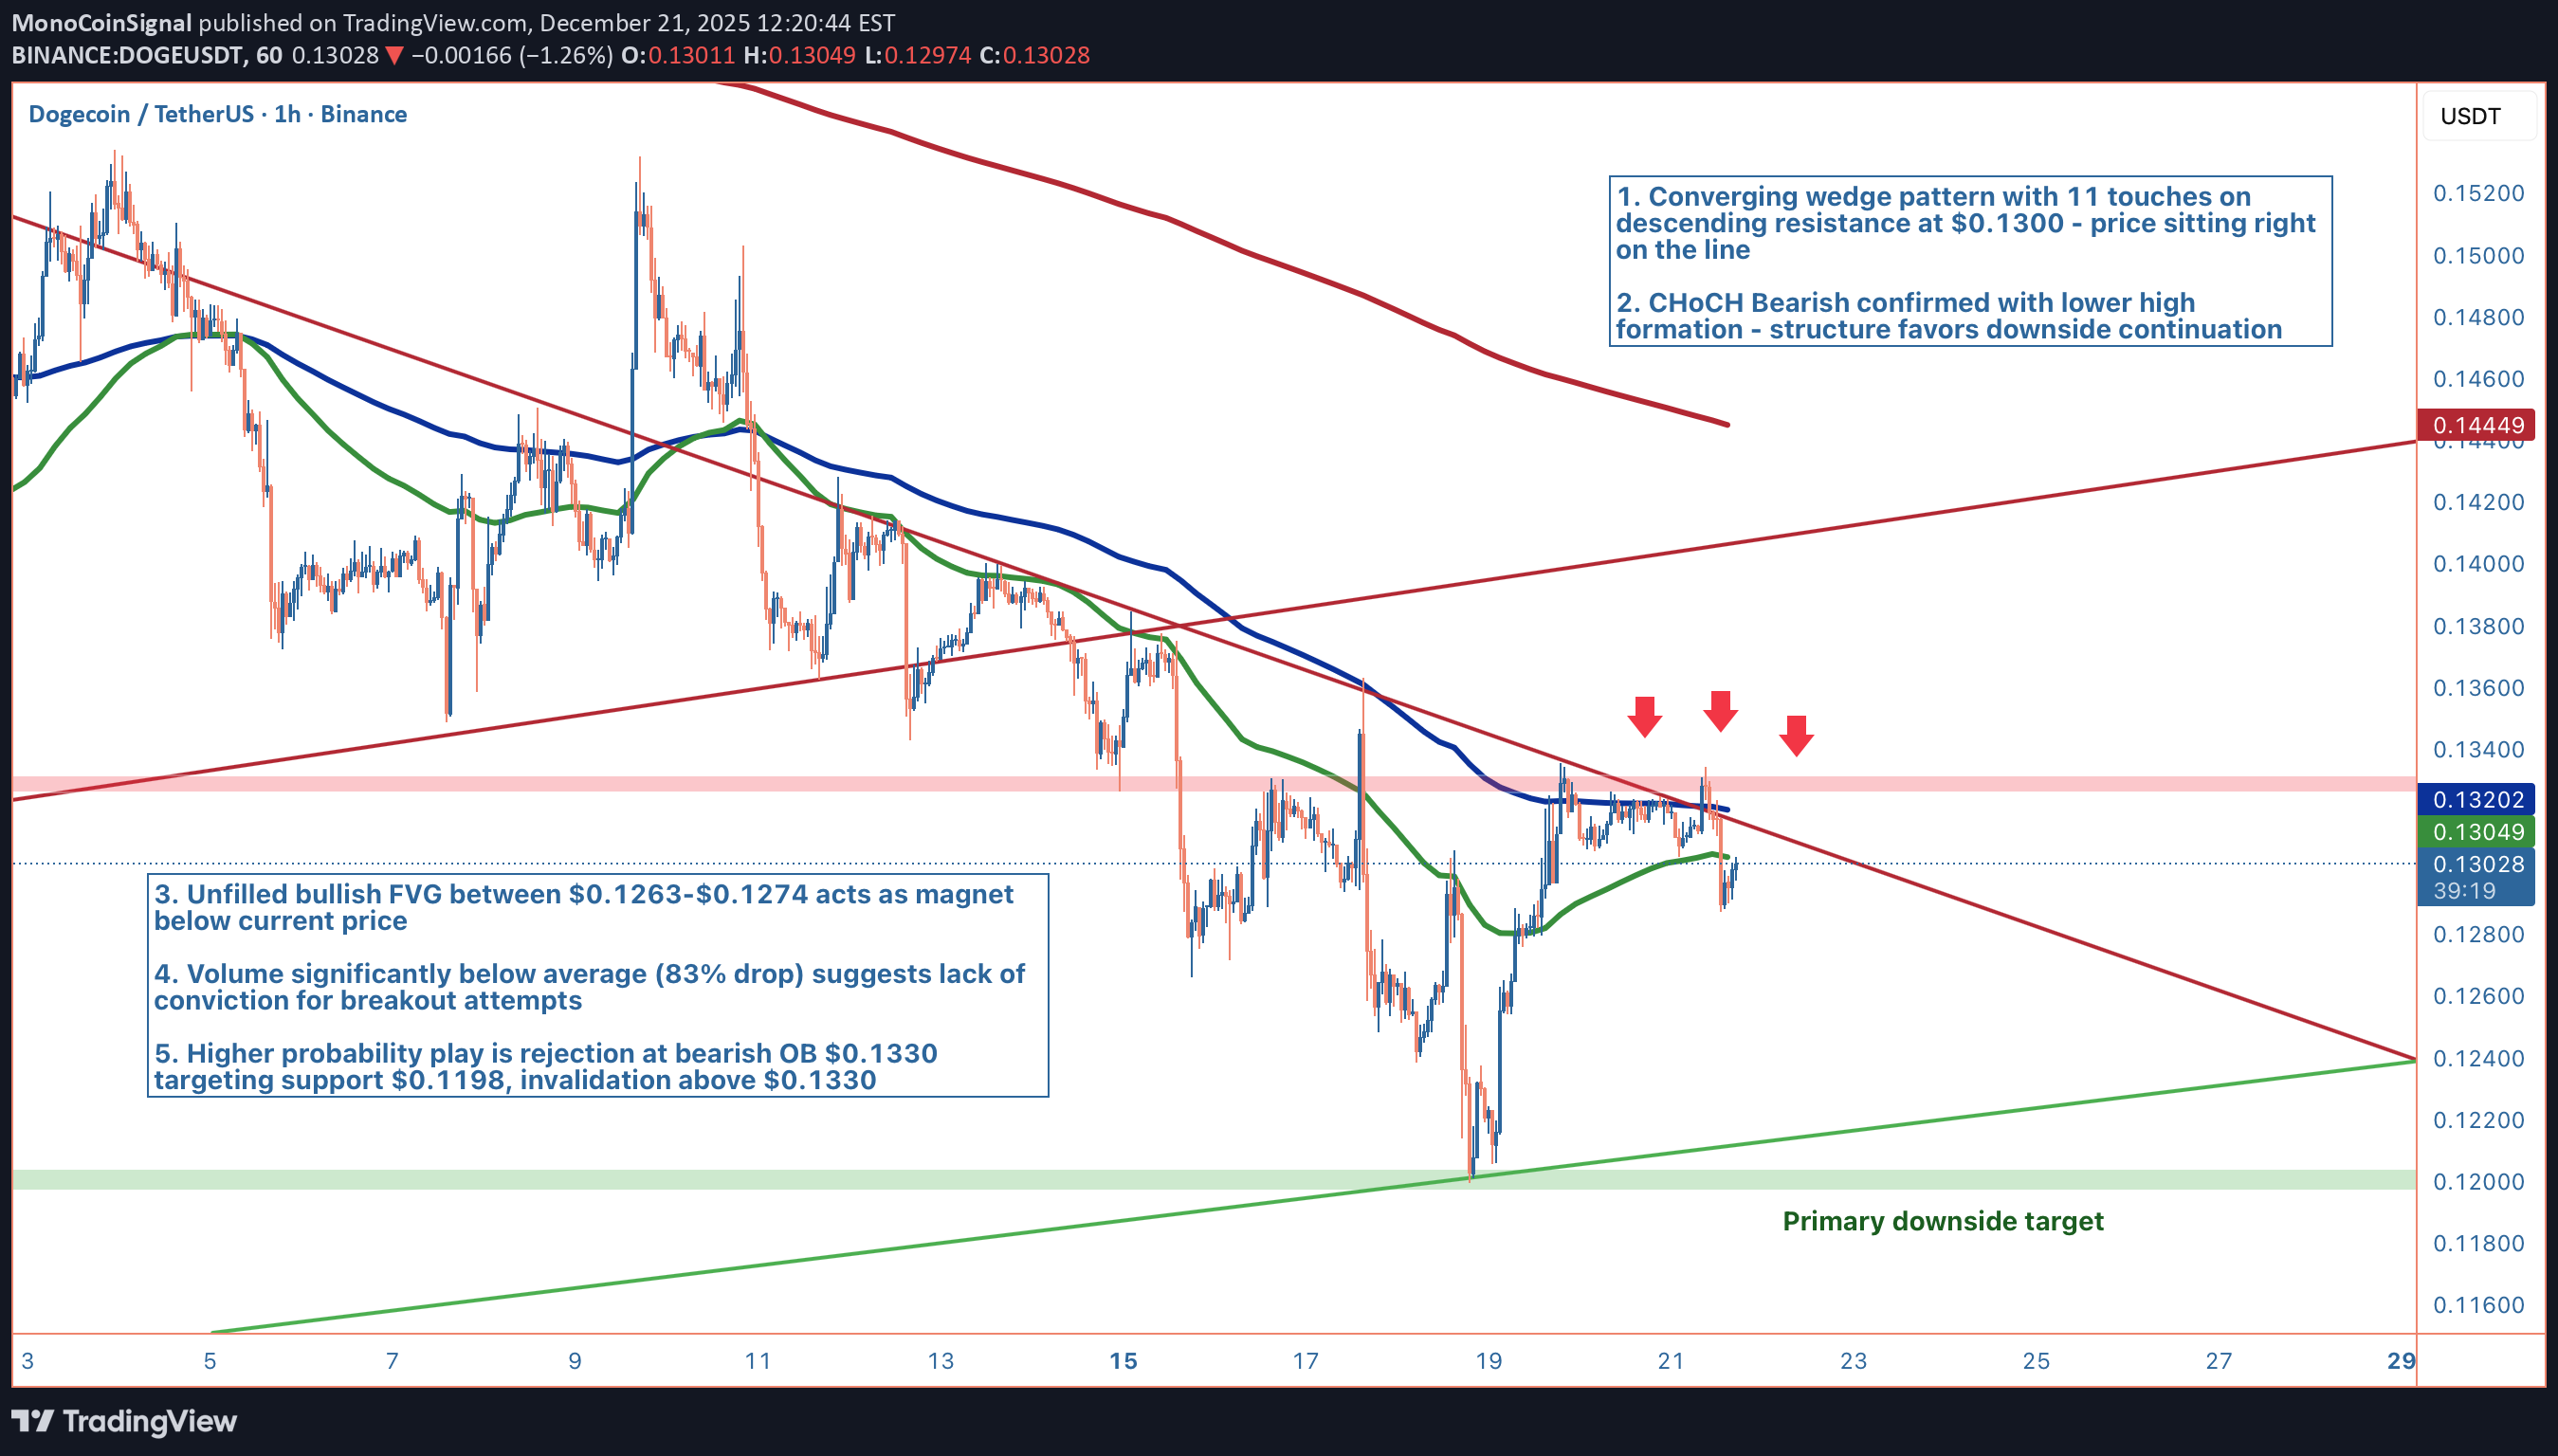
We're sitting at the decision point. DOGE has compressed into a textbook converging wedge with 11 touches on descending resistance, and price is literally touching that line at $0.1300 right now. The structure has already broken bearish (CHoCH confirmed), and with volume down 83%, the setup favors continuation over reversal. This is a patience game, the wedge resolves soon, but forcing the trade before confirmation is how traders get chopped up. 1. THE TECHNICAL REALITY 📉 • Converging wedge apex: Descending resistance from $0.1400 (11 touches) meets ascending support at $0.1200 - $0.01 squeeze zone • Structure broken: CHoCH Bearish confirmed with lower high formation, market structure favors downside • Bearish order block: $0.1288-$0.1330 acting as supply zone, price testing the top right now • Moving averages stacked bearish: Price below EMA20 ($0.1304), EMA50 ($0.1319), and EMA200 ($0.1442) 2. THE INDICATORS ⚖️ Bearish Signals: • Volume collapse: $121M vs $728M average (83% drop), zero conviction behind breakout attempts • Price trading in discount zone but unable to reclaim premium • CHoCH Bearish with lower highs, structure thesis intact Bullish Signals: • MACD bullish crossover (0.0002 vs 0.0000), marginal at best • Price above HMA55 ($0.1292) and Bollinger middle band ($0.1296) • Lower wicks (34.2%) exceeding upper wicks (14.5%) on current candle The Conflict: RSI at 58.3 sits in neutral territory, not oversold enough to signal reversal, but not overbought either. The single-candle wick analysis shows buying pressure, but broader structure with CHoCH bearish matters more than one bar. 3. THE TRADE SETUP 🎯 🔴 Scenario A: Wedge Rejection (Higher Probability) • Trigger: Rejection at bearish OB $0.1330 with descending resistance hold • Entry: Scale in $0.1300-$0.1310 on rejection wicks • Target 1: $0.1263 (unfilled bullish FVG, imbalance needs filling) • Target 2: $0.1198 (swing low + ascending support + bullish OB zone) • Stop: 4H close above $0.1330 (bearish OB breaks, thesis invalidated) 🟢 Scenario B: Wedge Breakout (Requires Confirmation) • Trigger: Strong 4H close above $0.1330 with volume expansion • Entry: Retest of $0.1330 as support after breakout • Target: $0.1505 (CHoCH bullish reversal level, premium zone entry) • Invalidation: Failure to hold $0.1330 on retest, rejection back into wedge MY VERDICT The setup favors Scenario A with 62% confidence. Structure is bearish, volume is non-existent, and the unfilled FVG at $0.1263 acts as a magnet. But the wedge apex means the break happens soon... wait for the rejection at $0.1330 or the confirmed breakout above it. Let the market show its hand before committing capital. What's your read on this compression? Are you waiting for the break or already positioned for one scenario?
MonoCoinSignal
Bearish Trap or Real Breakdown?
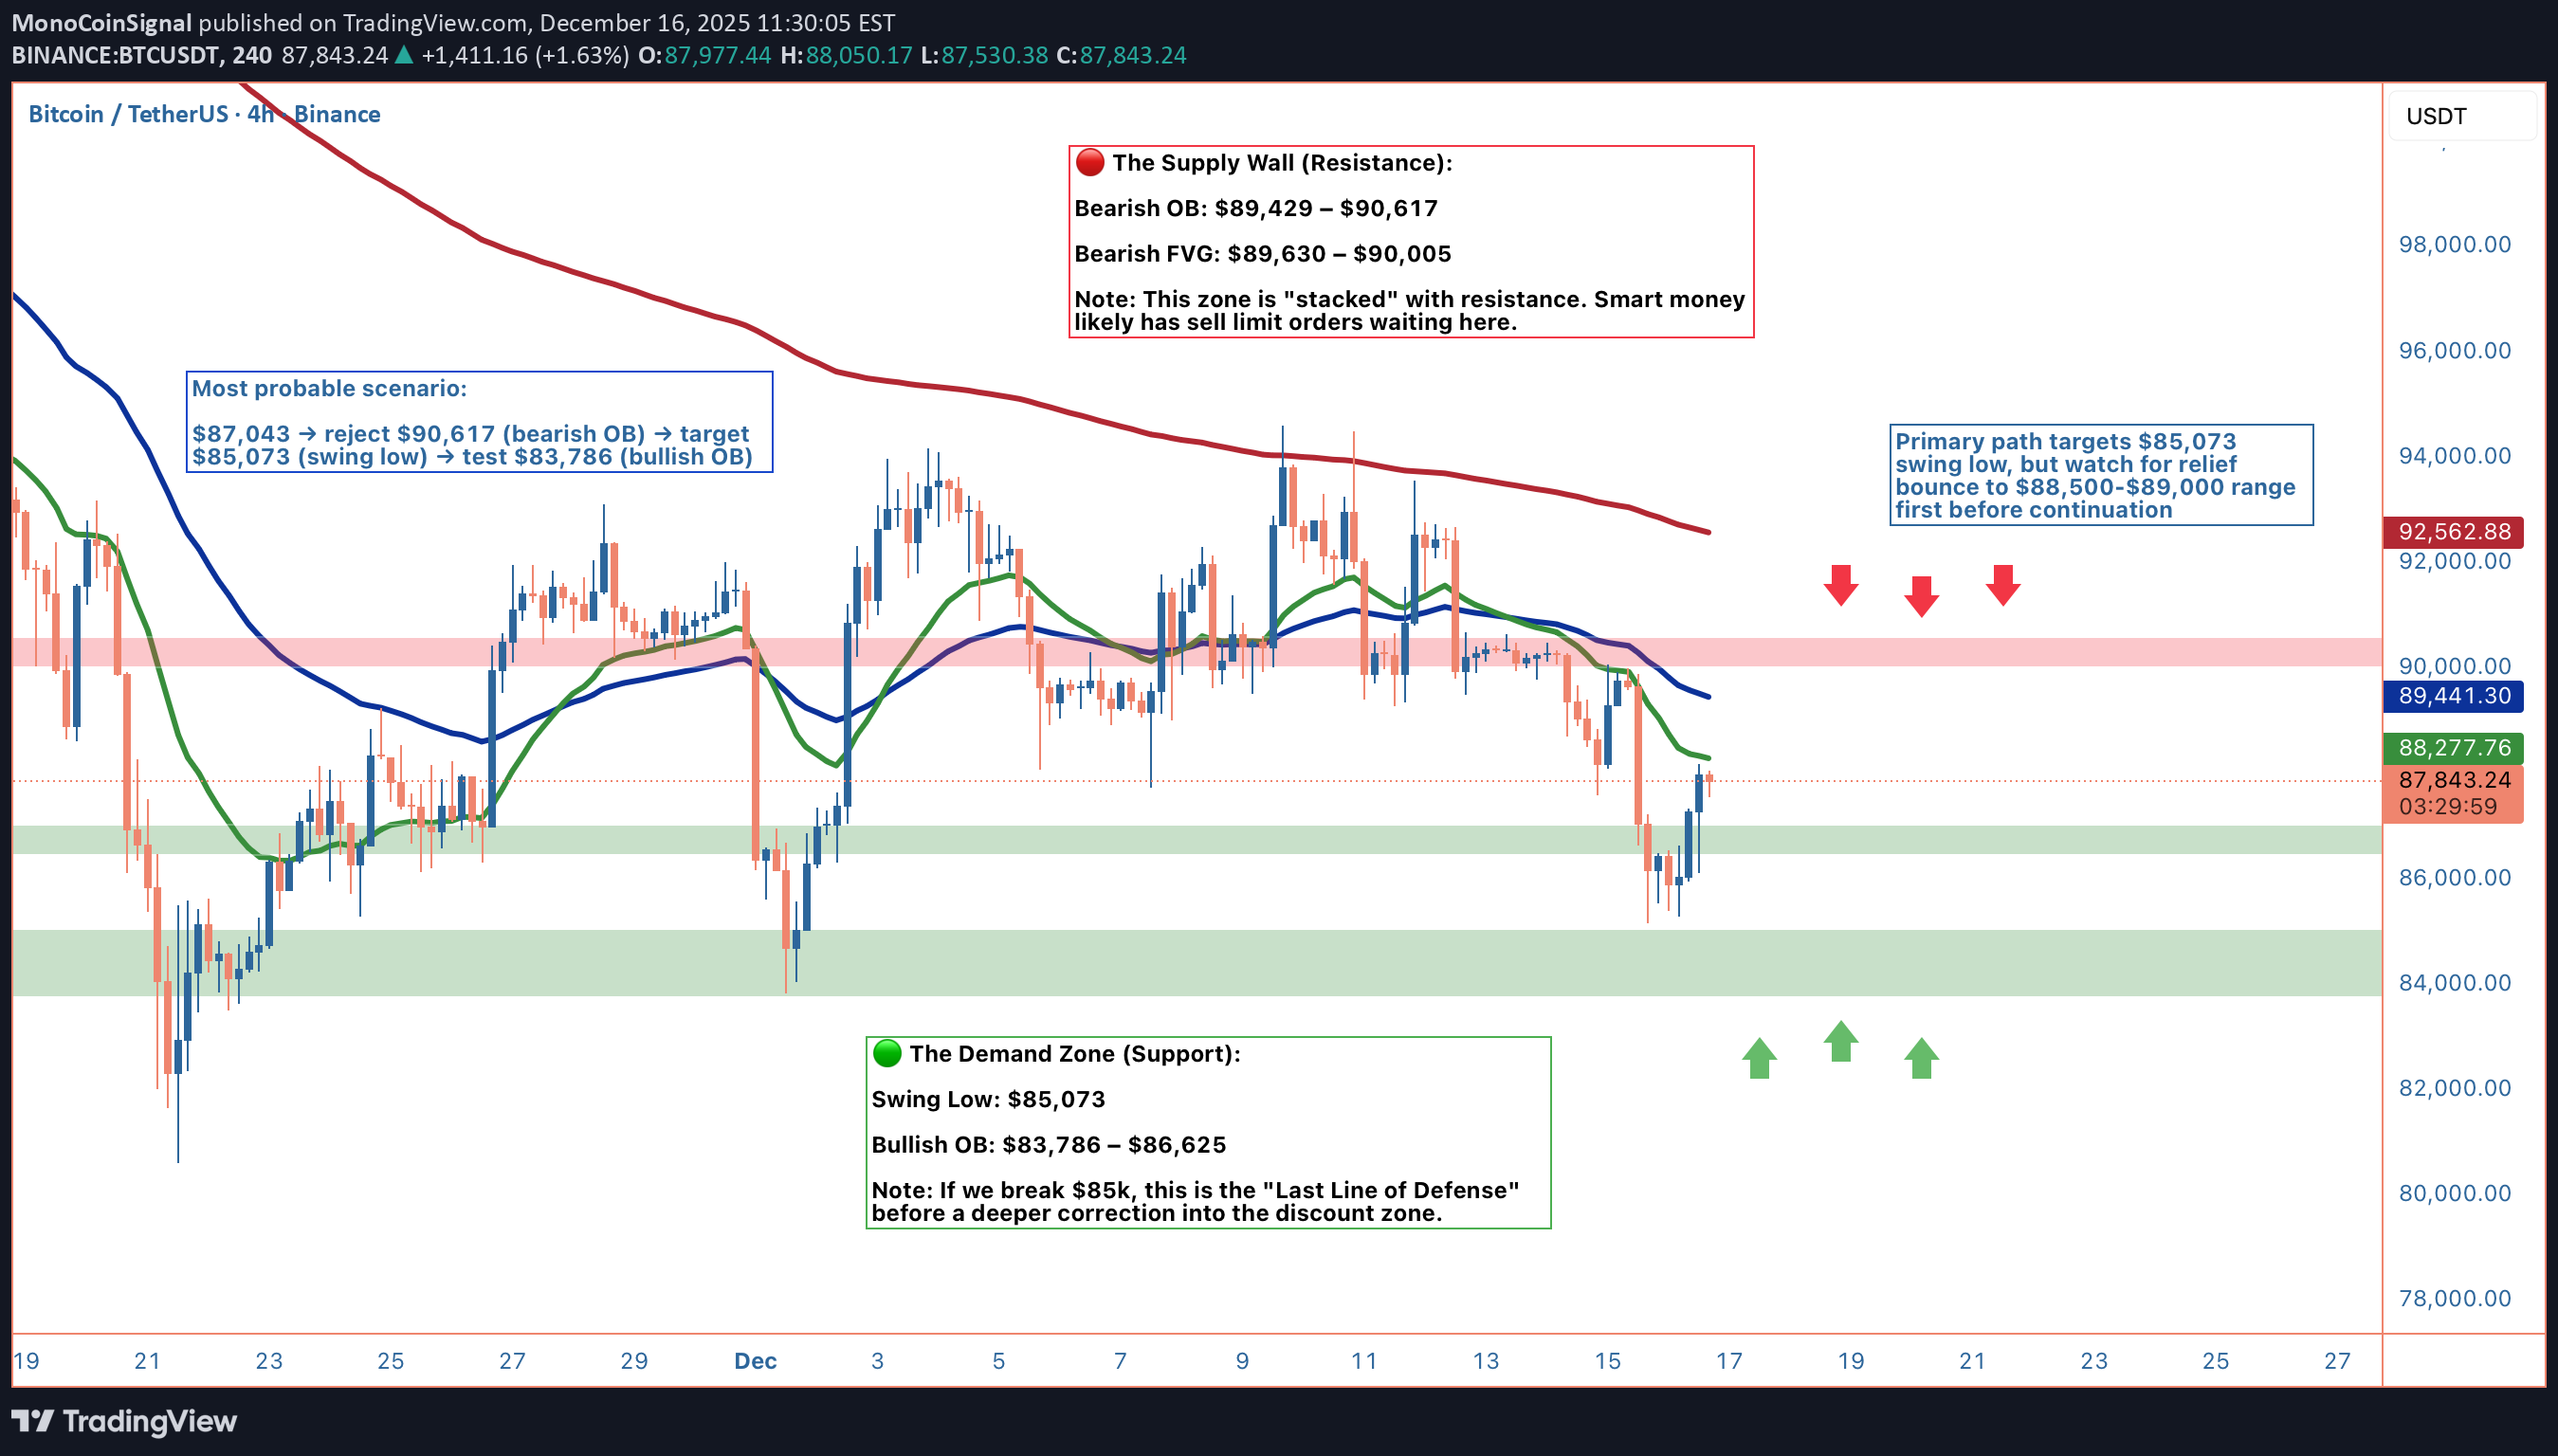
Right now, we are sitting at $87,158, which puts us smack in the middle of equilibrium between the recent swing high at $94,555 and the swing low at $85,073. This isn’t just a random spot on the chart; it’s a critical decision point where the market structure is giving us distinct clues. The big development here is the CHoCH Bearish that just confirmed. For those tracking Smart Money Concepts, that is a Change of Character to the downside, meaning we have broken the sequence of higher lows. The bullish structure that held for weeks has flipped, and we need to adjust our playbook accordingly. Let’s talk technical confluence, because when you layer the indicators, the story gets very specific. Price is trading below all three major EMAs (20, 50, and 200), creating a bearish alignment across the board. When you are below your moving average stack like this, the path of least resistance is typically down. The MACD confirms this with a deeply bearish reading of -1087, and the gap between the signal lines is widening—momentum is pointing south with conviction. However, this is where the setup gets tricky and why you need to think two moves ahead. The RSI is hovering around 34, approaching oversold territory, and the most recent candle printed a massive 64.5% lower wick. That tells us someone stepped in to buy "fair value" with size. We are not quite at panic levels, but we are close enough that a relief bounce is absolutely on the table. This creates a tension in the market: The structure says "sell," but the immediate momentum says "bounce." The tie-breaker here is the ADX, which is sitting at 62.7. This signals a powerful trending environment. This isn't choppy, directionless price action; when ADX is above 60, trends tend to persist. So, while the RSI warns of a bounce, the ADX says do not fight the trend without clear confirmation. So, here is the roadmap. The primary scenario favors a rejection at resistance. Any relief bounce from here likely runs straight into the Bearish Order Block (Supply Zone) between $89,429 and $90,617. This area is stacked with confluence: it contains unfilled sell orders, a bearish FVG, and sits just below the premium zone threshold. If we see price rally into that $89k–$90k region, it becomes a high-probability short opportunity. We would be looking for rejection signals there to target the swing low at $85,073. Break that level, and we are looking at the Bullish Order Block demand zone between $83,786 and $86,625, where I’d expect serious buying interest to finally emerge. If you are looking to take a trade, patience is your edge here. Shorting into the hole at $87k with an oversold RSI is risky. The better risk-adjusted play is waiting for that bounce into the $88,500–$90,000 range. Your invalidation level (stop loss) is a 4H close above $90,617. If price closes above that level, it negates the bearish order block and invalidates the supply thesis. On the flip side, if the bulls manage to reclaim $91,066 (the premium zone threshold), it triggers a CHoCH Bullish reversal. That would flip the entire structure back in favor of the bulls, targeting $94,185. But right now, with the volume running 2x the average and the internal bias sitting at neutral/bearish, that is the lower probability path. Bottom line: The structure favors downside continuation, but only after a potential relief bounce. We have a confirmed trend shift, bearish EMA stacks, and strong volume on the decline. Don't get trapped shorting the bottom of the range, and don't get trapped longing a "dead cat" bounce. Wait for the test of supply at $90k, watch for the rejection, and trade the path of least resistance. Confidence is sitting at roughly 75% on the bearish continuation due to the structural damage, but the oversold conditions demand we wait for better entry prices.Yesterday I explicitly warned you not to chase shorts in the hole at $87k. I told you the structure was bearish but the momentum was oversold, and that we needed a relief bounce to reset the board. What happened? Bitcoin did exactly that. We pushed up to $90,320, running right into that Bearish Order Block and supply zone we mapped out, only to immediately reject and collapse right back down to equilibrium around $87,000. If you followed the playbook, you didn't get trapped longing the pump, and you had a perfect opportunity to fade that move right at resistance. Now the dust has settled, and the structure has evolved from a simple downtrend into a massive Converging Wedge. We are sitting at $86,885, essentially flat from yesterday’s close, but the walls are closing in. We have a 9-touch ascending support trendline holding the floor at $85,522 and a 20-touch descending resistance line capping us at $90,637. The range has tightened to just $5,114. This is textbook compression. Volatility is loading for the next big leg. Let’s look at the internals because the momentum picture has shifted since the rejection. The ADX has dropped from 62.7 to 46.2. The trend is still strong, but the intensity is cooling off as we consolidate inside this wedge. More interestingly, the MACD is showing early signs of bullish divergence, moving from -1087 to -745 while price stayed flat. That is not a buy signal yet. It’s just a sign that the aggressive selling pressure is taking a breather after slamming price down from that $90k wick. The RSI is sitting at 34, still hovering in oversold territory, and the recent candle printed a 45.6% lower wick. Buyers are still defending the bottom of this wedge. So what is the play now? The "easy" trade fading the bounce is done. Now we are in the squeeze. The Bearish Case (Primary): The rejection from $90,320 confirms that bears are defending the supply zone aggressively. We are currently stuck at equilibrium. Any bounce from here likely hits a brick wall at the confluence of the descending resistance and the Bearish Order Block between $89,500 and $90,666. If we reject there again, the target is the wedge support at $85,522. A 4H close below that support line is the kill shot. It opens the trapdoor to the Bullish Order Block at $84,030 and likely lower. The Bullish Case (Alternate): For the bulls to regain control, they need to do more than just wick up like they did today. They need a decisive 4H close above $91,091. That is the line in the sand. We saw today that price can go near there, but it can't stay there. Until we close above that level to confirm a CHoCH Bullish, every rally is just a lower high inside the wedge. The Setup: Patience is your edge again. The volume has dropped significantly (currently ~$2,500 vs average ~$3,000). This is typical for wedge consolidation and tells me the next move will be explosive. If you are Bearish: Wait for a tap of the $89,500–$90,666 zone. Use the descending trendline as your shield. Stop loss goes strictly above $90,666. If you are Bullish: Do not front-run this. Wait for the wedge to break and price to reclaim $91,091 on a closing basis. Bottom Line: The rejection from $90,320 validated our bearish supply thesis perfectly. Now we wait for the wedge to break. The structure remains bearish as long as we are below $91k, but the compression suggests a violent move is imminent. We caught the top. Now let's catch the break. Are you betting on the wedge support holding, or is $85k about to give way? 👇Played out exactly as predicted.
Disclaimer
Any content and materials included in Sahmeto's website and official communication channels are a compilation of personal opinions and analyses and are not binding. They do not constitute any recommendation for buying, selling, entering or exiting the stock market and cryptocurrency market. Also, all news and analyses included in the website and channels are merely republished information from official and unofficial domestic and foreign sources, and it is obvious that users of the said content are responsible for following up and ensuring the authenticity and accuracy of the materials. Therefore, while disclaiming responsibility, it is declared that the responsibility for any decision-making, action, and potential profit and loss in the capital market and cryptocurrency market lies with the trader.